Real User Monitoring (RUM) is a performance monitoring technique for websites. The method involves tracking the actions of each visitor to a site and the delivery of the website elements that those actions request.
Here is our list of the best real user monitoring services.
- Pingdom Real User Monitoring EDITOR’S CHOICE A subscription service that identifies the locations that users access a website from and categorizes responses and performance by a range of attributes to enable root cause analysis of performance issues.
- Datadog Real User Monitoring (FREE TRIAL) Delivers key insights into application’s front-end performance from a real user’s perspective. User journeys are correlated seamlessly with synthetic tests, traces, logs, back-end metrics along with network performance to unmask any user issues stack-wide.
- Site24x7 Website Monitoring (FREE TRIAL) This monitoring subscription package includes credits for real user monitoring runs per month. This is a cloud-based system.
- ManageEngine Applications Manager (FREE TRIAL) Profile all of your applications, including those running on the Web with both synthetic and real user monitoring. Available for Windows Server, Linux, AWS, and Azure.
- Sematext Experience An alert-based system that notifies operators when performance drops below acceptable levels.
- Uptime.com This online package of services includes a range of Web application checks that includes real user monitoring.
- AppDynamics End User Monitoring Focuses on walkthrough graphs for sample users and also includes aggregated data.
- Dynatrace Digital Experience Monitoring Includes both real user monitoring and synthetic user modeling facilities and feeds through to performance analysis.
This monitoring method isn’t a marketing technique or a system for spying on people. Its focus is on the activities of the webserver to ensure that everything is working properly. It examines whether each service utilized in a website is working and being implemented in a timely manner. The monitoring strategy shows whether a particular service is able to cope with the demand volumes that the site experiences and also that each service is able to interact with other elements in a site to ensure that a typical journey through the website is properly supported.
Real user monitoring will expose issues caused by capacity limits, coding errors, and design faults.
Website monitoring strategies
Monitoring the performance of a website can be carried out through two perspectives: checking and testing. The first strategy is the traditional monitoring method of checking the status of each element involved in the delivery of a website. The testing strategy involves a run-through of a website to see what happens – which services get requested and how all of the resources cope with the delivery of each service.
Real user monitoring is one of the methods available for testing a site’s performance. The other is synthetic user modeling.
When any program is under development, it needs to be tested before the job can be signed off as complete. Tests usually include isolation testing, to make sure the program runs all the way through to successful completion, performing all the tasks it was designed for; boundary testing to make sure the program interacts successfully with other parts of the system, and destruction testing to see how the program copes with heavy demand or unexpected inputs.
The acceptance testing strategy can be carried through the lifecycle of a system into production. This will provide performance checks while the suite of software and hardware is operating to deliver a website to the general public. Rather than relying on the inventiveness of a tester, the real user monitor lets site visitors carry out testing. This involves gathering data on the responses of the system to access by a member of the public.
Real user monitoring vs synthetic user modeling
In real user modeling, actions are recorded, anonymized, and aggregated because the tests are not interested in the user as a sales target, but in the resilience and responsiveness of the system. Synthetic user modeling starts with a requirement to test an aspect of a website. The synthetic modeler then generates requests to trigger that service in a specified volume and measures performance.
The difference between real user monitoring and synthetic user modeling is that the actions of the user are made up of the synthetic user modeler but are supplied by real people in real user monitoring.
Synthetic user modeling is useful for testing a website or a new page before it goes live. However, once a site is live, the best way to check whether the system is fit for purpose is to gather statistics on what happens when each visitor accesses the site.
Real user monitoring benefits
The biggest issues website owners are concerned about are site availability, error rates, and response times. Real user monitoring supplies constant checks on these two factors both overall for a site and also for each element in a site individually.
There are many different categories of response time, which is also known as load time. These include the time it takes for the title of the site to be visible, the time it takes for text to appear and for interactive elements, such as links to be active. Also worth measuring are the load times for images on a page and for services, such as a video player to be fully operational.
Once the page has been loaded, the performance of drop-down menus, pick lists, and autocomplete functions can also be measured and the playback performance of a video on a page can also be monitored.
The measurement of error rates can be refined with real user monitoring. It is possible to check whether a load error occurs once, many times, or always. An infrequent load error could be due to services beyond the control of the website’s operator, such as the user’s browser, or an interrupted connection to the webserver. Intermittent errors would be caused by capacity limits or poorly designed interfaces. A constant problem shows that a specific service has failed.
Availability monitoring is built into real user monitoring. However, this is one aspect where synthetic user monitoring is probably a better testing strategy. A performance tester that pings the webserver from different locations in the world is able to check whether content delivery networks and cache servers are operating correctly. Those are generated tests rather than real user monitors.
Real user monitoring services
Real user monitoring systems don’t need to operate on the same server that delivers a website. In fact, as many websites are served by a number of different servers, tracking the performance of one server wouldn’t give the full picture of the site’s performance.
Website monitoring can be performed very proficiently through cloud-based services. SaaS systems have the advantage of combining testing strategies and the software to perform them with a remote location to carry out the checks. A real user monitoring service relies on the expertise of the designers of the monitoring system because the accumulated knowledge of the monitoring company gets added to the analytical engine of the system. It is not enough to gather statistics on every user’s visit to a site – that data needs to be interpreted and linked to each service that delivers a particular element of the site.
The best real user monitoring services
While there are many real user monitoring services available today, only a handful are exceptional and worth subscribing to. We have examined the market for real user monitoring services and identified the ones that are really worth the money that they are charging. All of the real user monitors that we recommend here are cloud-based services.
Our methodology for selecting a real user monitoring tool
We reviewed the market for real user monitoring systems and analyzed tools based on the following criteria:
- The ability to record and rerun user journeys
- Aggregated data on consumer actions and feature responses
- The ability to run around the clock unattended
- Automated performance alerts
- Manual analysis support
- A free trial or a demo that provides an opportunity for a risk-free assessment
- Value for money from a testing system that spots errors and is offered at a good price
With these selection criteria in mind, we have identified tools that can collect and consolidate usage statistics per page or per feature on a site.
1. Pingdom Real User Monitoring (FREE TRIAL)
Pingdom offers two service plans. One of them is its Real User Monitoring service and the other is a Synthetic Monitoring system. It is possible to take out both plans to get a full set of website performance assessment tools.
Key Features:
- Map display of visitor locations
- Response time averages
- Live access volume counts
- Correlation with system performance
- Performance alerts
Why do we recommend it?
Pingdom Real User Monitoring is a service that will probably surprise some because the name of the platform implies that all it does is Ping-based availability checks. While the platform does offer constant uptime checking, it also has page load speed testers and this real user monitoring package.
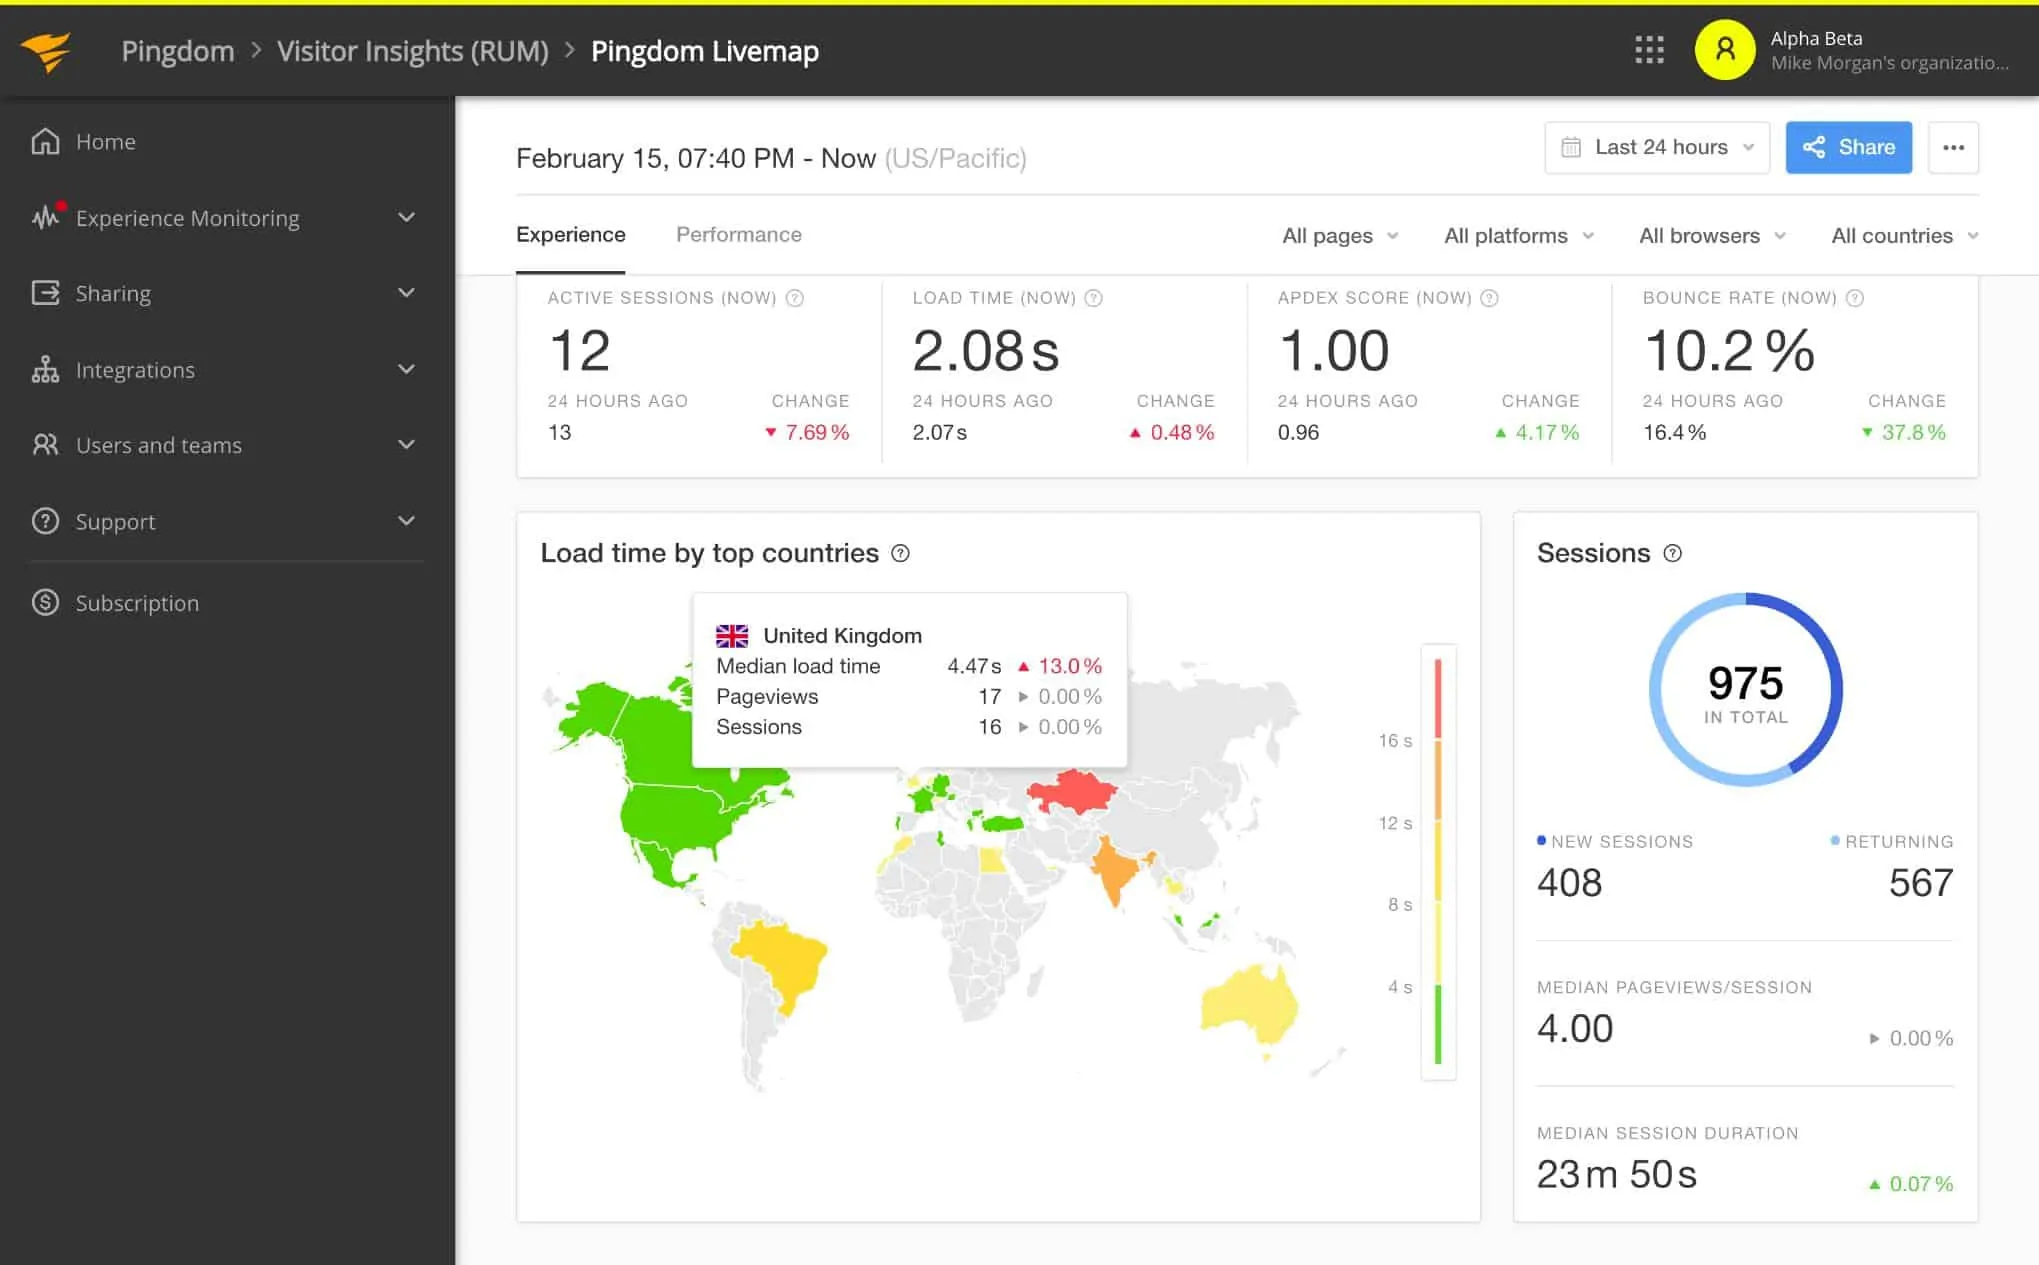
The Real User Monitoring service of Pingdom offers insights into the success of marketing campaigns as well as the performance of website services. The main screen of the Pingdom Real User Monitoring dashboard features a map of the world with color-coded traffic volumes shown by country. This map indicates the load times of the site when accessed from different countries. Other key metrics that are instantly available include the number of live connections to the site and the ongoing bounce rate measured over the past 24 hours.
The dashboard is divided into screens for user experience and system performance. The user experience data shows the access device and browser types most frequently used by visitors. The system also tracks satisfaction scores. Performance monitoring checks on load times of different elements on each page and watches which links are followed most by the site’s users.
Facilities in the service include performance thresholds. These will trigger alerts if the response times of a site dip below an acceptable level. These standards are segmented, so you will be able to get notified if, for example, access from mobile devices slows while overall averaged access times remain acceptable.
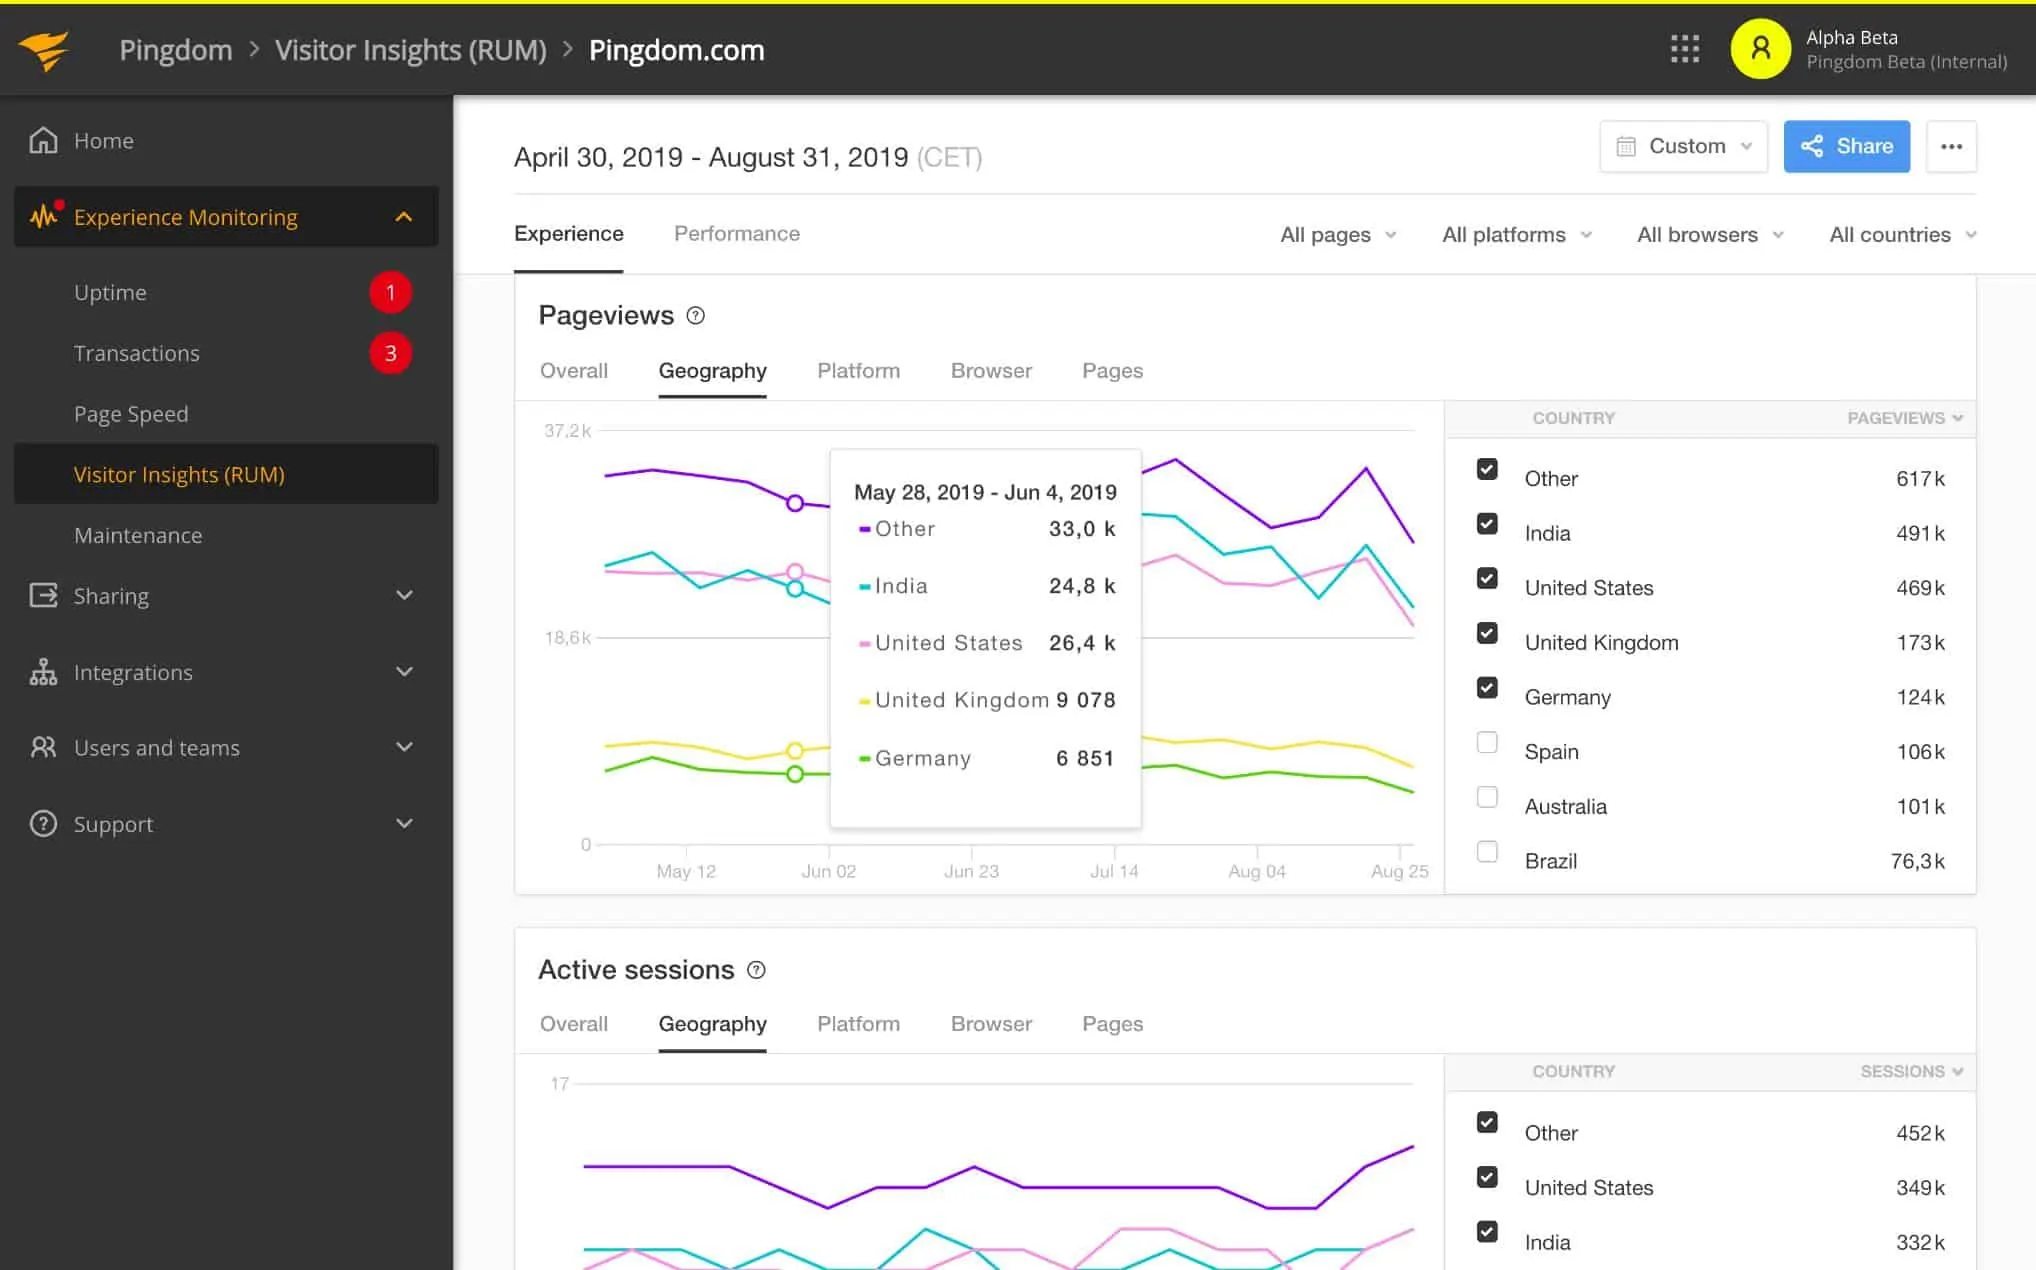
Performance data gets stored on the Pingdom server, so it available for analysis over time. This is useful for spotting performance issues caused by the addition of new pages or features. It is also a useful tool for marketers because they will be able to see which pages attract more visitors and where those visitors are located.
A report generating module in the Pingdom service enables ad-hoc analysis of performance. Once generated, these reports are delivered in the form of a web page. You can share a link to a report, enabling the recipient to filter and sort data. These reports are useful for tracking SLAs and communicating with customers if your business hosts the sites of other companies.
The Pingdom Real User Monitoring service is charged for by subscription with a rate based on the number of page views that get tracked. You can get a 14-day free trial of both the Real User Monitoring and Synthetic Monitoring services together.
Who is it recommended for?
Any business that runs a website would benefit from this package, including single-site startups. Transaction monitoring helps system monitoring teams spot component failure and activity tracking is useful for marketing and Web design teams. The rate for the service is accessible to small businesses and Pingdom charges separately for synthetic monitoring and RUM.
Pros:
- Can monitor externally from over 70 locations, making it a great option for monitoring applications and services that serve a global audience
- Lives in the cloud, meaning no onboarding or complicated setup
- The dashboard is accessible from anywhere an internet connection is available
- Alerts can be sent to email, SMS, and even integrate into custom solutions via API
- Uses root cause analysis to assist admins in fixing issues quickly
Cons:
- Could benefit from a longer trial time
EDITOR'S CHOICE
Pingdom Real User Monitoring is the best real user monitoring service we have found because it is very easy to use and presents all of the key information you need about your website. The Pingdom service is designed for those who want to see all performance data at a glance and also need to be able to get on with other tasks.
The system has a series of performance thresholds that will send you an alert if performance drops. That means you don’t have to watch the dashboard all the time. Historical data collection and analytical screens allow marketers and site developers to spot the effects of changes to a website.
Start 14-day Free Trial: pingdom.com/sign-up/
OS: Cloud-based
2. Datadog Real User Monitoring (FREE TRIAL)
Datadog monitors load times, error rates, and service dependencies very competently through its Real User Monitoring service and presents performance data in a crowded graphics-packed dashboard.
Key Features:
- Dashboard screens packed with graphs
- Dependency mapping
- Analysis tool
- Performance alerts
Why do we recommend it?
Datadog Real User Monitoring is a very granular service because it is offered in three plans. The division between services is: Mobile RUM, Browser RUM, and Browser RUM and Session Replay. Clearly, the last of these adds extra functions to the Browser RUM package, while the Mobile TUM plan provides a separate set of services.
The real user monitoring service includes performance expectation thresholds and alerts for when those levels drop. So, website administrators will only need to go to the dashboard when notified of potential problems.
Even though the busy data screens of the dashboard can be a lot to take in, their crowding of information removes the need to switch between screens in order to get a full view of a website’s performance. Deep dive screens are less crowded and they offer tools to enable troubleshooting of frequent errors to identify the root cause of delivery problems.
Analysis screens allow the user to view aggregated data by country, device, browser, OS, and session type. This interactive data explorer gives data representation and time horizon options. Actions and events can also be examined.
Who is it recommended for?
Datadog is an extensive platform and has many other monitoring and management services apart from its RUM packages. The system also offers a Synthetic Monitoring plan and you can add on system monitoring to watch over applications, platforms, and networks, to identify the cause of problems detected by RUM monitoring.
Pros:
- Offers numerous real user monitors via templates and widgets
- Can monitor both internally and externally giving network admins a holistic view of network performance and accessibility
- Changes made to the network are reflected in near real-time
- Allows businesses to scale their monitoring efforts reliably through flexible pricing options
Cons:
- Would like to see a longer trial period for testing
Datadog Real User Monitoring is charged on a subscription rate per 10,000 page views. You can access it on a 14-day free trial.
3. Site24x7 Website Monitoring (FREE TRIAL)
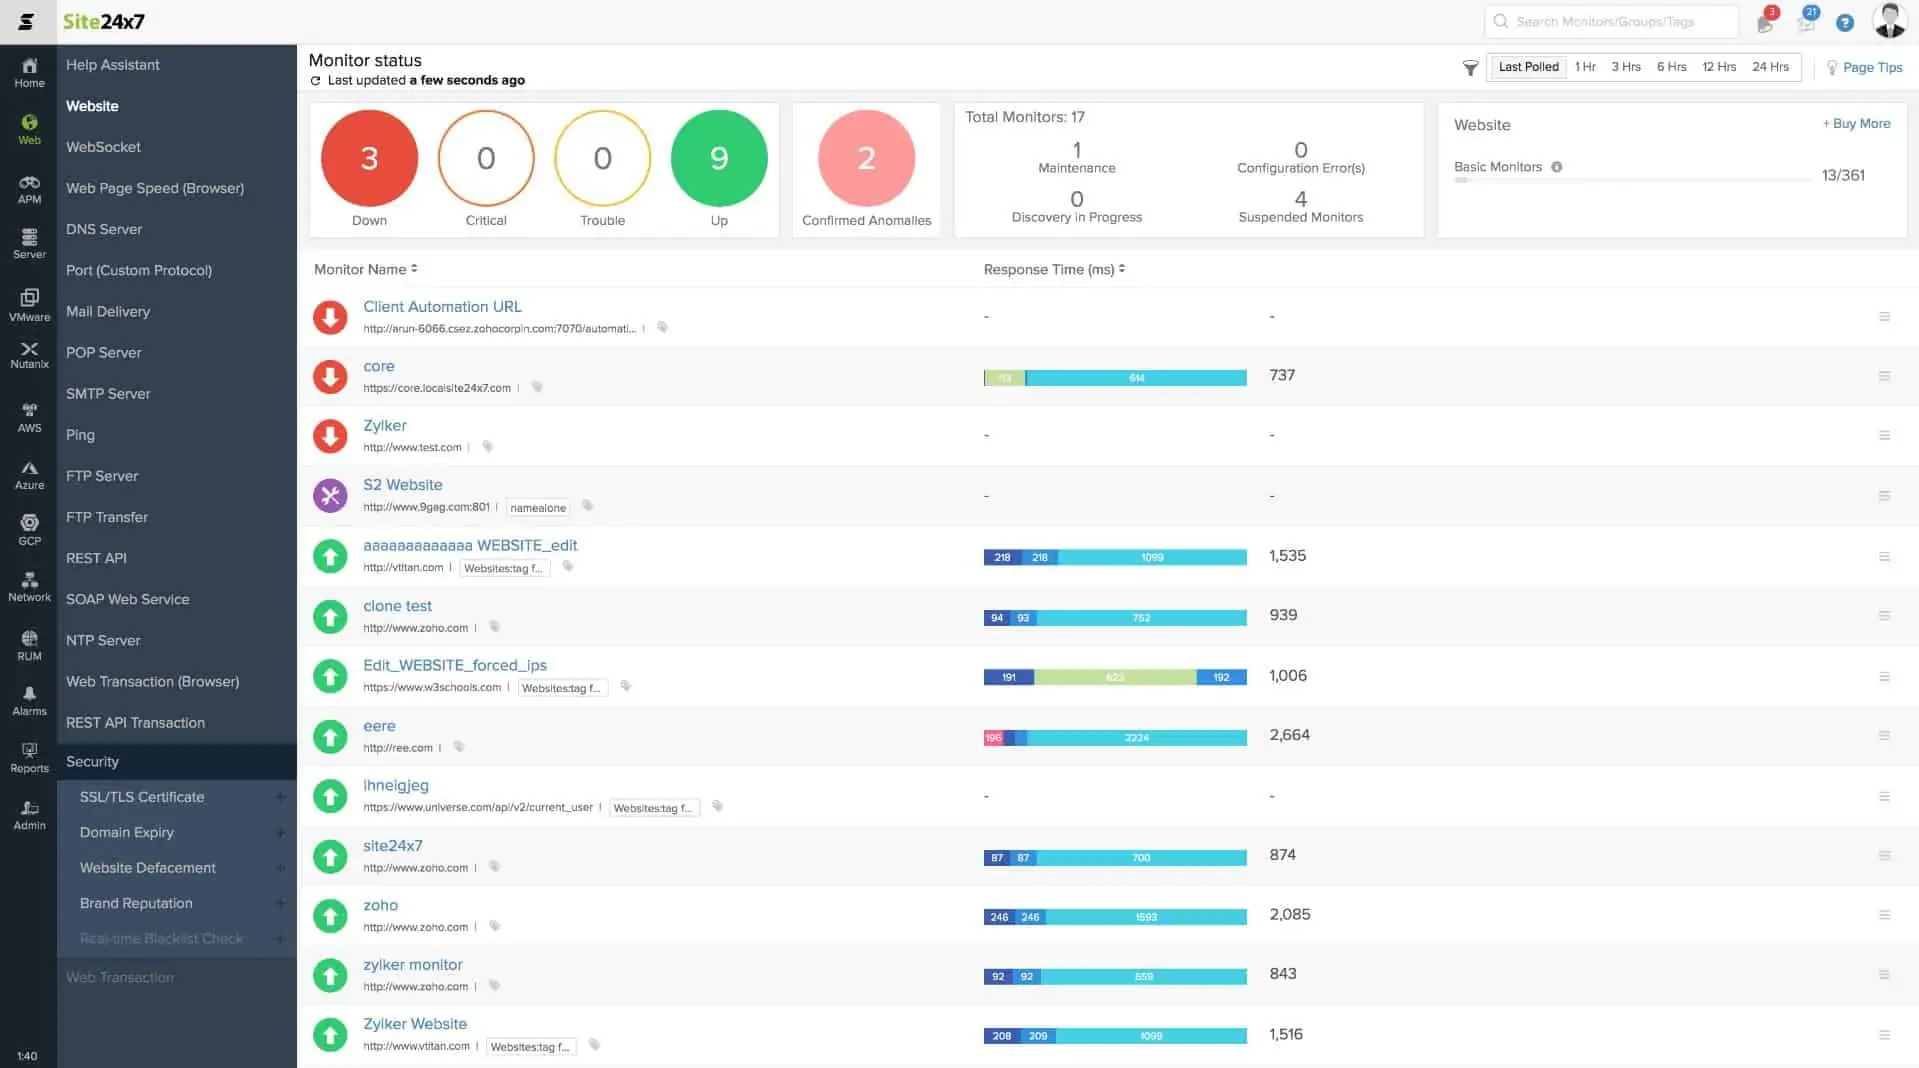
Site24x7 Website Monitoring is a cloud-based service that includes a range of website testing tools plus network, server, and application monitoring. The combination of services in this bundle enables analysts to chain back through the app stack down to the server and network if real user monitoring identifies systemic problems.
Key Features:
- Package includes infrastructure monitoring
- Creates a tree of pages and elements
- Reports activity per element
Why do we recommend it?
Site24x7 Website Monitoring is a similar service to the Datadog system, except that its plans don’t separate out each type of monitoring service as separate plans. With Site24x7, each plan blends many different services, such as application, server, and network monitoring plus RUM and synthetic monitoring for websites.
The Website Monitoring service generates a small piece of JavaScript that needs to be inserted into the header of a Web page in order to get monitoring activated. Once that change is live, performance metrics can be viewed in the console of Site24x7.
The RUM tracks events that get triggered by user actions on the monitored page and shows these live. It also gives a drill-down perspective on each element of the page, showing how it performed. These problems can be aggregated over several pages and even several sites. This enables you to see very clearly if a commonly accessed element, such as an API or a stylesheet has a problem.
You don’t need to sit and watch the console waiting for errors because Site24x7 includes a performance threshold monitor that raises an alert if problems arise. This service is driven by an AI assessment feature to filter out false-positive error reporting. Alerts can be forwarded to technicians via SMS, email, voice call, or instant messaging post.
Who is it recommended for?
The benefit of the Site24x7 package is that it gives you all of your system monitoring needs in one console and you only have one plan subscription to pay. This cuts out the problems of trying to get monitoring services from different providers to work together.
Pros:
- Offers a specific package for real user monitoring
- Offers a host of out-of-box monitoring options for infrastructure, servers, and applications
- Allows administrators to view dependencies within the application stack, good for building SLAs and optimizing uptime
- Offers root cause analysis enhanced by AI to fix technical issues faster
Cons:
- Site24x7 is a feature-rich platform with options that extended beyond databases management, may require time to learn all options and features
Site24x7 Website Monitoring is a subscription service and it also includes synthetic transaction monitoring, uptime tests, and response time monitoring. It is offered in four editions: Starter, Pro, Classic, and Enterprise. You can get a 30-day free trial of any of these plans.
4. ManageEngine Applications Manager (FREE TRIAL)
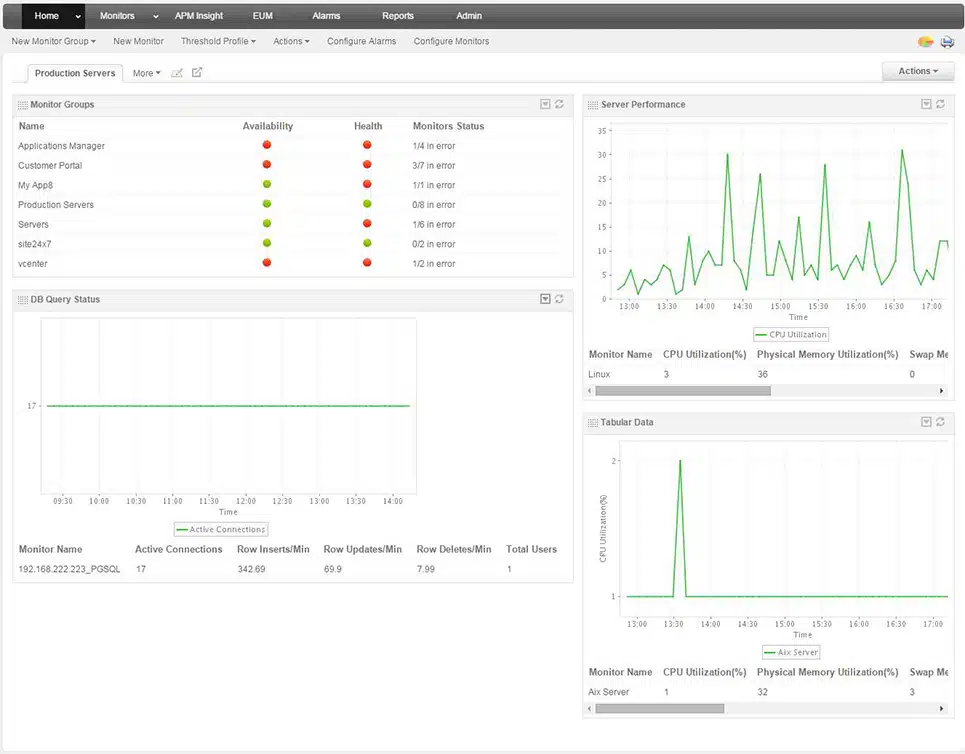
ManageEngine Applications Manager, as the name implies, is a monitor for all types of applications. The package includes a long list of performance tracking tools that include Web application monitoring. The Applications Manager has synthetic monitoring and real user monitoring facilities.
Key Features:
- Track response times per element
- Compare delivery models
- Test from multiple locations
Why do we recommend it?
ManageEngine Applications Manager is an on-premises monitoring package for servers, services, cloud platforms, and applications. The bundle also includes website monitoring services that provide both synthetic monitoring and RUM utilities. A nice feature of this tool is its Appindex score, which gives an overall satisfaction rating for each page.
The real user monitoring service records the differences in performance of a Web page or Web application to serve requests from different geographical locations. It can also identify the differences that content delivery networks or data center servers can make to load times.
The RUM records Javascript errors and database problems. With the reports from this tool, you can improve efficiency and deliver better user experiences.
Every statistic that the Applications Manager gathers can have performance expectations placed on them. These requirements are numeric thresholds – with a lower boundary, an upper boundary, or both. If one of those performance thresholds gets crossed by an arriving metric, the Applications Manager raises an alert.
You don’t have to sit and watch the dashboard for this monitoring system, waiting for an alert to arise because the Applications Manager can be set up to forward those warnings to you and your technicians through email, SMS, chat app, or service desk ticketing system.
Who is it recommended for?
The RUM is able to identify the precise line of code in a Web page feature that seems to be failing to run. However, this package is not really aimed at development teams in is more focused on performance monitoring and so is intended for use by system managers.
Pros:
- Performance alerts
- Load time statistics
- Ticket-based alert notifications
Cons:
- No SaaS version
The Applications Manager installs on Windows Server or Linux. There is no SaaS version, but you can run it on your own cloud account with AWS or Azure. There is a Free edition of the Applications Manager which includes website monitoring, alerts, and root cause analysis. The free version is limited to monitoring five assets. You can get a 30-day free trial of the full Professional edition of Applications Manager.
5. Sematext Experience
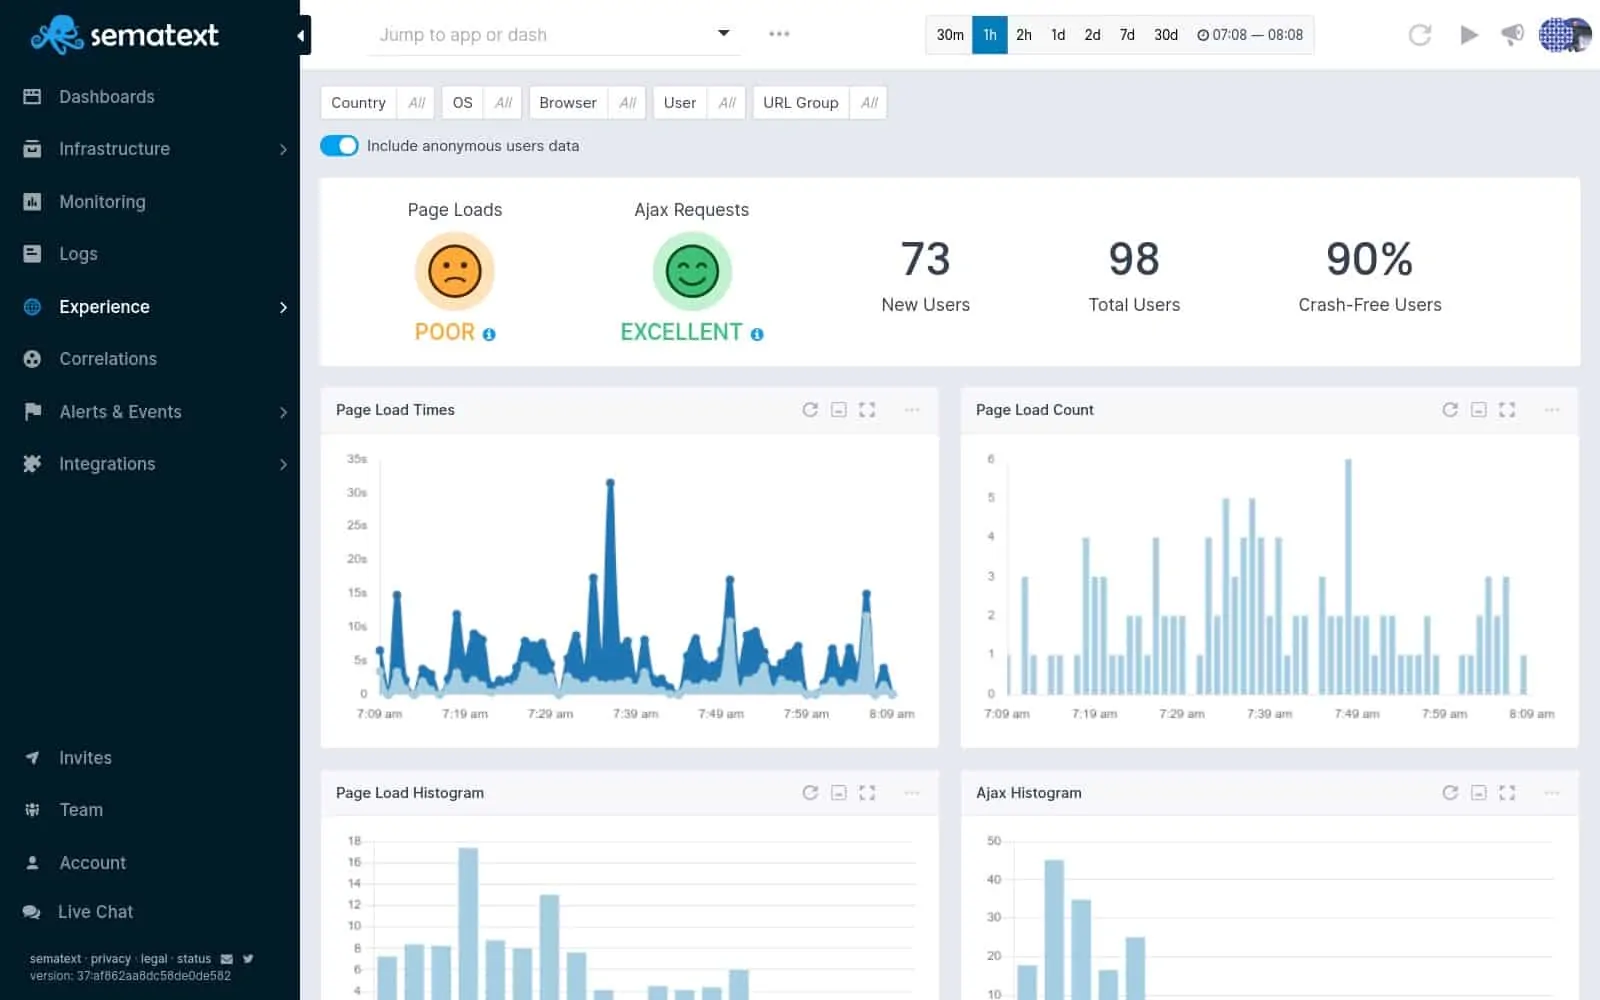
Sematext Experience implements a very quick status recognition feature at the top of its dashboard. This is in the form of two smiley (or sad) face icons that indicate the level of a site’s performance for page loads and Ajax (Asynchronous Javascript, JSON, and XML) requests.
Key Features:
- Performance ranking with smiley face icons
- Live performance tracking
- Historical analysis tool
Why do we recommend it?
Sematext Experience provides summaries of Website performance and then details of individual visitor journeys. That means you don’t get bogged down with too much information but details are available for investigation when things go wrong. This package is specifically focused on website monitoring and its plans are adjustable.
The dashboard is very well laid out with quick results on the number of users of a site and recent performance displayed as graphs. The view can quickly be changed to show data by user country, OS, browser type, page, or page group. The time segmentation can also be altered at the push of a button.
These data customization features mean that the same dashboard screen can be used for live data tracking and historical analysis. Users can also switch to view log and event data as lists of records or have those data sources analyzed in graphs.
Sematext offers a very good support service to busy website administrators through its alerting mechanism. This means that administrators don’t have to watch statuses because they will be notified if things go wrong. The performance thresholds that trigger alerts can all be adjusted.
Who is it recommended for?
There are three plans for Sematext Experience. While the lowest plan, called Startup is affordable for small businesses, many of the important features of the platform are only available in the top plans. For example, you don’t get transaction monitoring in that edition and anomaly detection is only included in the most expensive plan.
Pros:
- Can run detailed browser checks that detail any elements that fail to load correctly
- Robust alerting that supports both internal and external monitoring
- Flexible subscription pricing as well as a pay-as-you-go option
- Well built alert system with multiple triggers and intelligent alert fatigue features
Cons:
- Would like to see a longer standard 30-day trial for testing
Sematext Experience is a subscription service charged monthly at a rate set per 100,000 page views. You can try out the service on a 14-day free trial.
6. Uptime.com
Uptime.com offers packages of Web application testing services that include synthetic monitoring and real user monitoring tools. Each package is a collection of pre-paid credits for different types of services that can be used up throughout the month. This is a subscription system.
Key Features:
- Choice of launch device
- Identifies coding errors
- Bounce rate analysis
Why do we recommend it?
Like Pingdom, Uptime.com sounds like it is an availability tester. However, it provides a RUM service as well. This system prices its plan to include both RUM and synthetic monitoring. In reality, any business that runs a website is going to need both of these services.
While you can use synthetic monitoring to launch automated custom tests of your websites and Web services, real user monitoring gives you statistics on events that occurred during the day-to-day live operations of your Web assets. The tool is entirely Web-based and the console can be accessed through any standard Web browser. It will show you live reports in graphs and lists of the performance of your sites and applications.
Real user monitoring tools include capacity analysis over time, page and element load speed feedback, and error reports. You can also use the package to switch between real user monitoring and synthetic monitoring for root cause analysis. The synthetic monitoring service can also be automated to provide pre-release checks in a CI/CD pipeline.
Who is it recommended for?
The Uptime service is considerably more expensive than the Pingdom Real User Monitoring package. Pingdom provides more granularity with its RUM plan because you can choose the number of page views that you want to implement with the plan but the Uptime.com service gives you a fixed number according to the plan you choose.
Pros:
- Packages combine synthetic monitoring and real user monitoring services
- Cap your spending with pre-paid test allowances
- Will detect bot activity and exclude their actions from RUM results
Cons:
- Doesn’t list launch locations
The Uptime.com service integrates with system monitors, such as Datadog and Opsgenie, and team and task management tools, including Slack and Pagerduty. The system is offered in two plan levels, which offer different volumes of pre-paid tests per month. These are called Essential and Premium. You can get a 21-day free trial of the Premium package.
7. AppDynamics End User Monitoring
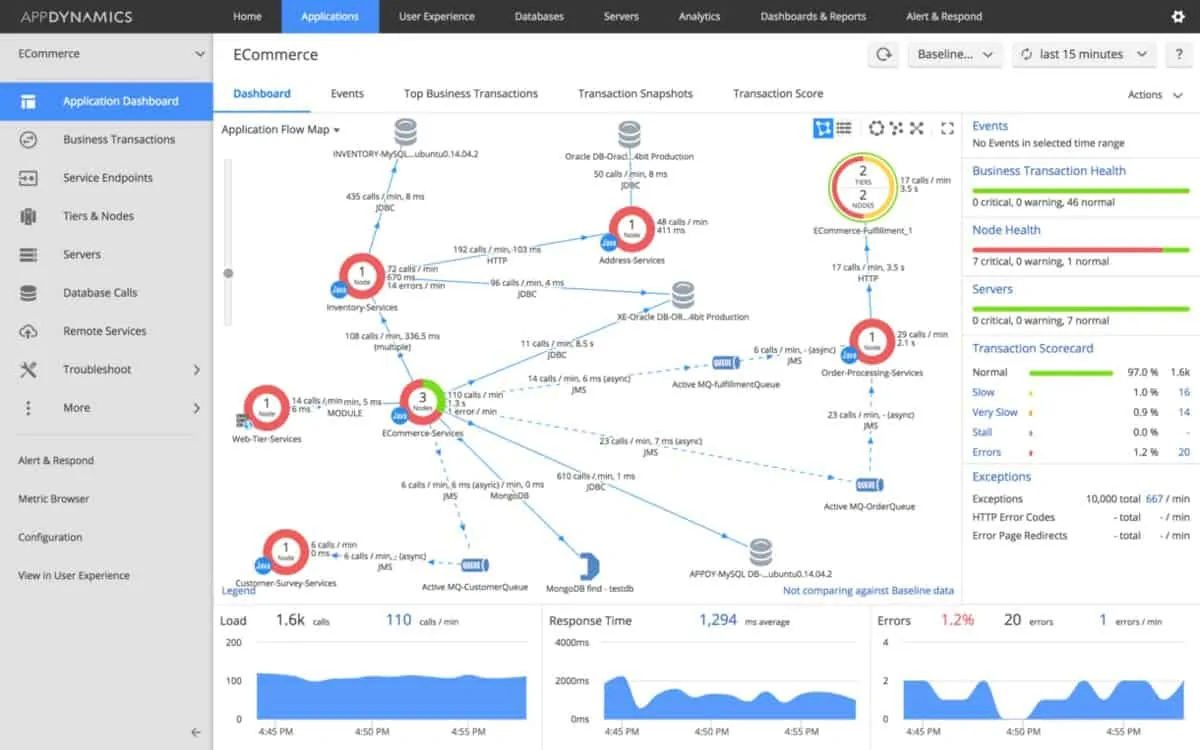
AppDynamics End User Monitoring registers system events during each user session and aggregates these into full system performance metrics. Standard user experience metrics, such as load times and error rates are all recorded. Along with those standards, code-level transactions get tracked, enabling website designers to see exactly which steps slow down the presentation of a website and the delivery of its services.
Key Features:
- Displays Web page element performance
- Identifies slow third-party APIs
- Aggregates usage statistics
Why do we recommend it?
AppDynamics End User Monitoring is offered on a platform of application monitoring services that will also provide infrastructure monitoring. Although End User Monitoring is a completely separate plan from the infrastructure and application monitoring packages, it is able to identify errors with underlying services that impact the performance of a website.
The AppDynamics system enables a web developer to see which third-party apps impair the performance of a site. It could well be that none of the performance issues in a website are caused by the site itself but is the result of a poorly performing API that is slow to deliver. In this case, the web designer has the option of removing that library or and looking for an alternative, or leaving out that function altogether.
Analysis of each event can be run end-to-end, following the journey of a user through the site, or on a drill-down basis, looking at each triggered event and then unearthing the services that support it, chaining all the way down to the hardware. By switching between these two views, a website designer can identify the root cause of load errors or slow response times.
Who is it recommended for?
The AppDynamics packages are metered with a rate per 1000 actions monitored. This is a very scaleable rate and it makes the tool accessibly priced for businesses of all sizes. The tool is able to provide better root cause analysis when combine with the infrastructure and application monitoring plans.
Pros:
- Tailored for large-scale enterprise use
- Excellent dependency mapping and visualizations to help troubleshoot complex application systems
- Includes a free version
Cons:
- Would like to see more templates for real user monitoring
AppDynamics End User Monitoring is offered in two plans: Real User Monitoring Pro and Real User Monitoring Peak. Both are subscription services with more customization and analysis features in the Peak plan. You can get a 15-day free trial of Real User Monitoring Pro.
8. Dynatrace Digital Experience Monitoring
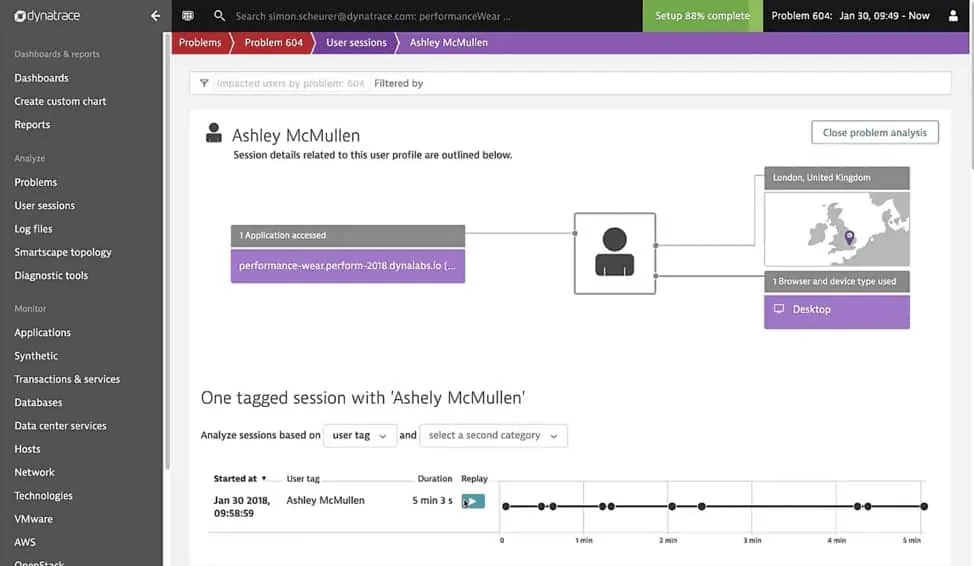
The Dynatrace Digital Experience Monitoring service offers a flexible package of synthetic modeling and real user monitoring services plus a session replay function. The user buys a block of credits and then decides which service to use them on.
Key Features:
- Records user journeys
- Aggregates activity statistics
- Displays performance metrics
Why do we recommend it?
Dynatrace Digital Experience Monitoring is split between two modules, which are its Synthetic Monitoring services and its Real User Monitoring tool. The RUM package covers mobile applications as well as websites. It can track APIs and elements in a site that are provided and hosted elsewhere as well as your self-hosted services.
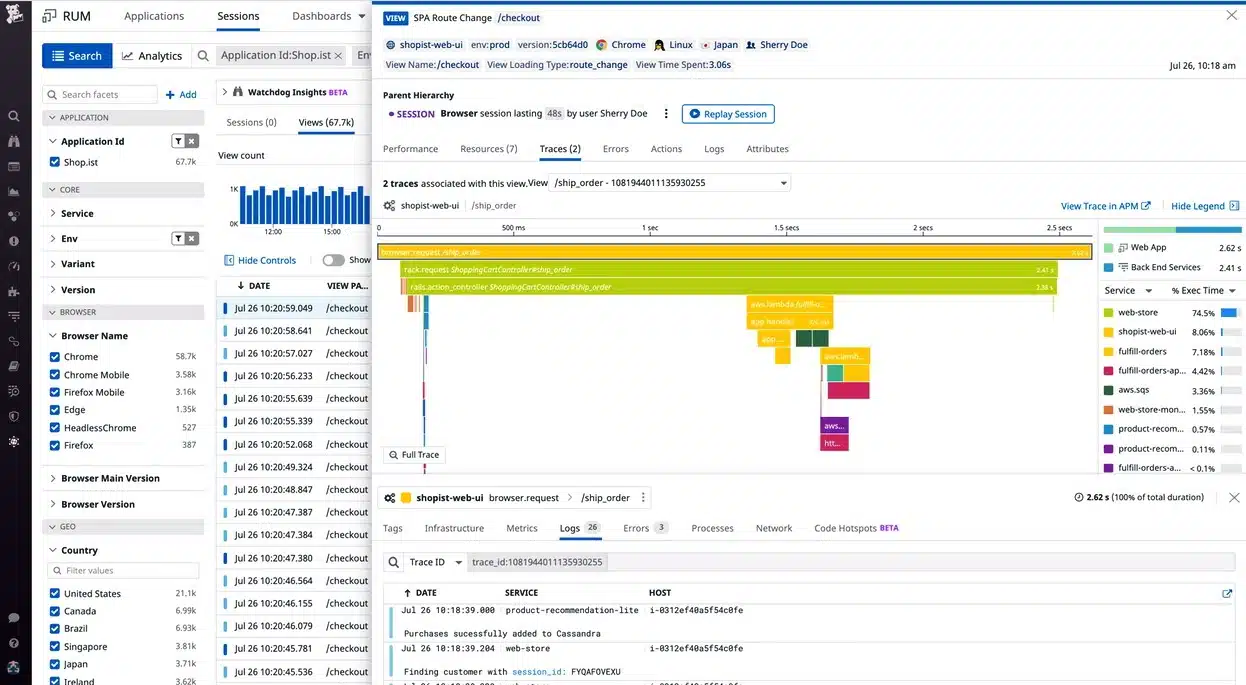
The Real User Monitoring functions of Dynatrace offers both a run-through trace of an individual user’s actions on a site and aggregated data that identifies the performance of each element of a site. The session recording feature of the Dynatrace service is unique. It lets a technician replay a session once it has completed, watching the screen as though it was a remote desktop view of a user’s live actions.
With both historical data and session run-throughs, a technician can spot exactly which actions resulted in errors. These features are also useful for marketing analysts who need to work out which services attract more user activity.
Who is it recommended for?
This package is a metered service with a rate per session, which brings your invoice at the end of the month right down to the number of user sessions that were actually recorded. This type of charging will make sense to users on cloud systems, such as AWS, that apply the same model.
Pros:
- Highly visual and customizable dashboards, excellent for enterprise NOCs
- Operates in the cloud, allowing it to be platform-independent
- Leverages AI to provide baseline analysis and detect user behavior anomalies
Cons:
- Designed specifically for large networks, smaller organizations may find the product overwhelming
Dynatrace Digital Experience is a subscription service and you can experience it for yourself on a 15-day free trial.
Real user monitoring FAQs
What is Real User Monitoring tool?
Real user monitoring (RUM) is a passive monitoring technique that records the activities of visitors to websites. This is also known as end-user experience monitoring (EUM) and real-user metrics. The purpose of this monitoring technique is not to record details about the users but to track the performance of the features in each page on a website. The purpose of the monitoring technique is to record the speed of delivery of active elements in a page and the technique can also be used for website design.
What are the benefits of Real User Monitoring?
The main purpose of real user monitoring is to spot failures in Web pages. Specifically, to measure the availability and delivery speed of individual elements in a site, such as the population of picklists, data entry validation routines, and media elements, such as animation and video. Elements can be expected to fail to load occasionally, due to a lack of memory on the receiving computer or an incompatibility with an out-of-date browser. If error rates are high, however, the cause is probably a bug in the code that delivers that feature and it will need to be corrected.
What is RUM and APM?
RUM stands for real user monitoring and APM stands for application performance monitoring. There is an overlap between these two disciplines because while an APM tracks the performance of any application, when it comes to examining Web pages, RUM is one of the techniques that APMs offer for performance analysis.
