The primary objective of information security is to protect the confidentiality, integrity, and availability of data or systems.
Availability measures, in particular, ensure that access to a system or service is uninterrupted.
Some of the most fundamental threats to availability are non-malicious in nature and include hardware failures, application errors, unscheduled downtime, resource utilization, and network bandwidth issues.
In today’s digital economy, an application isn’t just there to serve a business, in most cases, it is the business itself. A lot of businesses rely heavily on web and mobile applications for delivering value to customers and generating revenues. Ensuring the availability of those applications is a high priority for those businesses.
Here is our list of the best web performance monitoring solutions:
- SolarWinds Server & Application Monitor (FREE TRIAL) This on-premises package covers Web servers, email systems, and Web services as well as databases and other hosted applications. Runs on Windows Server. Get a 30-day free trial.
- Site24x7 Website Monitoring This cloud platform provides plans that include website and Web application performance monitoring.
- Paessler PRTG Network Monitor This flexible on-premises package includes utilities for availability tests plus Web server performance monitoring. Runs on Windows Server.
- ManageEngine OpManager Plus This package for network, server, and application monitoring includes availability checks and application performance statistics. Runs on Windows Server or Linux.
- New Relic Browser Monitoring This website monitoring service implements real user monitoring alongside other system monitoring tools on the same cloud platform.
- Dynatrace This cloud-based system includes full stack monitoring that includes website and Web application monitoring utilities. Can be downloaded onto Linux.
Making the contents of websites or web applications load as fast as possible is crucial for increasing customer retention and engagement. Any disruption to service availability for even a short time can lead to loss of revenue, customer dissatisfaction, and damage to your reputation. Users who rely on those services will get frustrated if it is not reliably available. This is why Web Performance Monitoring is so important. Monitoring the performance of a website or a web application is key to knowing if the service is performing as expected.
What is Web Performance Monitoring (WPM)?
Web Performance Monitoring (WPM) is a collection of tools and processes designed to monitor key application performance metrics of websites or web applications in order to ensure that they meet performance standards and provide a valuable user experience (UX) such that contents are displayed as quickly as possible, pages are loaded at consistent speeds and don’t suffer unexpected downtimes.
WPM is essential in ensuring that a web service is available to end-users, and in improving their digital experience. Other key benefits include:
- Website monitoring helps benchmark the performance of the website against others in the industry to help determine how well it is performing in relation to competitors.
- Website monitoring can be used to hold web hosting providers accountable to their service-level agreement.
- Website response time and availability–a key metric in WPM, is also used as a metric for search engine rankings.
WPM metrics cut across areas that are critical to the functioning of the web application such as network and database connectivity, bandwidth and computer resource utilization (RAM, CPU, and disk space), and many other areas.
The primary purpose of WPM is to determine how end-users are actually experiencing your web application, and how such data can be translated into actionable insights to achieve business goals. WPM data can also be used to measure the actual quality of services delivered to customers or end-users, and to determine how well the site is responding to improvement measures.
There are similar performance monitoring technologies that complement Web Performance Monitoring. One of such is Application Performance Management (APM). APM is a collection of tools and processes that enables an organization to ensure that its applications, websites, web-based services, and other critical infrastructure are running at optimal performance.
WPM should not be confused with APM. While WPM only focuses on tracking the performance of websites or web applications, APM refers to a much broader strategy of managing all aspects of an app’s performance levels of which web performance monitoring is part.
More specifically, an APM solution performs the following:
- Measures application availability and performance
- Provides tools to troubleshoot and diagnose problems before they impact operations or user experience (UX)
- Automates actions to resolve and recover from perceived performance issues
Another related performance monitoring technology that complements Web Performance Monitoring is something called Web Performance Optimization (WPO). WPO is primarily focused on increasing web performance. It employs several techniques that are implemented within an organization’s network to monitor and analyze the performance of web applications with the aim of identifying ways to improve them. WPO is analogous to Search Engine Optimization (SEO)—optimizing web performance generally improves search engine ranking, user experience, and drives more traffic to your website.
There are two main approaches to Web Performance Monitoring: Real User Monitoring and Synthetic Monitoring. We will now discuss them in detail.
Real User Monitoring (RUM)
Real User Monitoring is an approach to Web Performance Monitoring that employs passive monitoring (the RUM application collects website performance metrics without affecting the operation of the site) technology that continuously observes, captures, and analyzes all user interaction with websites or web applications; tracking availability, functionality, and responsiveness.
Using RUM techniques, organizations can easily capture data about how their applications are being used, as well as the actual performance of the application and users irrespective of device, browser, or network. RUM breaks down all the performance metrics (connectivity, load time, uptime, etc) for each user, aggregates the data, and allows you to view your site’s performance based on user location, browser type, operating system, and device. RUM can also be used to test or anticipate changes in a live website or web application using A/B testing or other techniques.
With the increasing popularity of cloud services along with web and mobile applications, it has become more and more important to monitor the usage of these applications even from within the client end. By leveraging RUM, organizations can achieve the following:
- Understand its users and identify key areas on its site that require the most attention.
- Understand the geographic or channel distribution trends, and other key usage trends of end-users. From a monitoring perspective, knowing your user trends allows you to identify areas to target for performance improvements and optimization.
- Obtain reports on load time, network duration, backend/frontend duration, download time, and much more.
RUM technology works by capturing a website or web app performance metrics directly from the end-user browser or client. A tiny JavaScript code embedded in each page collects this data from users as they explore the web pages, and sends it back for analysis. Data visualization techniques such as graphs and charts are then employed to make it easier to glean actionable insights from those data. Real User Monitoring answers the following key questions:
- How fast should my website or web app be?
- What is the speed currently experienced by users?
- How do I improve the speed?
Further reading: Real User Monitoring Guide
Synthetic Monitoring
Synthetic Monitoring is an approach to Web Performance Monitoring that employs active monitoring technology whereby scripts are deployed to simulate an action or path an end-user might take through a web application, and then report back the performance for further analysis. Those paths are then continuously monitored at specified intervals for performance such as functionality, availability, and response time measures. This type of monitoring does not require actual web traffic or user interaction; rather it uses synthetically generated traffic to collect data on page performance, hence the name synthetic monitoring.
Synthetic monitoring is valuable because it enables a webmaster or system administrator to identify and resolve problems on the site even before it affects actual end-users or customers. it enables companies to test new applications prior to deployment in a production environment. Because synthetic monitoring is a simulation of typical user behavior, it is often best used to monitor commonly trafficked paths and critical business processes. Synthetic monitoring will report a wide array of performance metrics depending on what is being monitored or measured.
Synthetic Monitoring uses a computer application that conducts performance checks on a routine basis. Every minute or so, a checkpoint sends a request to the website or web service, measures the response times, and generates reports and alerts based on the site’s performance during the test.
Synthetic monitoring works by deploying scripts that conduct automated periodic performance checks on a routine basis. Every now and then, the script sends a request to the website or web service, measures the response times, and generates reports and alerts based on the site’s performance.
Synthetic monitors operate like bots that connect to websites, web services, APIs, and servers to verify availability and performance using a network of checkpoints external to the website’s own servers from various geographical locations. These monitors generate alerts when they identify downtime or any form of degradation in performance. With these capabilities, system administrators can proactively identify availability problems or major execution issues that can affect users’ digital experience. Synthetic monitoring answers the following key questions:
- Is my website available?
- How fast is my site at this moment?
- How is my website performance at the moment?
- Is there downtime or error?
- If yes, where is it?
Further reading: Synthetic Monitoring Guide
Leading Web Performance Monitoring Solutions
Choosing the right WPM solution for your business and budget can be daunting. What fits perfectly from a price, feature, and functionality standpoint for one organization may not fit for another. But with the right WPM solution, your organizations can ensure that their web applications meet expected performance standards. While we’re still working on a more detailed review of the best WPM tools in the market, we’ll take a brief look at some of those tools. Hopefully, this will guide you in the process of choosing the right one for your business.
1. SolarWinds Server & Application Monitor (FREE TRIAL)
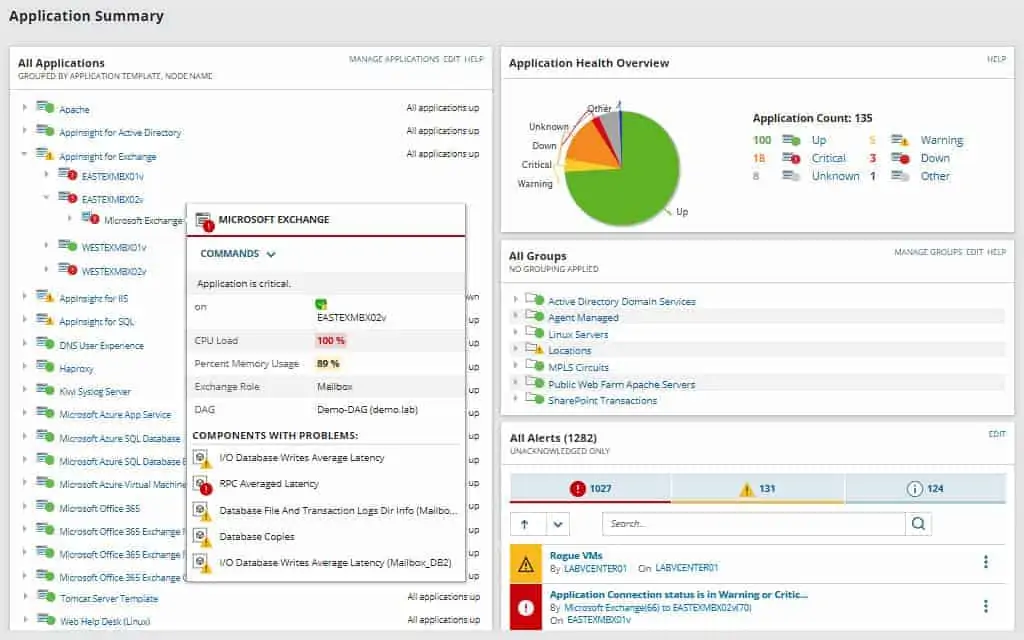
SolarWinds Server & Application Monitor or SolarWinds SAM provides organizations with tools (templates, application monitors, and alerts) to intelligently monitor the status of web applications, application servers, and more through a single web console. This enables system admins to gain deep visibility into application and server performance issues.
Why do we recommend it?
SolarWinds Server & Application Monitor is able to track activities on your own servers and also on the major cloud platforms. The tool will identify all of your applications and map how they interact with each other and with supporting platforms. This multi-layer view lets you quickly spot the root cause of performance problems.
With SolarWinds SAM, you can easily monitor critical services and basic functions in your environment such as the status of servers, CPU, disk space, uptime, and other basic services. SAM can monitor these services for availability and possibly start them up where necessary. Key features and capabilities include:
- Custom monitoring with REST API, WMI, SNMP, and PowerShell scripts
- Ability to Monitor Azure and AWS IaaS, PaaS, and SaaS
- Lots of out-of-the-box monitoring templates
- Infrastructure dependency mapping
- Customizable server monitoring
There are two types of licensing available for SAM:
- Node-based SAM licensing — which governs how many managed nodes can be monitored within your SAM environment while allowing for an unlimited number of component monitors per node.
- Component-based licensing — which determines how many assigned component monitors you are allowed. Each component monitor consumes one license.
Who is it recommended for?
The capabilities of this package are extensive and so would be too much for small businesses that would probably get away with smaller and scraper Web performance monitoring systems. So, this system will appeal more to large organizations that have many applications to watch over.
Pros:
- Designed with large and enterprise networks in mind
- Can monitor web assets via REST API, SNMP, and WMI
- Provides root cause analysis and dependency mapping
- Supports both SNMP monitoring as well as packet analysis, giving you more control over monitoring than similar tools
- Uses drag and drop widgets to customize the look and feel of the dashboard
- Robust reporting system with pre-configured compliance templates
Cons:
- Better suited for larger companies with multiple web assets
The SolarWinds SAM is best suited for large companies, although smaller organizations can also deploy it. A 30-day fully functional free trial is available here. This gives you a great opportunity to try out the package risk-free.
2. Site24x7 Website Monitoring (FREE TRIAL)
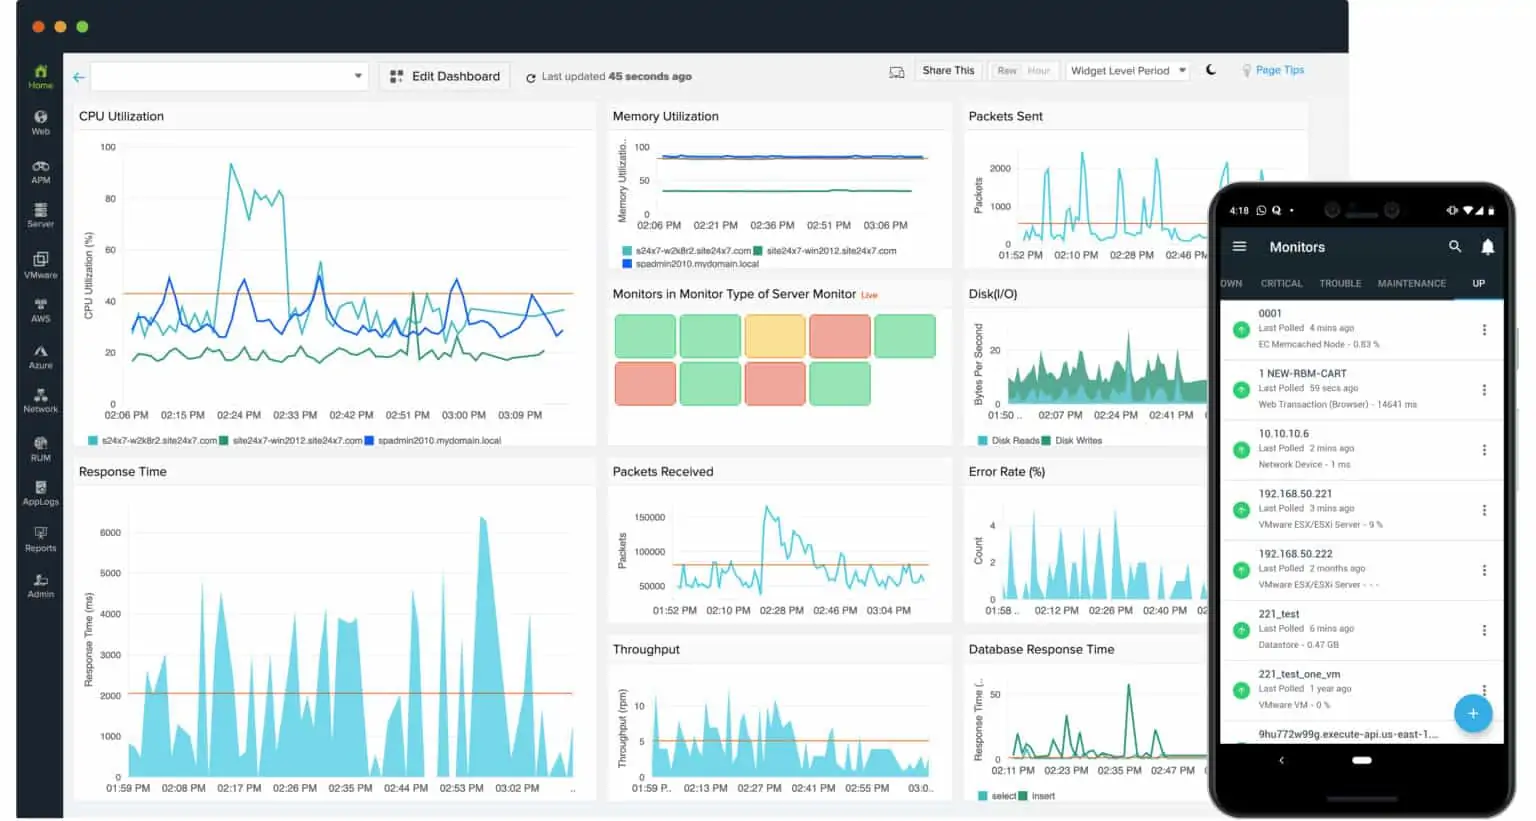
Site24x7 is a cloud-based infrastructure monitor that is available in tailored packages for website monitoring, infrastructure monitoring, and application performance monitoring. Metrics that can be monitored include CPU and memory utilization, disk space usage, database/webserver/email servers performance. It is also able to analyze the performance of all applications running on a server.
Why do we recommend it?
Site24x7 Website Monitoring is one of the utilities that you can get with the monitoring packages offered by Site24x7. This system has servers in 120 locations, so you can run performance tests on your website from different places in the world. You can also implement real user monitoring and Web server monitoring with this package.
Who is it recommended for?
Site24x7 prices its packages so that they are accessible to small businesses. Larger companies are also catered for by capacity expansion packs. Plans include all of the monitoring services on the platform and they also have a log management utility. So, buyers get all of the monitoring software they need with one subscription.
Pros:
- One of the most holistic monitoring tools available, supporting networks, infrastructure, and web performance in a single platform
- Uses real-time data to discover devices and build charts, network maps, and inventory reports
- Is one of the most user-friendly network monitoring tools available
- User monitoring can help bridge the gap between technical issues, user behavior, and business metrics
- Supports a freeware version for testing
Cons:
- Is a very detailed platform that will require time to fully learn all of its features and options
Site24x7 supports operating systems such as Windows, Windows Server, Linux, FreeBSD, and Mac OS both in physical and virtual environments. Site24x7 also supports the monitoring of Cloud server platforms such as Microsoft Azure and Amazon Web Services (AWS). In terms of licensing cost, Site24x7 is charged on a subscription basis, monthly or yearly. The Pro package includes both server and application monitoring and you can get a 30-day free trial.
3. Paessler PRTG Network Monitor (FREE TRIAL)
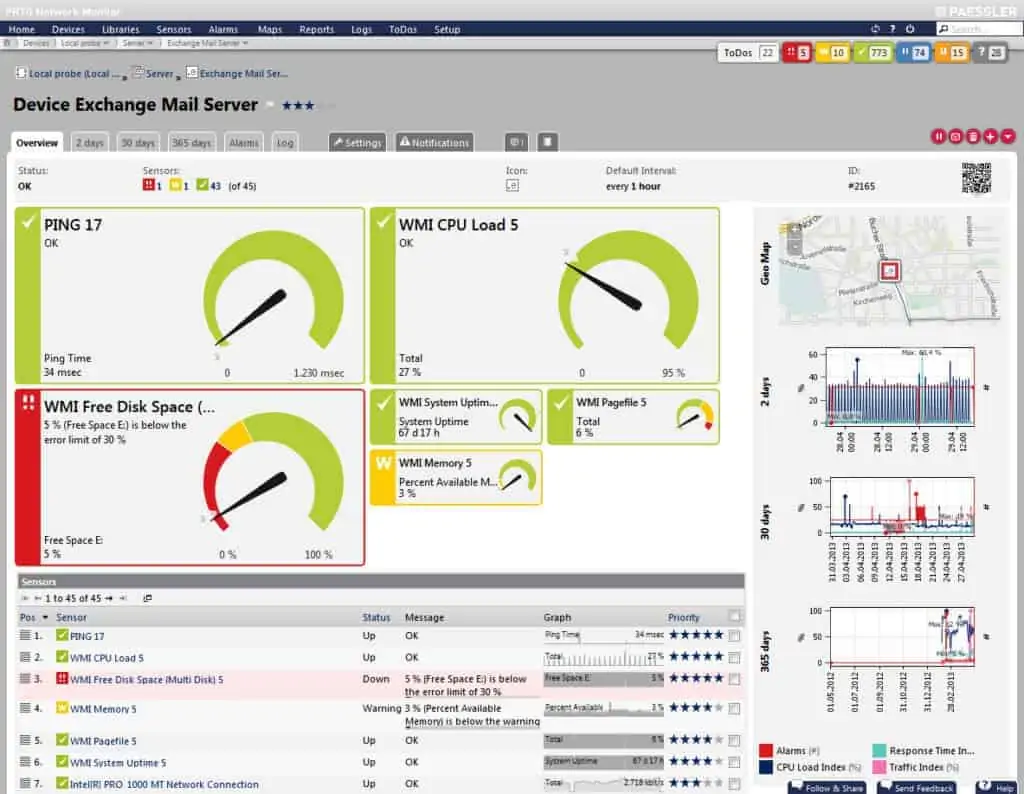 PRTG Network Monitor is an agentless network monitoring software from Paessler AG. It can monitor and classify system conditions such as bandwidth usage or uptime. In addition, Paessler AG also offers a cloud-based monitoring solution known as PRTG hosted.
Why do we recommend it?
The Paessler PRTG Network Monitor package is able to monitor much more than just networks and it includes systems to watch the performance of websites. It can track the activity of Web servers and the physical servers and cloud platforms that host them and it also offers synthetic monitoring tools to assess website availability.
PRTG Network Monitor has an auto-discovery mode that scans predefined areas of an enterprise network and creates an inventory of devices from the data. The software is based on sensors that are configured for a specific purpose. A sensor is defined as a single metric on a device such as response times, CPU, or memory utilization, among others.
Who is it recommended for?
PRTG is available as a SaaS platform and also as a software package for hosting on Windows Server. The bury pays for an allowance of sensors and then decides which of the monitors within the bundle to activate. Small enterprises that only need 100 sensors get the package for free forever.
Pros:
- Uses a combination of packet sniffing, WMI, and SNMP to report web asset performance
- A great option for organizations looking to expand their monitoring capabilities beyond web services
- Drag and drop editor makes it easy to build custom views and reports
- Supports a wide range of alert mediums such as SMS, email, and third-party integration
- Supports a freeware version
Cons:
- Is a very comprehensive platform with many features and moving parts that require time to learn
PRTG Network Monitor licensing is based on sensors. Most devices require between five and ten sensors to be fully monitored. Paessler provides a freeware version of up to 100 free sensors. However, the application is only available for Windows systems. You can download and evaluate PRTG Network Monitor on a free 30-day trial.
4. ManageEngine OpManager Plus
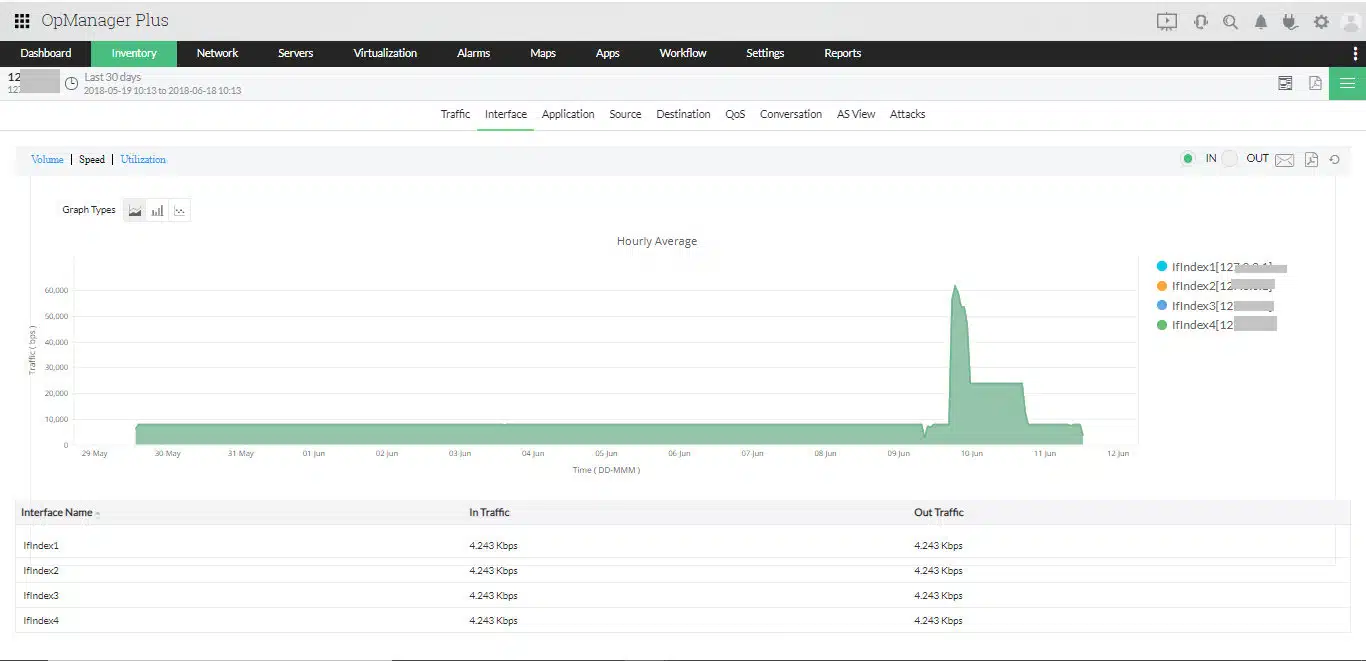
ManageEngine OpManager Plus is a bundle of ManageEngine packages, including OpManager for network device and server monitoring, NetFlow Analyzer for bandwidth monitoring, and Applications Manager for application monitoring. This combination gives you tracking for Web servers and Web delivery systems and also provides response time and availability tests.
Why do we recommend it?
ManageEngine OpManager Plus is a very large package that monitors both physical and virtual systems. It covers networks, servers, and applications and it will track activity on cloud platforms as well. The package provides much more than just website monitoring and it includes automated discovery and inventory creation for both hardware and software.
OpManager Plus also features SQL database statistics, giving DBAs detailed information on performance and query times across large networks. Other features and capabilities include:
- Application discovery and dependency mapping
- Synthetic transaction monitoring
- URL/website content monitoring
- Business service management
- Mobile Application monitoring
- Fault management and alerts
- Application analytics
- REST API monitoring
Who is it recommended for?
This bundle is suitable for a business that wants to get all of its monitoring tools from one provider. If you like ManageEngine tools, it is a good idea to get them all in one purchase. The package also includes firewall monitoring and network address management. You can also implement network device configuration management with this package.
Pros:
- Designed to work right away, features over 200 customizable widgets to build unique dashboards and reports
- Supports web performance monitoring as well as health insights
- Uses intelligent alerting to reduce false positives and eliminate alert fatigue across larger networks
- Supports email, SMS, and webhook for numerous alerting channels
- Can set up SLAs based on network, application, or process
Cons:
- Is a feature-rich tool that will require a time investment to properly learn
OpManager Plus installs on Windows Server or Linud and ManageEngine offers the package on a 30-day free trial.
5. New Relic Browser Monitoring
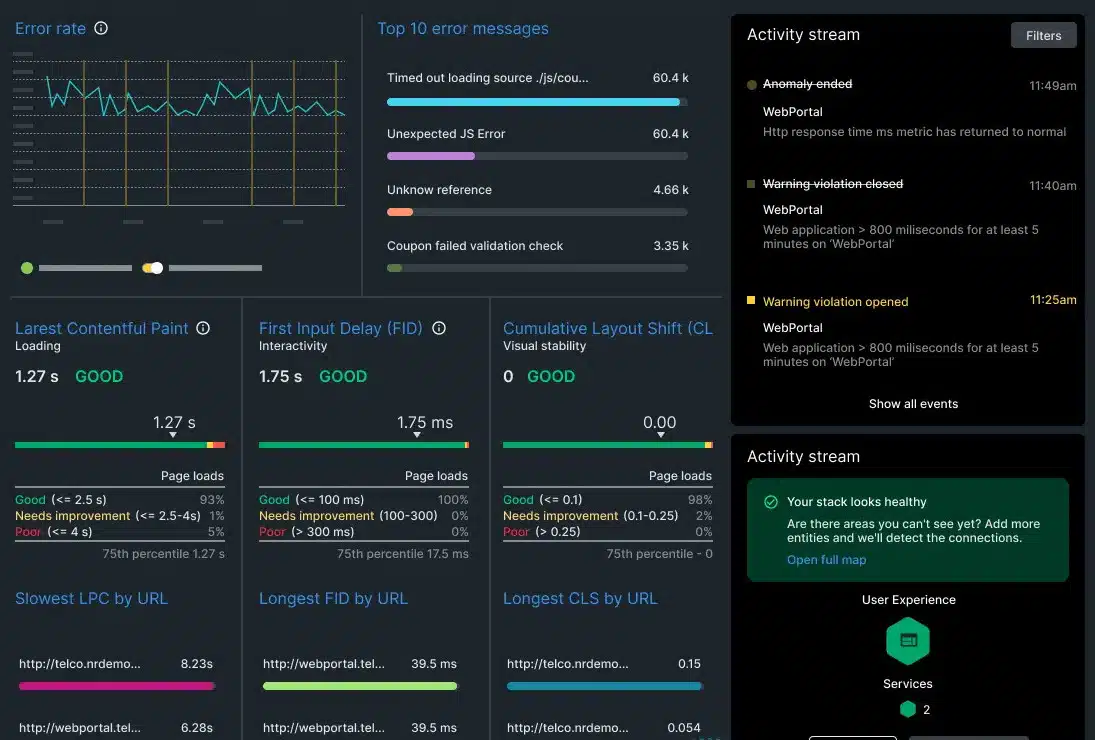
New Relic is a cloud-based software that helps website, web, and mobile application owners track the performances of their services in real-time. New Relic Browser Monitoring works as a standalone monitoring tool that can deliver reports on page load times, common browser usage, and JavaScript errors. It is best suited for medium to large organizations or anyone with a business-critical web presence.
Why do we recommend it?
New Relic Website Monitoring is part of a wider platform that includes 16 different monitoring units. The platform is expanding and new units appear occasionally. The Website Monitoring tool gives you real user monitoring and other units provide connection testing and server monitoring. You can also watch over supporting applications, such as Web servers and databases.
New Relic, in particular, provides a Real User Monitoring (RUM) solution that measures the speed and performance of your site or application as users explore and navigate the site from a variety of web browsers, devices, operating systems, and networks. New Relic Browser Monitoring prides itself as the world’s most deployed RUM solution.
New Relic offers an abundance of data that can be used to manage uptime and improve website performance. Key features and capabilities include:
- Data: All of your system’s telemetry data—metrics, events, logs, and traces — connected in one platform to eliminate silos and scale efficiently.
- Analytics: Query any data collected, get quick answers to questions as they arise, using familiar query patterns for the different data types.
- Dashboards: Visualize data in ways that help software development and IT teams ensure uptime and performance, gain operational efficiency and accelerate time to market.
- Alerts: Find out about problems with real-time notifications based on metrics and thresholds you care about.
- Programmability: Build custom New Relic One apps to connect your system performance to unique business needs, such as business KPIs and customer engagement.
Who is it recommended for?
The New Relic platform has a free tier, which makes it accessible for small enterprises. Without that free option that has low capacity, this package would only be of interest to large companies and the upper end of the mid-sized business category.
Pros:
- Focused on providing real user monitoring for websites and mobile apps
- Can identify and alert to SSL, JavaScript, load times, and browser issues
- Ideal for high-traffic websites and services – great for getting better uptime
- Offers a wide range of API integrations to share important data
- Offers a completely free tier
Cons:
- Better suited for larger eCommerce and public websites
6. Dynatrace
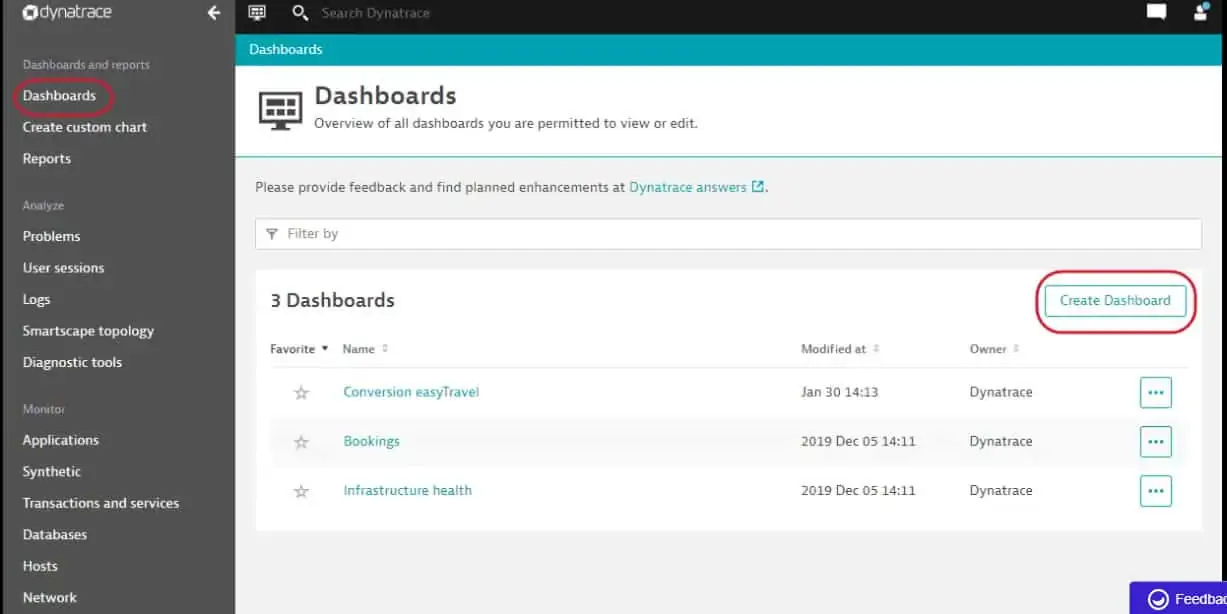
Dynatrace software is a tool for monitoring and optimizing application performance, IT infrastructure, and user experience. The Dynatrace platform uses artificial intelligence to deliver Application Performance Monitoring (APM), Artificial Intelligence for operations (AIOps), IT infrastructure monitoring, Digital Experience Management (DEM), and digital business analytics capabilities. The Dynatrace platform consists of the following:
- SmartScape for continuously updated topology mapping and visualization
- Davis — a proprietary AI engine, for automatic root-cause fault-tree analysis
- PurePath for code-level distributed tracing
- OneAgent for automated data collection
Dynatrace provides SaaS and managed service deployment models. Key features and capabilities include:
- Automatic monitoring of cloud-native workloads and microservices
- Automatic SQL/NoSQL Database Monitoring
- Digital Experience Monitoring (DEM)
- Intelligent observability
- AI assistance with Davis
Why do we recommend it?
Dynatrace offers six plans, which include a Synthetic Monitoring package and a Real User Monitoring system – both for website monitoring. The Infrastructure edition and the Full Stack Monitoring systems also include measures to watch over technologies that relate to website performance, such as Web servers.
Dynatrace can be used to perform both Real User Monitoring (RUM) and Synthetic Monitoring. Dynatrace RUM gives organizations the power to know their customers by providing performance analysis in real-time. This includes all user actions taken and how the various actions impact performance. Similarly, Dynatrace Synthetic Monitoring makes it easy for organizations to monitor the availability and performance of applications as experienced by customers around the world and 24/7.
Who is it recommended for?
Dynatrace has an interesting charge rate that diverges from that of most of its rivals. Its rate is levied according to data throughput. This is very good news for small businesses because it means they get all of the utilities that large companies enjoy without having to pay high charges. Big companies will also be attracted to this budgeting model.
Pros:
- Can secure and monitor more complex web assets – ideal for enterprise environments
- Sleek, customizable interface – great for NOCs
- Real-time LAN and WAN monitoring that supports virtual environments, great for MSPs and large enterprise networks
- Leverages AI to detect trends and monitor baseline performance
Cons:
- Dynatrace is better suited for larger networks and enterprise organizations
- Would like to see a longer trial
