What is a LAN monitor?
A LAN monitor (or Local Area Network monitor) provides you with visibility of your local computer network including computers, routers, servers, printers and more.
LAN monitoring software will monitor network performance and alert you to issues such as a printer going offline or a router that’s not functioning.
Here is our list of the best LAN monitoring software tools:
- SolarWinds Network Performance Monitor EDITOR’S CHOICE The key feature of this tool that makes it number one on our list is the well-organized dashboard. This gives a clear overview of the whole network’s performance and the ability to monitor remote sites. Full SNMP compatibility and advanced filters and notifications for real-time status alerts make this an all-round top performer.
- AKIPS (FREE TRIAL) This network monitoring system implements an autodiscovery routine and then monitors device statuses with SNMP and traffic activity with NetFlow. Runs on a VM over any operating system.
- ManageEngine OpManager (FREE TRIAL) A comprehensive network management system that installs on Windows and Linux. The tool uses SNMP to check on network devices.
- Paessler LAN Monitoring with PRTG (FREE TRIAL) This tool monitors servers and applications as well as LANs. It runs on Windows and includes sensors for traffic monitoring as well as network device health checks.
- SolarWinds Flow Tool Bundle (FREE TOOL BUNDLE) A trio of utilities that assists you to test the capacity of your network.
- Site24x7 (FREE TRIAL) A cloud-based service that monitors networks, applications, and user behavior.
- SolarWinds Hybrid Cloud Observability (FREE TRIAL) This service performs monitoring for local networks and connections out to cloud services. Runs on Windows Server.
- Atera (FREE TRIAL) A remote infrastructure monitoring system designed for use by managed service providers.
- Nagios Core and Nagios XI Paid (Nagios XI) and free (Nagios Core) versions of a network monitor that is suitable for small and middle-sized companies.
- Pandora NMS An SNMP-driven network monitor that includes IP address management and configuration management modules.
- Zenoss – Available in paid and free (Zenoss Core) versions, you can opt to run this network monitoring software on-site or access it from the Cloud by subscription.
- Dynatrace A network connection monitor that also covers server and device statuses.
- ConnectWise Automate A network monitor that includes automated actions that get triggered by status alerts.
- Zabbix A free open source network monitor that uses SNMP to track network device statuses.
LAN monitoring tools assessment
LAN Monitors range in complexity from packet sniffing tools through to full network administration systems. The key tasks when managing a network are the ability to keep track of facility utilization, ensuring equipment doesn’t get overloaded and the ability to monitor and ensure all equipment is operational. LAN monitor software keep you informed in real-time so that you can head off problems before they impact performance.
As your network probably contains equipment sourced from a range of manufacturers, you don’t want to be tied into a proprietary system for your LAN monitoring software. It is important to check that the monitoring system that you buy is compatible with all of the networking equipment you already have. Although wireless networks are not officially part of the definition of “LAN,” getting a monitor that can also include your WiFi router is also a good option to look out for.
Our methodology for selecting LAN monitoring software
We reviewed the market for LAN monitoring software and analyzed the options based on the following criteria:
- An SNMP manager to query device statuses
- Constant availability monitoring
- The ability to communicate with the devices provided by many different vendors
- Alerts for device status problems
- A network topology map
- A free tool or a free assessment period
- A useful set of monitoring utilities for free or at a good price
The best LAN Monitoring Tools
This guide will list LAN monitoring tools that cover the whole spectrum of requirements, not just systems for large corporations.
Our methodology for selecting LAN Monitoring tools:
- Visualization — you need the monitor to show you the status of the overall network at a glance
- Alerts — the monitor should incorporate a feedback system to highlight failures and stress
- Customizations — the system should allow you to write your own scripts to automate reporting
- Multi-vendor compatibility — the monitoring system should be able to communicate with all your existing equipment.
- Analysis tools — you sometimes need to be able to explore the network, right down to the packets
With these criteria in mind, we have assembled a list of the best LAN monitoring software.
1. SolarWinds Network Performance Monitor (FREE TRIAL)
SolarWinds is one of the big hitters in the LAN technology market at the moment. The company produces a range of products for network administrators that can be bought individually, or assembled together to form a complete network management system.
Key Features:
- Autodiscovery: Documents all network devices with an inventory and a map
- Constant Status Polling: Uses the Simple Network Management Protocol
- Connectivity Testing: Troubleshoot with Ping and Traceroute
- WAN and Cloud Testing: Monitors important internet plans
- Check Network Equipment: Monitor load balancers and firewalls
Why do we recommend it?
SolarWinds Network Performance Monitor is a highly regarded LAN monitoring system. It is based on the Simple Network Management Protocol (SNMP), which enables the monitor to discover all devices connected to the network. The tool will also create a network inventory and a network topology map, both of which are constantly kept up to date. The service provides continuous network device polling to spot errors and shutdowns. This mechanism is linked to an alerting system that will notify technicians when problems arise.
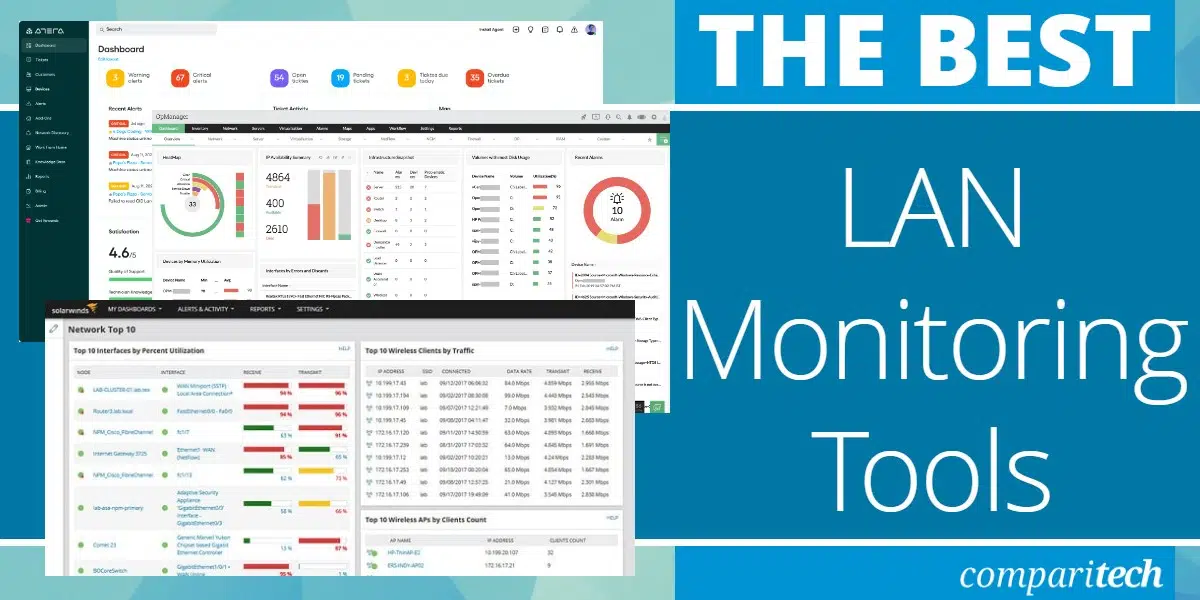
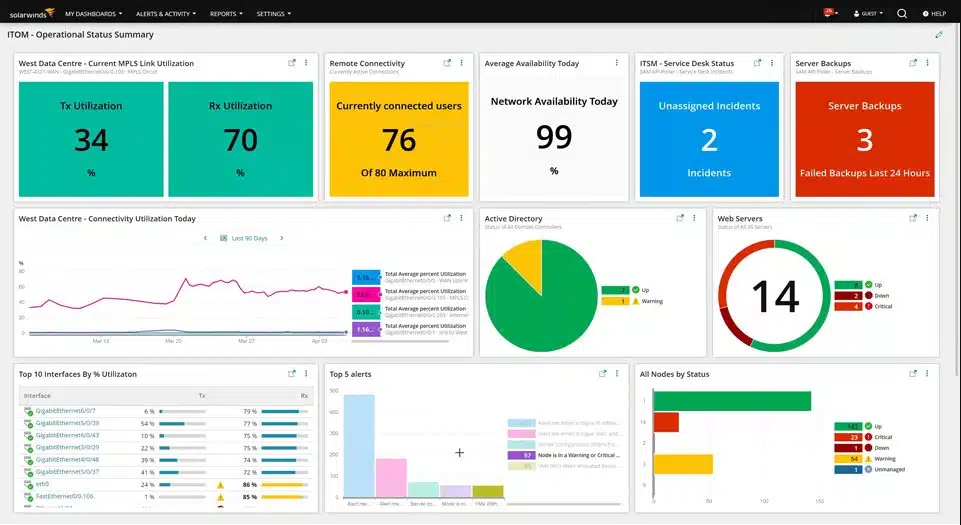
You don’t have to commit to buying all of the other modules in order to use the Network Performance Monitor. But you may be tempted to take a look at the other SolarWinds utilities once you have gotten used to the LAN monitoring tool. The key feature of this tool that makes it a winner on our list is the well-organized dashboard. You get an overview of the whole network’s performance with just one glance at the user interface. Real-time performance metrics on network activity are made instantly visible by graphic presentations, including pie charts and line graphs.
If you are responsible for several sites, you can extend the competence of Network Performance Monitor thanks to its remote monitoring capabilities. This way, you can manage all of the devices in your WAN from one central location.
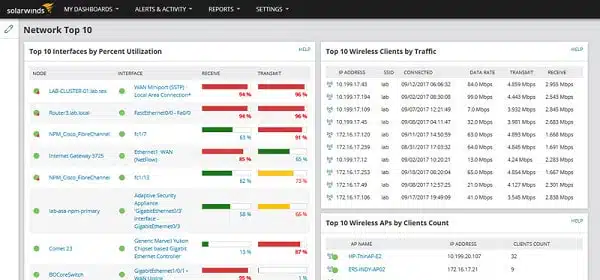
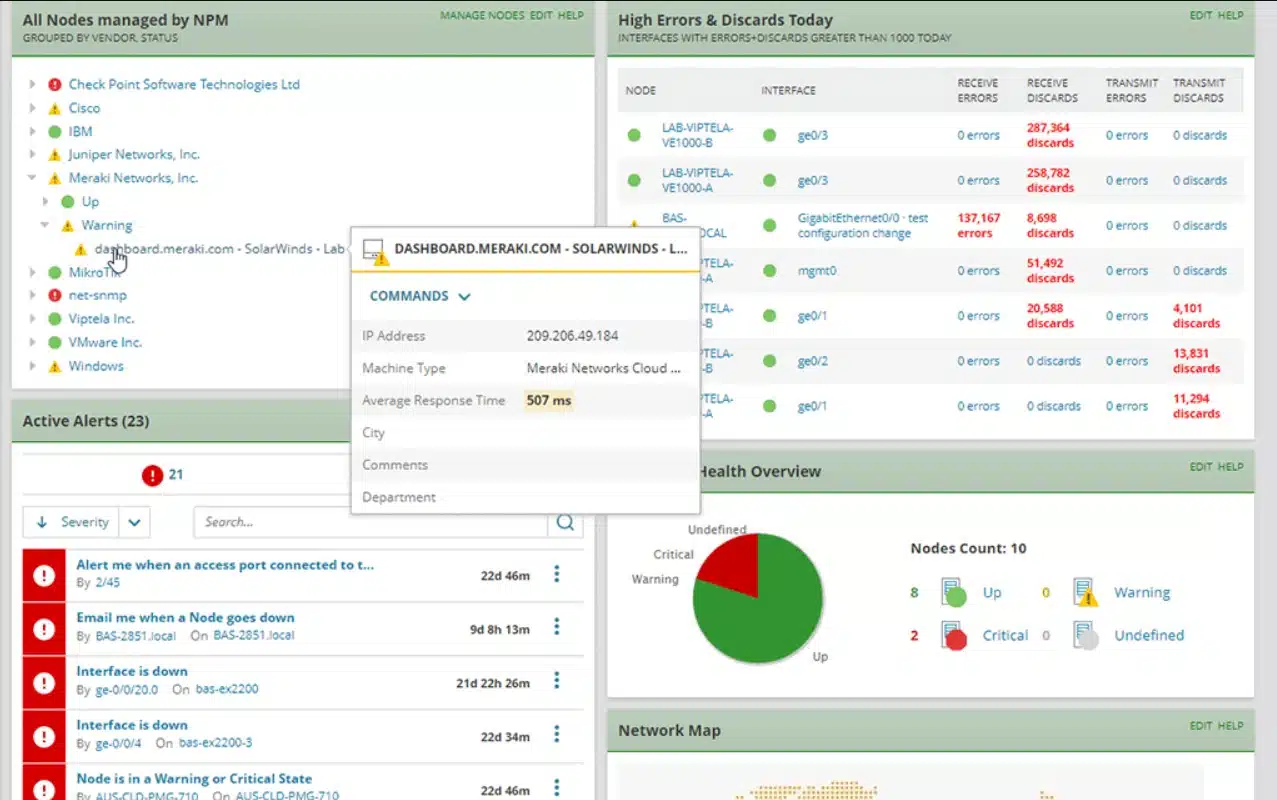
One of the four panels of the Summary view includes a list of critical conditions that have occurred in the day. Live data transmission that feeds into this summary page comes from the SNMP methodology. Most new network-compatible equipment comes with SNMP functions pre-loaded in the firmware and the SolarWinds Network Performance Monitor automatically detects and interacts with device agents to keep you informed of equipment status.
Those real-time status alerts are the core of the monitoring system, but you don’t want to be swamped by every status message that feeds into the monitor. The interface can be customized to filter status alerts and notify different team members according to different network activity conditions that might arise. This helps you to manage your time more effectively if you are in charge of a large network, supported by a group of specialists. This facility is particularly useful if a lot of your hardware support is outsourced — the Network Performance Monitor directly notifies the service provider, so you don’t need to waste time putting in calls for support.
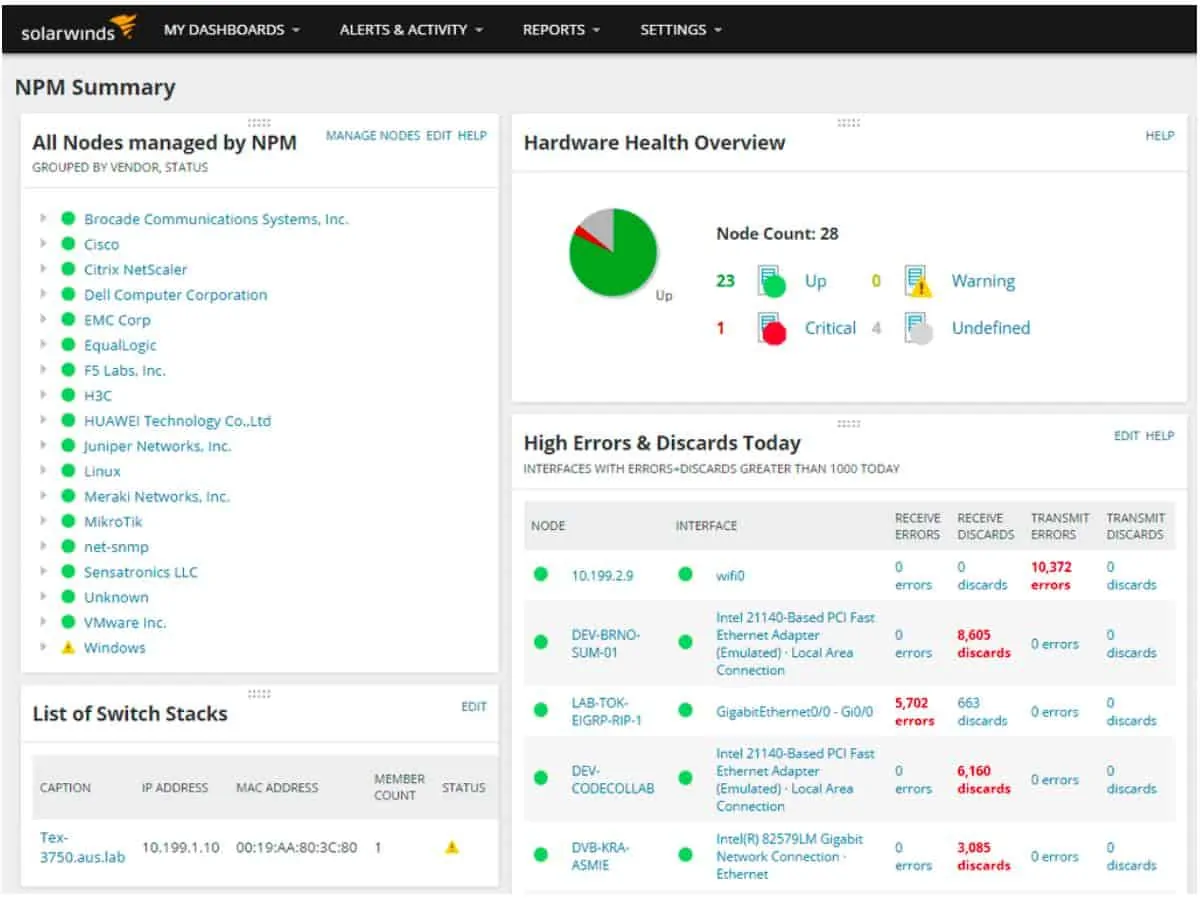
The monitoring package manages wired and wireless networks. You can drill down to get details of each node on the network to examine problems and keep track of utilization. Again, the node detail screen has graphic displays to give you a full picture of performance at a glance.
Who is it recommended for?
The Network Performance Monitor is a comprehensive system that is needed for larger networks. That is, small businesses with a smaller LAN won’t need all of the network monitoring features of this package. This SolarWinds tool runs on Windows Server.
During our testing, we identified the following pros and cons related to Network Performance Monitor.
Pros:
- On Premises Package: Runs on Windows Server
- Performance Alerts: Get a notification if network performance drops
- Equipment Failure Alerts: A hardware failure triggers an immediate alert
- VPM Status Scanning: Get notified if VPNs go down
- Get Network Changes Documented: The autodiscovery repeats continuously and automatically updates the network inventory and map
Cons:
- No Cloud Version: Only available for Windows Server
The SolarWinds Network Performance Monitor is aimed at large corporate networks, with the entry-level system coming in at $1,638 (£1,300). Prices increase according to the number of nodes on your network. So, if you only have a small network and a very tight budget, this comprehensive LAN monitoring tool is probably not for you.
EDITOR'S CHOICE
SolarWinds Network Performance Monitor is a great choice for a LAN monitoring software tool because it includes autodiscovery that creates a network inventory. That log of network equipment is constantly updated and it is also the source of an automatically drawn network topology map. The system will continuously check on the availability and health of all network devices by using the Simple Network Management Protocol.
Download: Get 30 Day Free Trial
Official Site: https://www.solarwinds.com/network-performance-monitor/registration
OS: Windows Server
2. AKIPS (FREE TRIAL)
AKIPS is an on-premises network monitoring system that provides an SNMP-based network device status tracking and a traffic analysis module that is implemented through the NetFlow protocol. The monitoring service enables manual analysis of traffic flows and utilization of each network device.
Key Features:
- Network Discovery: Constantly recycles
- SNMP-Based Device Status Polling: Identifies component failure
- NetFlow Traffic Analysis: Records device overloading
- Alerts for System Performance Problems: Identifies device failure or traffic anomalies
Why do we recommend it?
AKIPS provides both network device monitoring and traffic analysis. The package is a good deal because most network monitoring system providers split these two functions out to separate purchases. An alerting mechanism creates monitoring automation because staff only need to pay attention to the network if a problem notification arises.
The discovery process of the AKIPS package is implemented with a network probe based on a Ping that cycles through every possible network IP address. Responses are logged and then an SNMP device polling routine begins,
SNMP doesn’t need a list of active IP addresses on a network in order to function because it broadcasts a request. Every network device is shipped with an SNMP agent installed on it. This agent listens for a request and responds with a status report, which is called a Management Information Base (MIB) while it is waiting for a request, the agent scans its host and records status data in the MIB form.
The reason the AKIPS system uses Ping as well as SNMP is that a device that is offline or broken in some way that prevents it from receiving the SNMP request will not be spotted by the SNMP polling process. The SNMP system allows the device agent to send out a message without waiting for a request if it identifies a component problem – this is called a Trap.
So, the AKIPS package records if a network device has a component problem and also if it has shut down. In both of these cases, it will raise an alert. The system can be set up to raise an alert if its traffic monitoring system identifies a problem. This is implemented through a series of throughput boundaries. If the lower level is crossed, traffic from a source has become unusually low, if the upper threshold is breached, the device on the receiving end of the traffic will hit its limits and packets will be lost.
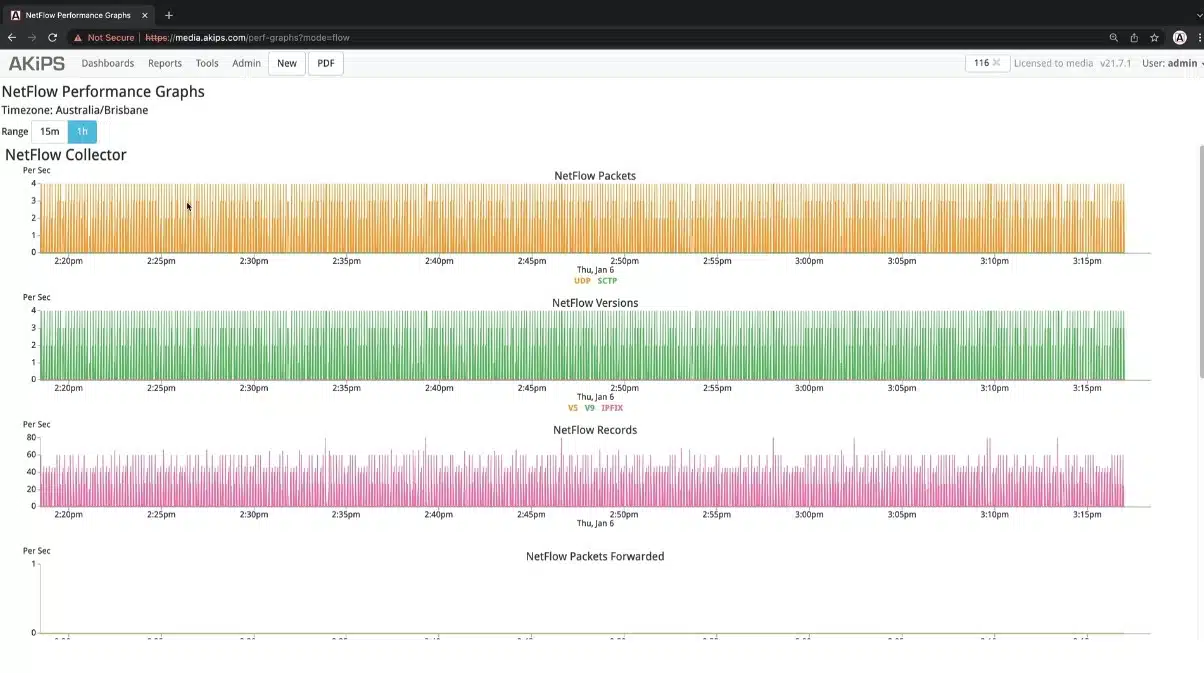
The traffic tracking function is driven by the NetFlow protocol. This is designed to enable switches and routers to accumulate activity data per interface. It also allows external systems to query the stored traffic data.
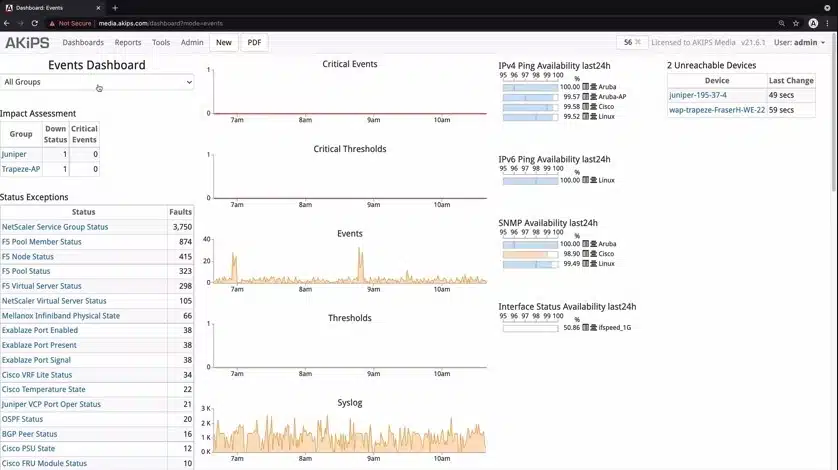
The system also collects log messages from devices and these are displayed in the Events Dashboard of AKIPS, Those logs can be forwarded to SIEM tools. System activity alerts can be sent as notifications to Microsoft Teams, Slack, PagerDuty, ServiceNow, or Opsgenie.
Who is it recommended for?
This package monitors a single network. So, it is ideal for businesses that run one LAN. There aren’t any internet link monitoring features in the package, so you wouldn’t use it to monitor WANs or hybrid systems that include cloud-based services.
Pros:
- Log Server Functions: Log collection and forwarding
- Traffic Data Collection: For capacity planning
- Live Performance Monitoring: Ideal for operations support
- Easy Problem Recognition: Charts and graphs to display system activity
Cons:
- No Price List: You need to obtain a custom quote
The AKIPS software package needs to run within a VM. The tool runs on FreeBSD Unix within the VM and this operating system is included in the installation package. This means you don’t need to worry whether you have a server with the right operating system to run the package. AKIPS offers a demo of the network monitoring system and you can run the package yourself with a 30-day free trial.
3. ManageEngine OpManager (FREE TRIAL)
OpManager is produced by ManageEngine, another significant player in the network software industry. You can get a free version of the OpManager system to get familiar with its features and get your small enterprise’s network properly monitored.
When we tested OpManager we found the following key features.
Key Features:
- Automated Monitoring: Covers networks and servers
- Autodiscovery: Creates an inventory and network topology map
- Continuous Status Checking: Uses the Simple Network Monitoring Protocol
- System Documentation Updates: Discovery cycles constantly and notices hardware changes
- Physical and Virtual Server Monitoring: Servers running Linux and Windows Server plus Hyper-V, VMware, Citrix Xen, and Nutanix HCI
Why do we recommend it?
ManageEngine OpManager is a very close competitor to the SolarWinds Network Performance Monitor. This is also an on-premises package and it is also based around SNMP. OpManager creates and maintains a network inventory and network topology map. Unlike the Network Performance Monitor, OpManager also provides server monitoring.
You are allowed to monitor up to three devices with the free OpManager. However, you still get the same level of system notification that users of the paid version get. The engine of the monitoring methodology uses SNMP.
This is built into all new network-compatibility hardware, so you will automatically be able to get real-time feedback on network activity from all of the devices connected to your network. Another common technology that underpins the OpManager system is the NetFlow traffic monitoring methodology.
Whether you are using the free system, or if you have opted to pay, the software can be loaded onto Linux or Windows. It includes the capability to interact with SQL-based databases and MySQL, Active Directory, and Eventlog.
If you are looking into buying the OpManager system, you have the choice of two plans: Essential and Enterprise. You can manage up to 1,000 nodes with the Essential plan and up to 10,000 with the Enterprise package. Both of these options can extend their monitoring to WAN and voice systems with remote monitoring and QoS functions.
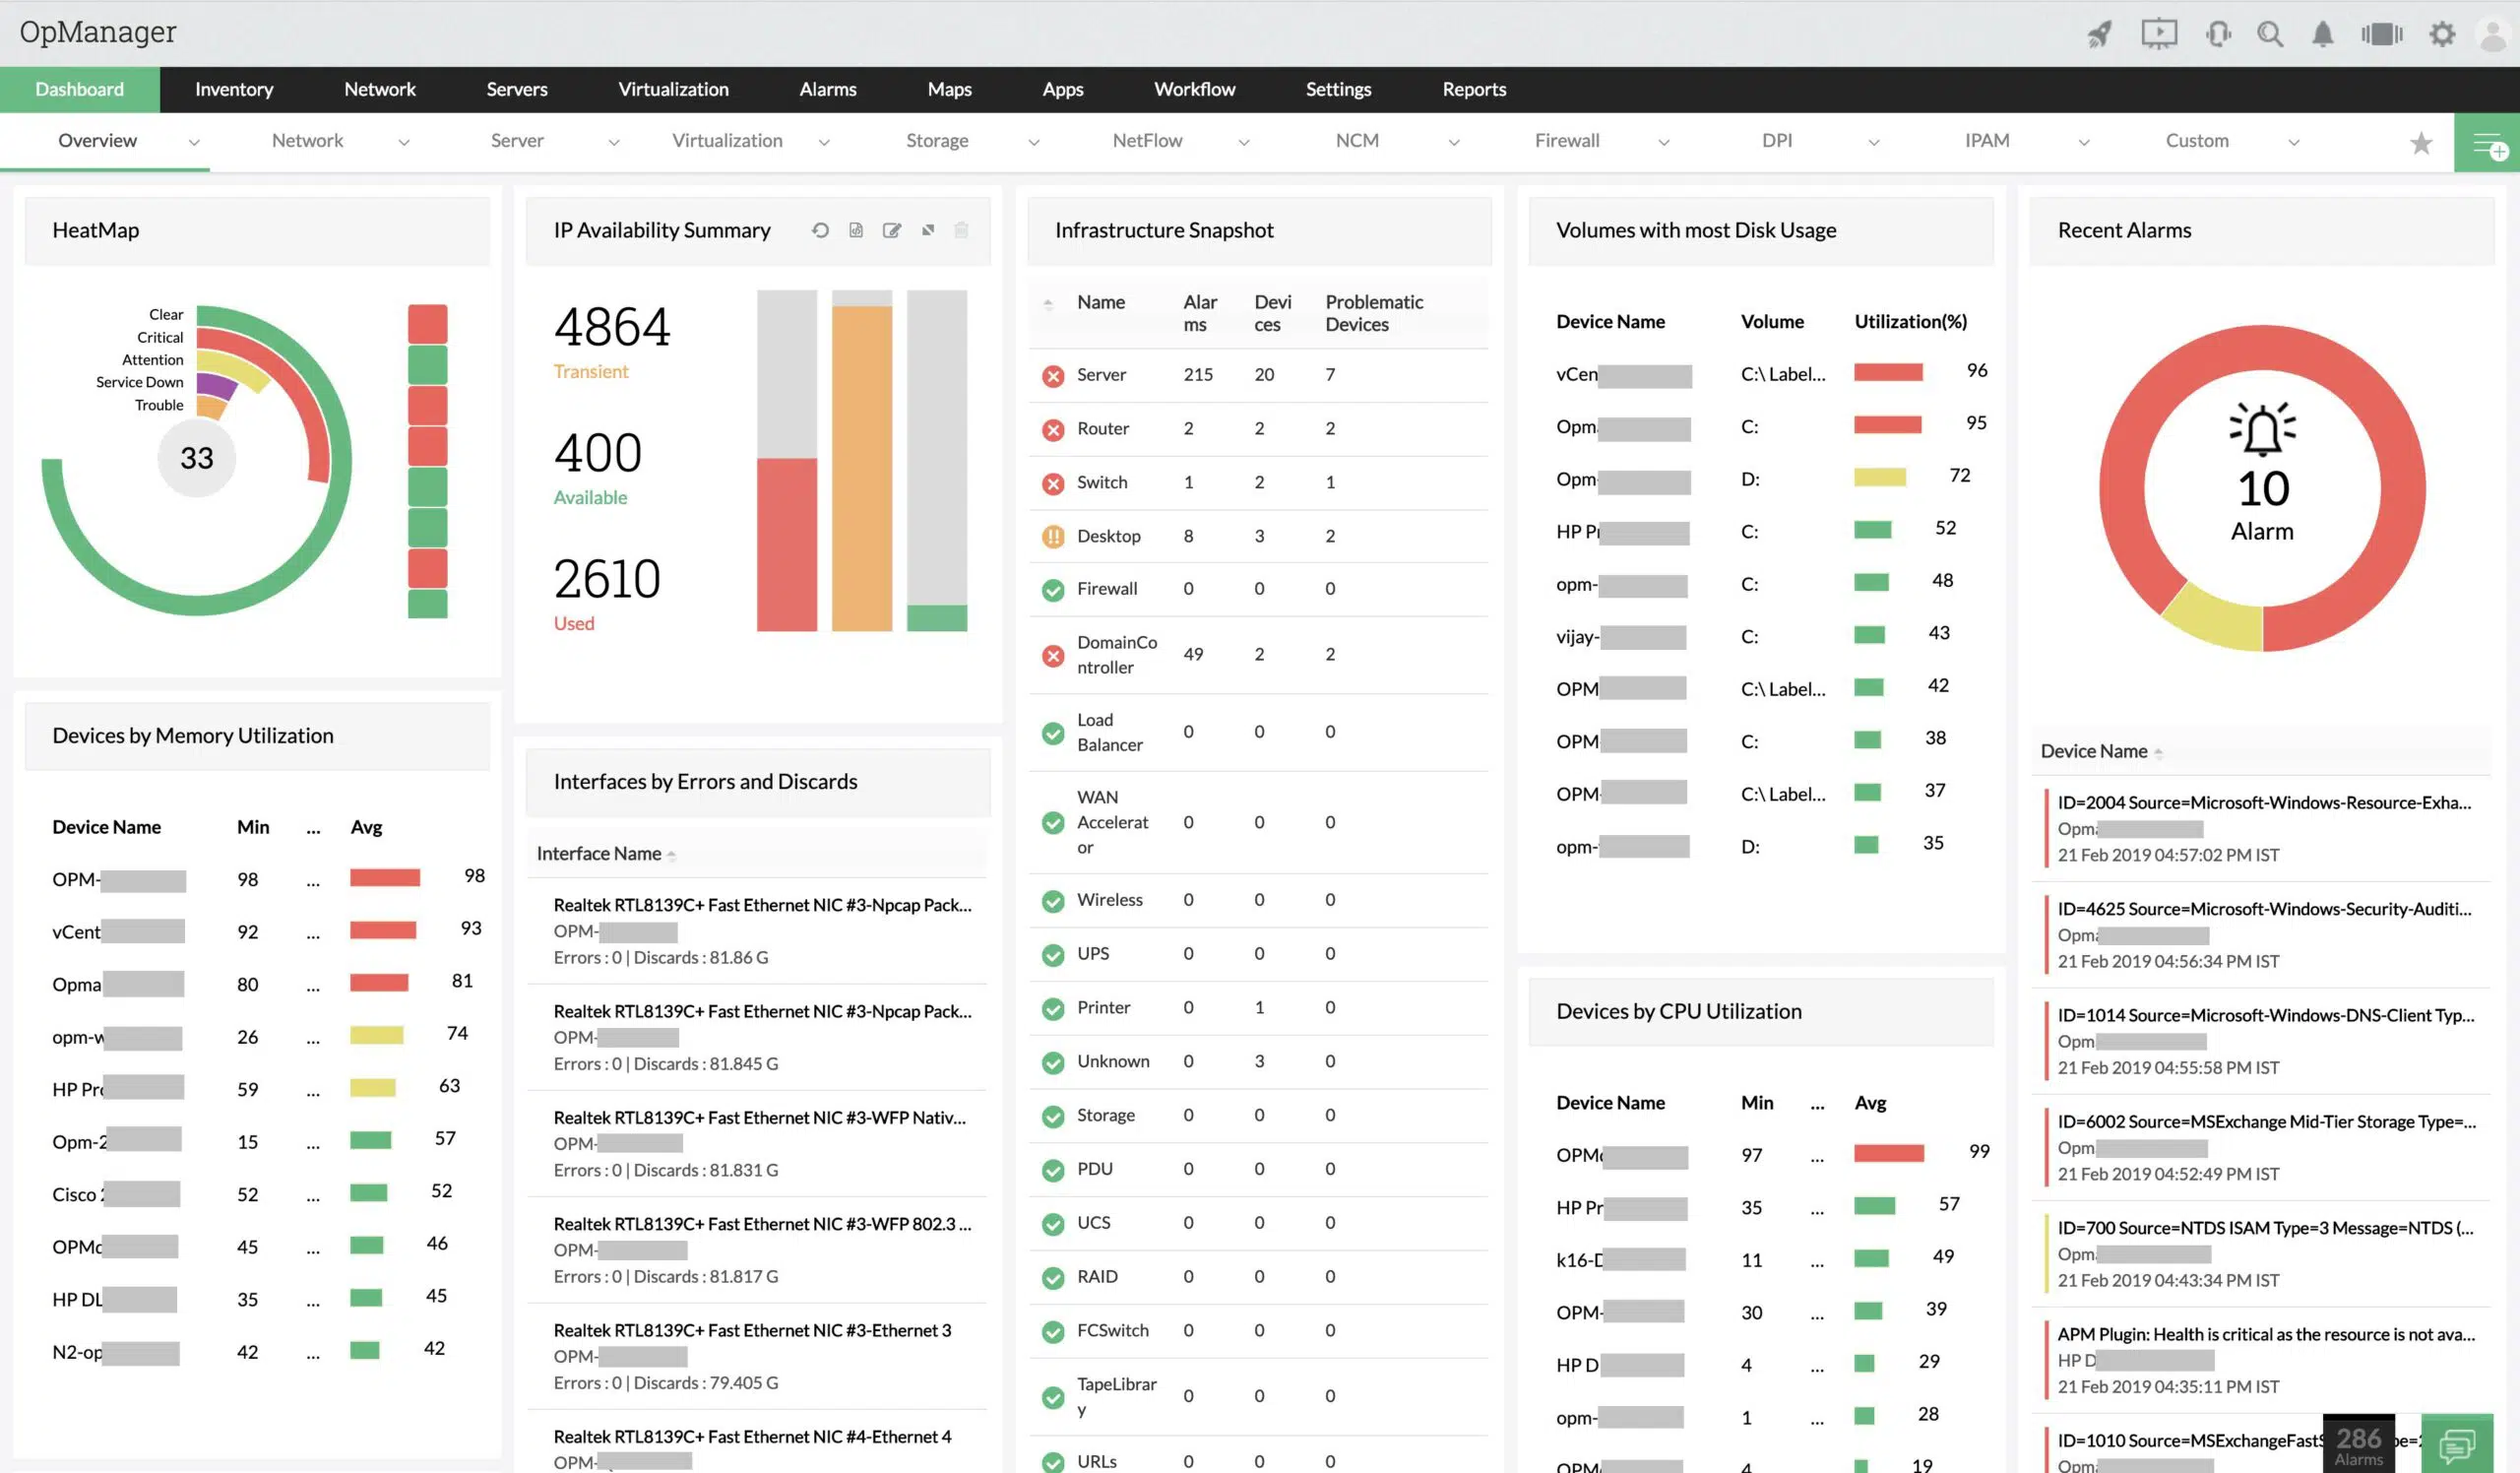
A feature that you don’t get with the free version of OpManager is the auto-discovery utility. This will map your network and present it in a nice graphic in the dashboard. The map displayed on the screen is based on a real map of the world, so you can get a visual representation of your entire network even if it is global. The top strap of the dashboard’s main page is packed with miniature graphs, charts and dials. Although each of these will go full screen if you click on them, the color-coding of those icon displays makes it very easy to get a quick overview of the network’s status.
Who is it recommended for?
ManageEngine provides more deployment options for OpManager than SolarWinds offers with its network monitoring package. This system can be installed on Windows Server, Linux, AWS, or Azure. So, if you don’t have Windows Server, you can’t have the Network Performance Monitor but you can have OpManager. There is a version of OpManager for managed service providers (MSPs) and also a Free edition, which is limited to monitoring up to three network devices.
During our testing, we identified the following pros and cons related to OpManager.
Pros:
- Monitors All Equipment: Network devices, servers, and endpoints
- On-Premises Option: Runs on Windows Server and Linux
- A Service on the Cloud: Find it on AWS and Azure marketplaces
- Mobile App: For iOS and Android
Cons:
- Small Free Edition: Only covers three devices
If you are looking into buying the OpManager system, you have the choice of three plans: Standard, Professional, and Enterprise. The Enterprise package is designed to monitor multiple sites from one central location. Both the Standard and Professional plans are intended for use on LANs. The more expensive Professional package includes extra features, such as automated and regular device discovery. It also includes virtualization and VLAN monitoring, which you don’t get with the Standard plan. You can download OpManager on a 30-day free trial.
Related post: ManageEngine OpManager – Full Review
4. Paessler LAN Monitoring with PRTG (FREE TRIAL)
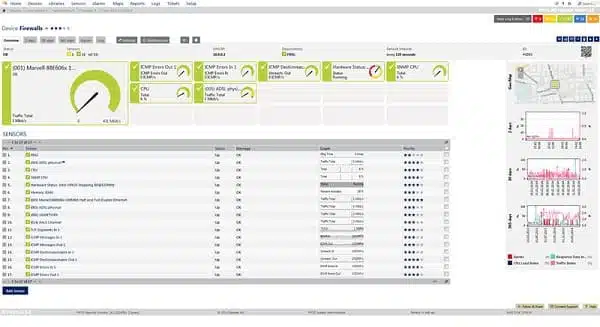
Paessler PRTG covers server monitoring as well as LAN and WAN supervision. The underlying technology that drives this monitoring utility is the NetFlow system. This is able to track packet transfer rates around your network in real-time. A drill-down utility to get a look right down to the network protocol level is provided by a packet sniffer utility. Monitoring isn’t just the task of watching the traffic go by, however.
When we tested Paessler PRTG we found the following key features.
Key Features:
- Network Discovery: Creates a hardware inventory and topology map
- Constant Status Monitoring: Uses the Simple Network Management Protocol
- Flexible Package: The buyer chooses which sensors to activate
Why do we recommend it?
Paessler PRTG is a LAN monitoring tool that, like all of the other tools on this list, is based around SNMP. PRTG will create a network inventory and map and implement continuous network status monitoring. You can decide which modules you want to activate from the very large package of sensors. This means that the price of the tool varies, depending on the number of sensors that you want to use.
The Paessler PRTG LAN monitoring functions rely on SNMP to provide alerts to hardware statuses. The alerts provided by SNMP enable network administrators to stay ahead of crises. You can save a lot of money on your support desk if you can stay ahead of hardware failure and fix it before user calls start to get out of hand.
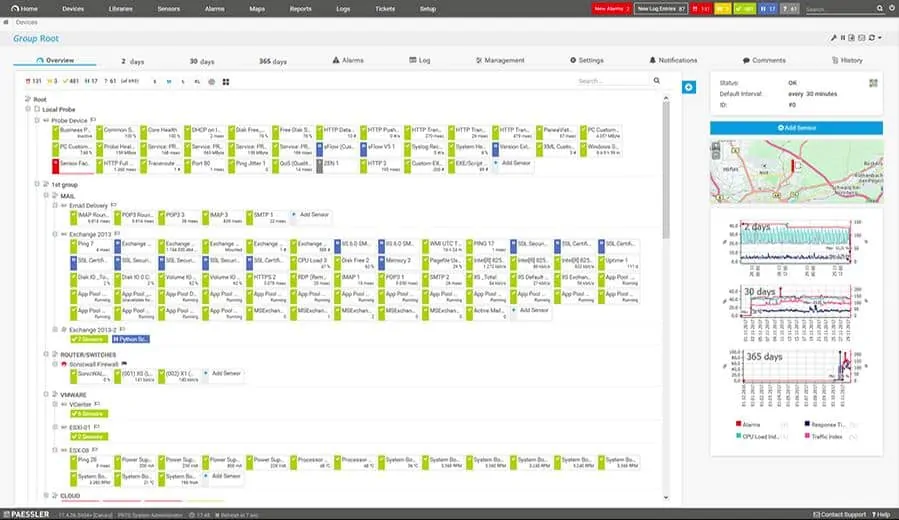
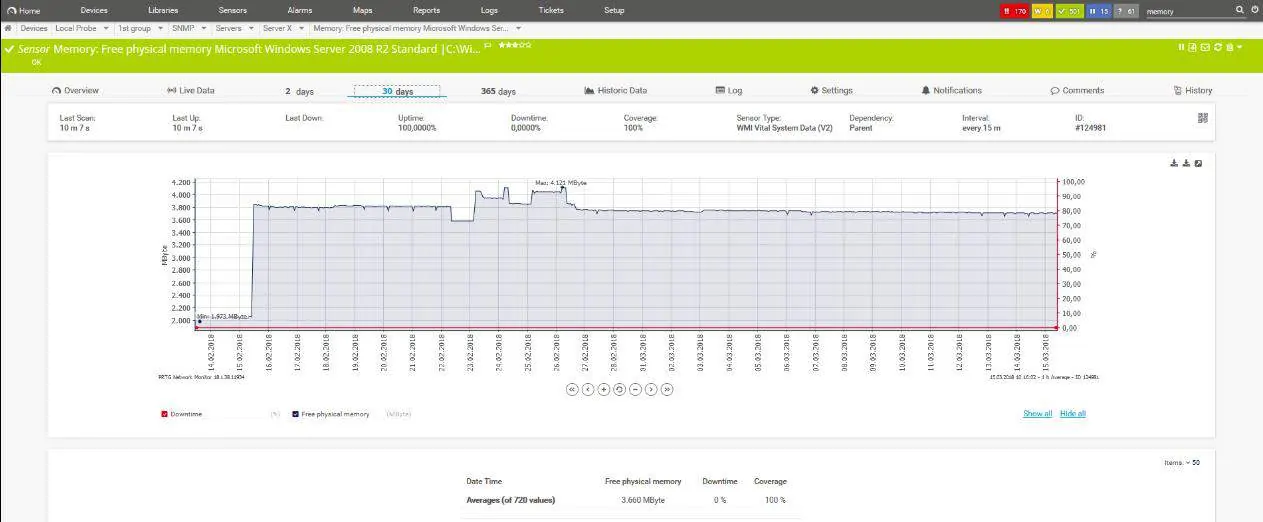
A great benefit of SNMP is that it uses very little bandwidth, so your monitoring with this suite will not slow the network down. The dashboard of the Paessler system is a great user interface that includes graphs, charts, and dials to give you instant information on the overall status of your network. You can query individual nodes on the network to get instant status reports containing live data. Those device-specific pages contain easy-to-follow graphics and the whole dashboard can be accessed from any computer on the network as well as tablets and smartphones.
PRTG is particularly powerful for multi-site operations that include internet connections and cloud services. You can centralize all of your network management functions in one location, accessing each individual site LAN remotely, thanks to Paessler’s Remote Probe technology. PRTG will also monitor your wireless networks.
A Paessler PRTG install is very heavily guided. A lot of the installation procedures are automated and the integrated network discovery feature gets your topology mapped automatically. The LAN monitoring tool includes templates that gather status information on each device. That brings a standardized format to your monitoring effort, enabling you to pay equal attention to all of the equipment on your network. Many aspects of the PRTG monitoring system can be customized, giving you the notifications and statuses that have become critical to the success of your network.
Who is it recommended for?
The flexibility of PRTG makes it very popular – not everyone wants all of the bells and whistles of a full stack monitoring package, so the ability to limit the remit of each instance is a cost saver. One limit to PRTG’s appeal is that it will only run on Windows Server. However, Paessler mitigates that problem by delivering the system as a SaaS platform as well. A Free edition, which has a limit of 100 sensors, extends the appeal of PRTG to small businesses.
Pros:
- Deployment Options: On premises or a cloud-based SaaS platform
- Connection Testing: With Ping and Traceroute
- Free Version: Provides 100 sensors
Cons:
- Windows Only: The on premises version is only available for Windows Server
Paessler’s PRTG free trial allows for an unlimited number of sensors but is only available for a 30-day period. There is also a freeware version – aimed at assisting small businesses as they grow – which currently allows for up to 100 sensors to be used for an indefinite amount of time.
5. SolarWinds Flow Tool Bundle (FREE TOOL)
The Flow Tool Bundle from SolarWinds is a set of three network traffic analysis utilities. This pack is completely free of charge.
When we tested Flow Tool Bundle we found the following key features.
Key Features:
- Flow Data Generator: Simulate traffic data for training and testing
- NetFlow Configurator: Set up the NetFlow sensor on network devices
- Free to Use: Not a free trial
Why do we recommend it?
SolarWinds Flow Tool Bundle is a LAN testing tool. However, as testing is “active monitoring,” this free package still fits into the remit of this report. You can test your network’s capacity with this package of a traffic generator and NetFlow configurator. There isn’t a mechanism in the bundle for gathering the results of your tests.
Network performance monitors usually focus on the statuses of network equipment; network traffic analysis tools, such as this one, look at the volumes of traffic that pass along the network cable between devices. You don’t need to put a network tap on the cable to see that traffic in transit because all packets flow along the cable between two network devices. So you can get an understanding of the events on the cable by looking at the flows of traffic on the network equipment at either end.
Cisco Systems created NetFlow to enable Systems Administrators to collect traffic at the router. This system focuses on collecting packet headers, port, and interference information, all part of Cisco’s CDP. It both duplicates traffic and calculates summaries of traffic types and volumes. The Flow Tool Bundle works with NetFlow v5 and helps you to exploit the data created by NetFlow for analysis.
The pack includes three utilities:
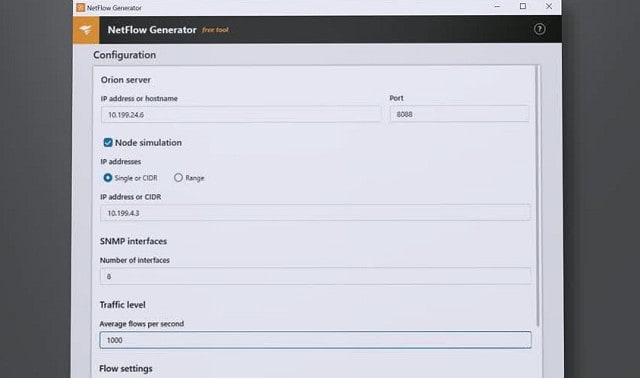
- NetFlow Configurator
- NetFlow Replicator
- NetFlow Generator
The NetFlow Configurator acts as an interface to all your Cisco routers. NetFlow works on IP packet headers, so it is a relevant function of switches. Rather than logging in to each router in turn and working through the router manager menus, you can just use this simplified front end. It narrows down all of the functions to just turning on NetFlow capabilities and directing that traffic to your NetFlow collector. This acts as a great time saver.
The NetFlow Replicator tool takes your saved NetFlow data and replays events on your network. This enables you to get a look at traffic in a replay. This saves you the worry of having missed the reasons for any slow down or failure that might have occurred while you were out of the office or away from your desk.
The NetFlow Generator creates fake traffic to give you extra volume to run around your network. This is a great exercise if you plan to increase services or add extra endpoints to your network that would result in greater traffic volumes. You can test the performance of your load balancers, firewalls, and network performance monitoring alerts before planned changes occur.
Who is it recommended for?
This software runs on Windows Server and, although it will push a lot of traffic over your network, you will need another tool to gather performance statistics. SolarWinds suggests you buy its NetFlow Traffic Analyzer, which also needs the SolarWinds Network Performance Monitor. However, there are a number of free network monitors that you could use instead to watch the traffic surge, such as Nagios Core or Zabbix.
During our testing, we identified the following pros and cons related to Flow Tool Bundle.
Pros:
- Create NetFlow Examples: Use this tool to familiarize staff with NetFlow data
- Test Network Devices: Send traffic data to network devices for testing
- Ensure Devices are Working: Make sure that network devices are reporting NetFlow properly
Cons:
- Only NetFlow: Doesn’t deal with sFlow, J-Flow, or NetStream
The Flow Tool Bundle helps you head off disaster before it happens. You don’t get any graphical data representations in this tool, but you do get the opportunity to test your network on your own time to prevent things going wrong when you are occupied elsewhere. The Flow Bundle is offered as a free utility.
6. Site24x7 (FREE TRIAL)

The Site24x7 Network Monitoring Tool is a comprehensive IT infrastructure monitoring system that also has application monitoring baked in. Another module in the package tracks user behavior on websites and creates synthetic user walk-throughs for website testing.
When we tested the Network Monitoring Tool we found the following key features.
Key Features:
- Cloud-Based: A SaaS platform
- Network Device Monitoring: Uses the Simple Network Management Protocol
- Traffic Analysis: Gathers traffic flow protocol data
Why do we recommend it?
Unlike many rival cloud platforms, Site24x7 offers subscriptions to all of its modules in packages, so you can’t subscribe to the network monitoring service of Site24x7 as a standalone service. You get both SNMP device monitoring and network traffic analysis in all of the Site24x7 bundles. The packages also offer application and Web monitoring and endpoint monitoring. So, you get full stack observability with a Site24x7 subscription.
A major part of the infrastructure monitoring service is the network monitor. This is a network performance monitor that communicates with network devices rather than watching traffic as it passes over the cables of the network.
This is a cloud service, so there is no need to install any system management software on-site. The service connects to the monitored network over the internet. All communications between the network and the controller in the cloud are protected by encryption. Access to the dashboard, which is resident in the cloud, is facilitated through any web browser. The data transmissions of this access are also protected by encryption.
Site24x7 begins its service by contacting the monitored network and performing a system sweep. In this phase, the network monitor contacts every device for its identification details, including make, model, and statuses. The results of these inquiries are written into an inventory. Site24x7 also creates a network topology map from the information gleaned during the autodiscovery phase.
The inventory and topology map are constantly updated to reflect changes in the network and the devices that run it. Apart from switches and routers, the service monitors firewalls and other network appliances. It will track the performance of WAN links, wireless networks, and cloud services as well as the on-site cabled network.
The heart of the Site24x7 LAN monitoring service is based on the SNMP protocol. This network protocol is an industry-standard. There are two elements in the SNMP system: device agents and an SNMP manager. The role of the SNMP manager is to poll device agents. Each agent scans the device that it is monitoring for statuses and places that information in a standard format. When the information request arrives, it replies with the current version of the status report, which is called a Management Information Base (MIB). The SNMP manager compiles the received MIBs into statuses shown on the system dashboard.
SNMP agents are loaded onto every network device by the equipment manufacturers. Site24x7 fills the role of the SNMP manager. The manager also receives urgent status notifications from device agents when a critical condition is detected. These notifications get translated into warnings and alerts in the Site24x7 dashboard, so network managers don’t have to wait until a problem with a device causes noticeable network performance issues.
Who is it recommended for?
Although a standard package from Site24x7 includes many monitoring tools, its subscription price is very accessible and the smallest package provides monitoring for a network that includes up to 10 servers. The low price of the tool and the ease of setup means that it is appealing to businesses of all sizes. Automated alerting in all of the monitoring tools allows time-pressed technicians to work on other tasks rather than watching the Web-based console for the monitoring system all the time.
During our testing, we identified the following pros and cons related to Network Monitoring Tool.
Pros:
- Flow Protocols: NetFlow, sFlow, J-Flow, Cflow, NetStream, AppFlow, and IPFIX
- Network Discovery: Creates a hardware inventory and network topology map
- Alerts for Problems: Trigger for component failure, traffic slowdown, and packet loss
Cons:
- Not a Standalone Package: Part of a full stack observability service
Site24x7 is available in a free version and four paid editions. The free version is limited to active monitoring of five websites or servers. The charged-for versions are paid for by subscription and each is available on a 30-day free trial.
Further Reading: Site24x7 – Full Review
7. SolarWinds Hybrid Cloud Observability (FREE TRIAL)
SolarWinds Hybrid Cloud Observability tracks the performance of networks and the devices connected to them. It is designed for businesses that use cloud services as well as on-premises infrastructure, so it monitors those remote platforms and the connections to them as well.
Key Features:
- Network Device Monitoring: Uses the Simple Network Management Protocol
- Traffic Analysis: Gathers traffic flow data
- Path Analysis: End-to-end path visualization
Why do we recommend it?
SolarWinds Hybrid Cloud Observability isn’t just able to monitor cloud platforms – it can monitor your LAN as well. This is a new package from SolarWinds that competes with the Site24x7 system because it provides all of the layers of services for application delivery down to the network.
The Hybrid Cloud Observability system includes an autodiscovery service that identifies all of the devices connected to the network. It creates a network inventory from this information and provides the source information for a network topology mapper.
The LAN monitor watches activities on the discovered devices and the connections between them, which includes cloud services and internet connections.
This package will monitor virtual systems as well as physical infrastructure. That includes VLANs, virtualizations, cloud virtual servers, and SD-WANs. The system will document and map these virtual structures.
The SolarWinds tool composes an application dependency map from the information it picks up while monitoring operations. This map is a tool for root cause analysis, should problems need investigating. The dashboard also provides a visual Traceroute service for testing end-to-end connections on demand.
An alerting mechanism will send out a notification to technicians via SMS or email if an evolving problem is detected.
Who is it recommended for?
This package is very affordable and ideal for a small business. However, it is also suitable for small businesses that don’t want to invest in a lot of different SolarWinds monitoring systems and slot them together. This is like a bundle of SolarWinds systems all packaged together. Pricing is per node per month and it can cover systems that include both on-premises and cloud-based services and check on the network and internet connections that link them together.
During our testing, we identified the following pros and cons related to Hybrid Cloud Observability.
Pros:
- Deployment Options: Install on Windows Server, GCP, AWS, or Azure
- SaaS Service: Get it as a SaaS subscription
- Monitor Connections to Cloud Services: Hybrid network monitoring
Cons:
- No Price List: Small businesses might prefer the free tools on this list
Hybrid Cloud Observability is available in two editions: Essentials and Advanced. Both are subscription services with a rate per node per month, although this is an on-premises software package that runs on Windows Server. You can get
a 30-day free trial of the Advanced edition.
8. Atera (FREE TRIAL)
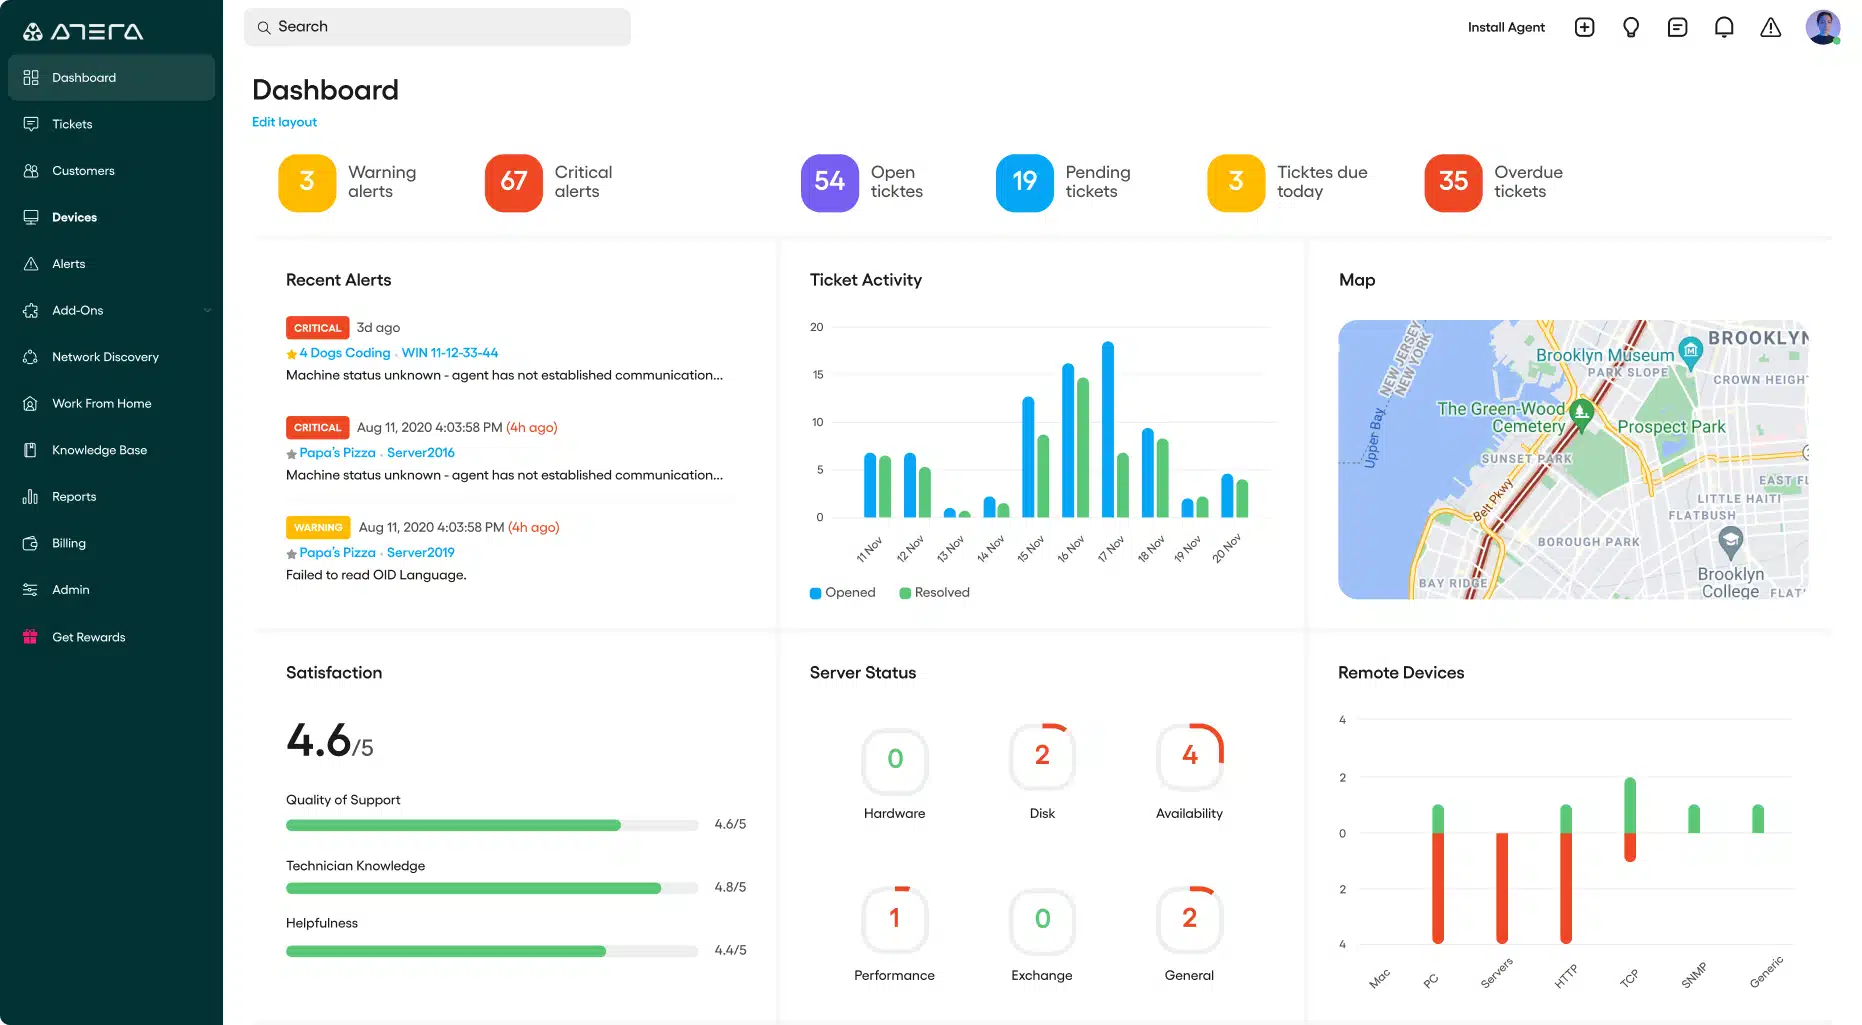
Atera is a cloud-based support package for managed service providers (MSPs). Atera includes professional services automation (PSA) tools, which MSPs use to run the business and remote management and monitoring systems (RMM), which are the software tools that technicians use to support client systems. The Atera RMM includes LAN monitoring.
Key Features:
- Remote Monitoring and Management: Designed for automated system support
- Network Performance Tracking: Uses the Simple Network Management Protocol
- Alerts for Network Problems: Get notified if performance drops or devices fail
Why do we recommend it?
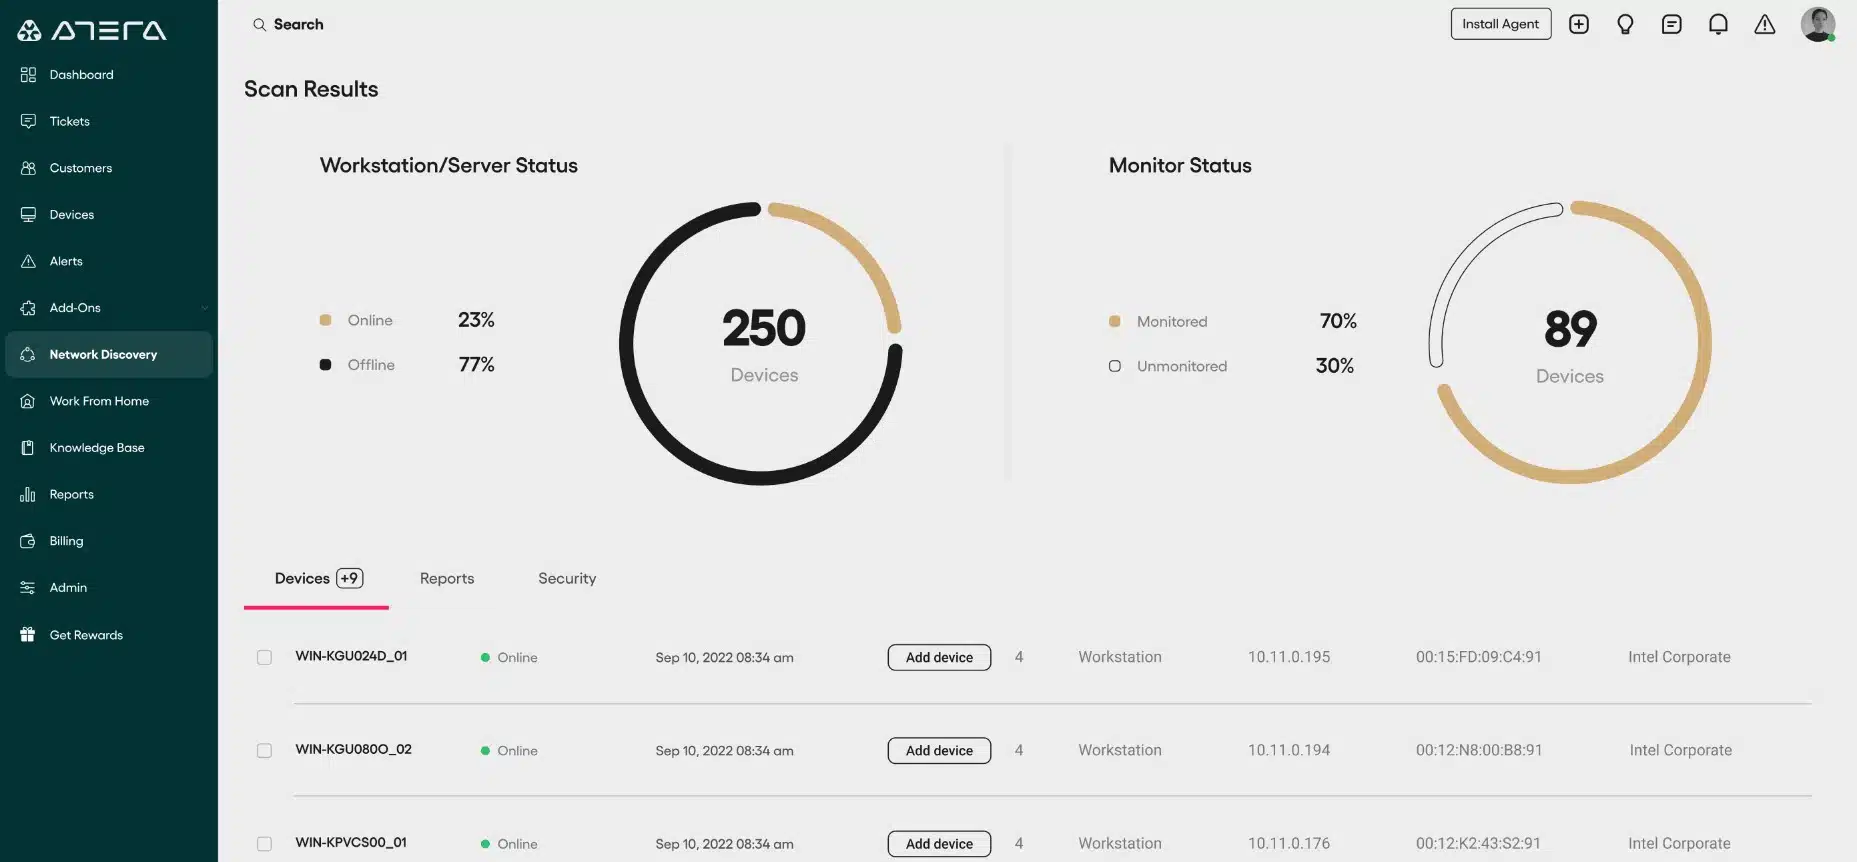
Atera has two versions – one for IT departments and one for managed service providers. The package enables support teams to look after a remote site and in the MSP case, that also means remote clients. The SaaS platform includes a network discovery service and an automated network monitor with alerts. Curiously, network discovery is a paid add-on for all of the Atera plans.
As the service is based on the cloud, the subscribing MSP doesn’t need to install any software on its own site in order to use the platform – all of the processing and hosting is based on the Atera servers. Technicians access the dashboard for the system through any standard browser.
The network monitoring system uses SNMP to supervise devices on the network. The service requires that agent programs are installed on the client site. That agent communicates SNMP data to the Atera server for processing via a secure link.
The LAN monitoring pages of the RMM are attractively laid out and include alerts and performance data in color-code graphical elements. The layout of the monitoring page can be customized to create limited views. This also enables the MSP to make information screens available to the client.
As well as monitoring networks, the RMM is able to monitor servers and applications. All of the screens are customizable and the dashboard also gives access to process automation features. One automated tool in the system is its network discovery utility. This does an initial sweep when the agent is first installed on a new site. The autodiscovery program will compile a device inventory. The process runs recursively, so the inventory is updated with a live list of all equipment connected to the network.
Who is it recommended for?
A large business or multiple sites or a managed service provider would get the most out of the Atera system. The package includes monitoring services for networks, servers, and software and it also provides software management tools, such as a patch manager. Plans provide team management and user communication systems through a ticketing service. There are also remote access tools in the Atera plans.
During our testing, we identified the following pros and cons related to Atera.
Pros:
- Help Desk Ticketing System: Let users raise support requests and manage support team workloads
- Endpoint Management: Monitor endpoints as well as networks
- IP Address Management: Ensure that there are no address conflicts
Cons:
- Extra Charge for Network Discovery: Not included in plan prices
As this is software-as-a-service, Atera bundles processors and storage space on the cloud in with the use of the software. You don’t need to buy the software you pay for access to it on a subscription. This removes a lot of the startup costs involved in creating an MSP, so Atera is very popular with small MSPs and startups. Prices are set per technician per month or per year, so it is easy to expand the MSP by just adding on seats. You can get a look at Atera by applying for a 30-day free trial.
Related post: Network Configuration Management Tools
9. Nagios Core and Nagios XI
Nagios manages open-source network monitoring software, which is completely free to use. The interface for this free system, which is called Nagios Core, is not very comprehensive. You get a basic web interface with the main download, and then you can search through the Nagios Core community pages to look for plugins and skins that other users have developed for themselves and are willing to share.
When we tested Nagios we found the following key features.
Key Features:
- Free and Paid Tools: Nagios Core is free, Nagios XI is a paid system
- Network Discovery: Creates and updates a network inventory and topology map
- Constant Monitoring: Alerts for performance problems or hardware failure
Why do we recommend it?
Nagios Core and Nagios XI are two versions of a full-stack monitoring package. The Nagios Core option is the base package of Nagios. It is an open source system and free to use. The big problem with this offering is that the user interface of the bundle offers the bare minimum and it just isn’t good enough. You would have to work out how to channel Nagios data through to another frontend, such as Kibana in order to use this option. Nagios XI has a proper interface and more features than Nagios Core. However, network traffic sampling is a paid add-on needed by both versions in order to get full network monitoring capabilities.
The Nagios Core system is a great option if you have no budget for LAN monitoring tools and you are prepared to compromise on presentation. There is a free version of Nagios XI that is free with limitations — you can only use it to monitor seven nodes. However, this offer, together with two grades of paid usage, means that Nagios XI is suitable for all network sizes.
The Standard paid version is available for $1,995 with a minimum of 100 nodes on the network, and the Enterprise edition starts at $3,495. That is a one-time purchase price and includes access to email support and community forums. You can pay extra for phone support. The buyers of the Enterprise editions are obliged to subscribe annually to a maintenance plan or a maintenance and support plan.
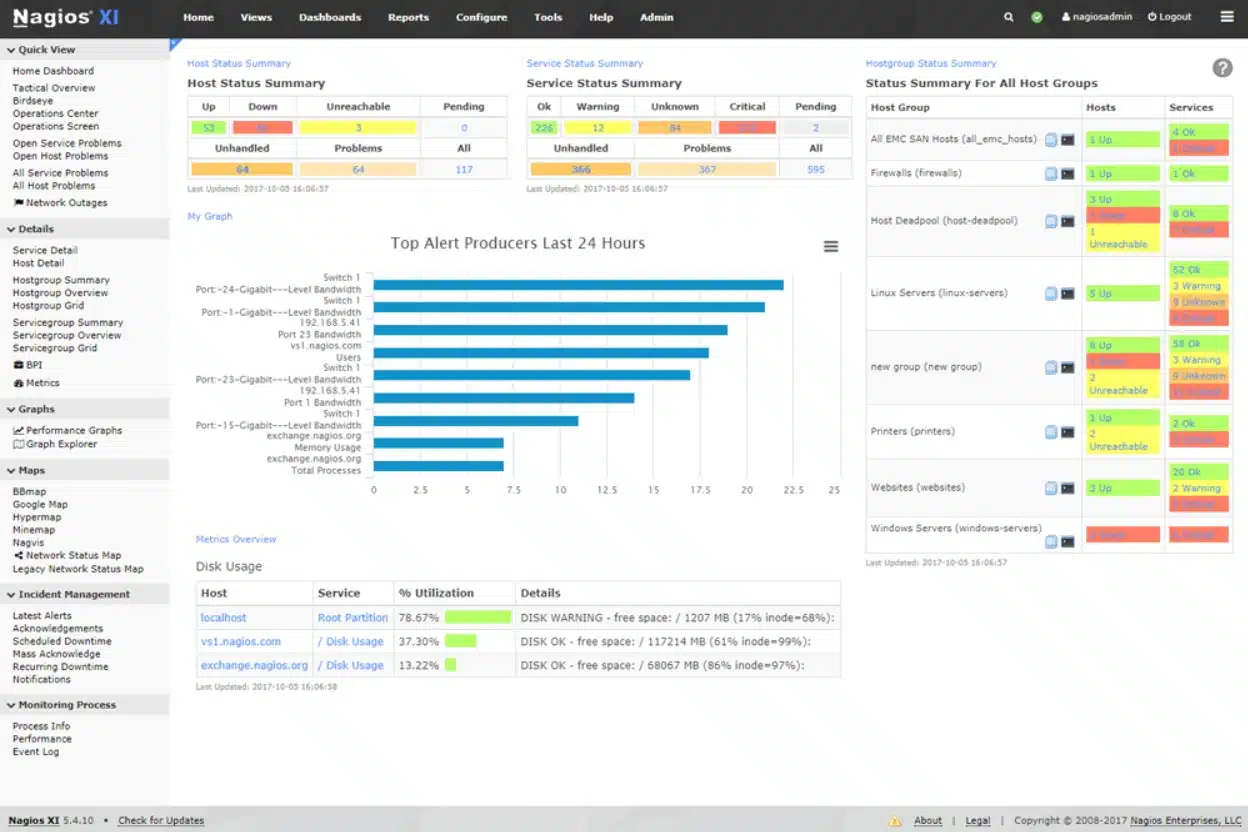
With Nagios XI, you get the real-time monitoring capabilities of Nagios Core, but the data that is collected is managed, presented and filtered in a much more digestible format. The graphics on the dashboard do all of the work for you. You can see instantly where there are problems on the network. The pages of the interface include charts, graphs, and dials that help you get performance data at a glance.
The Nagios XI system is easy to set up because the software includes auto-discovery, so it maps the network by itself. This feature is very useful when you add equipment to the network. A Configuration Wizard helps you to get the interface operating to your tastes. You can create user groups and individual accounts to delegate partial access to data among team members.
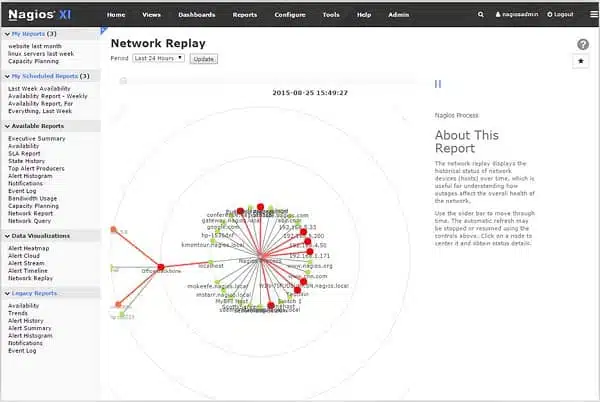
Nagios is able to monitor equipment on remote sites and you can deepen your remote monitoring capabilities for server physical statuses by installing the Remote Code Execution (RCE) agent on those servers.
Who is it recommended for?
Both versions of Nagios were written for Linux. If you have Windows, you can opt to run the package over VMware or Hyper-V virtualizations and it will also run on Docker. The best feature of Nagios is that it can be extended by free plug-ins to add in monitoring capabilities for specific products. Small businesses would appreciate the free Nagios Core. However, there are no free plug-ins for NetFlow collection and analysis and the network traffic analyzer module costs money, even when added to the Nagios Core.
During our testing, we identified the following pros and cons related to Nagios.
Pros:
- Full Stack Observability: Monitors networks, endpoints, and software
- Extensible System: Nagios Exchange provides a library of free extension
- Runs on Linux, Docker, Hyper-V, or VMware: Won’t install directly on Windows
Cons:
- Network Traffic Analysis Not Included: This is a separate package
The range of subscription options, including Nagios Core and the free version of Nagios XI for small networks, means that this system is truly scalable. Nagios Core upgrades to Nagios XI with just a software install. When you switch from the free Nagios XI to the Standard version and then up to the Enterprise package, you don’t lose any of your customizations. This is a very good feature for rapidly expanding companies.
Related post: Nagios vs Zabbix
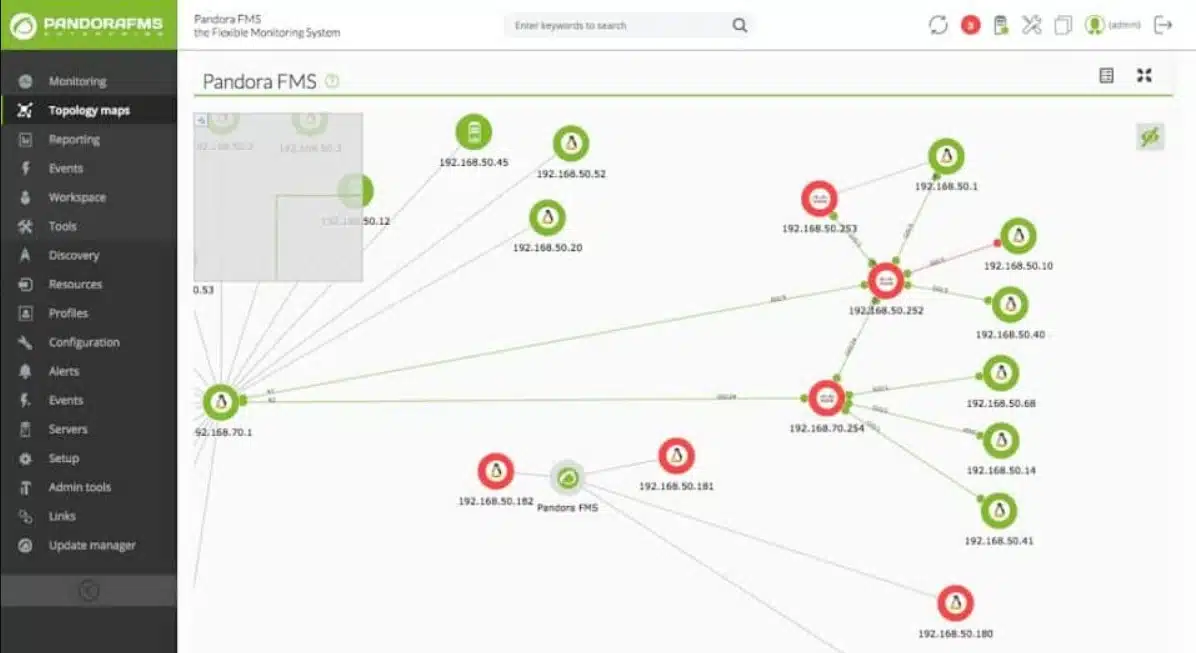
10. Pandora NMS
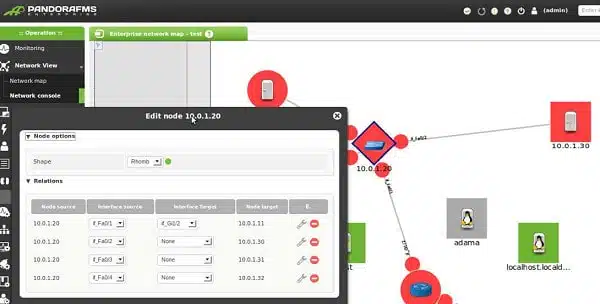
A Pandora NMS install begins with a network sweep that enables the system to map your topology. The network map is just one of the graphics contained in the dashboard that helps you keep track of the system at a glance.
When we tested Pandora NMS we found the following key features.
Key Features:
- Network Discovery: Creates an inventory and network map
- Bandwidth Tracking: Records capacity and utilization
- Network Testing: Troubleshooting with Ping and Traceroute
Why do we recommend it?
Pandora NMS offers many options. It is available in a free version, called Pandora FMS Community Edition, which is a previous version of the paid system, which is called Pandora FMS Enterprise. Pandora NMS is a reduced version of Pandora FMS Enterprise. All versions offer network monitoring based on SNMP plus configuration management for network devices.
The monitoring functions of Pandora NMS is based on SNMP procedures. Your central network manager node will poll the system constantly to keep track of device statuses. Standard SNMP alerts report critical conditions as they arise without waiting for a status request from the network manager. The Pandora engine is able to communicate with devices using SNMPv1, v2c, and v3.
The Pandora package doesn’t just cover real-time network monitoring. The wider system, called Pandora FMS, includes address management as well with a built-in IPAM. The IP address manager can operate with both IPv4 and IPv6 addresses.
The third element of Pandora FMS is its configuration management system, which can keep track of your company’s software patch status and detect rogue software on the system.
Whether this combination would be of interest to you depends on if you already have a DDI suite and configuration management system with which you are happy. However, if you are looking for an entirely new networking toolkit, this option could work out well for you.
If you have a multi-site network, you can centralize all of the management of your organization’s WAN into one location through remote monitoring. However, it is possible to divide up the responsibilities and system access in the dashboard to limit onsite managers’ access to just their subnets — the dashboard’s contents are fully customizable. It is also possible to define roles within the console to give partial access to the controls of the dashboard, enabling junior staff to safely participate and upline managers to access reporting functions.
Pandora NMS is a Spanish product and its prices are set in Euros. The basic network monitoring software package is available as a “Community” edition of its open-source software for free. The full feature Network Management System starts at €850 (£728), which includes professional support. That price is for a package that includes 35 endpoint licenses and the price increases with larger license counts.
Who is it recommended for?
Pandora NMS is suitable for anyone. The Pandora FMS Community Edition is no smaller than the paid version – it is just that the paid version is more up-to-date. Larger organizations would prefer the Pandora FMS Enterprise edition because they would need a professional support package, which isn’t available with the Community edition. Pandora FMS Enterprise and Pandora NMS are available as a SaaS package and all versions can be installed on RHEL or CentOS Linux and they will also run over Docker.
During our testing, we identified the following pros and cons related to Pandora FMS.
Pros:
- Monitors a Range of Equipment: Switches, routers, firewalls, load balancers, WiFi APs, Peripheral devices, and IoT equipment
- IP Address Management: Includes IP maps for subnet planning
- NetFlow Sensor: Tracks traffic volume irregularities
Cons:
- Priced per Agent: Minimum account of 100 agents
Some extra features are available as added extras but are included with the Enterprise plan. They include remote access systems and SAP monitoring. If you need those, you might consider upgrading to the Corporate plan where those extra features are included in the price. The Corporate package is priced by negotiation.
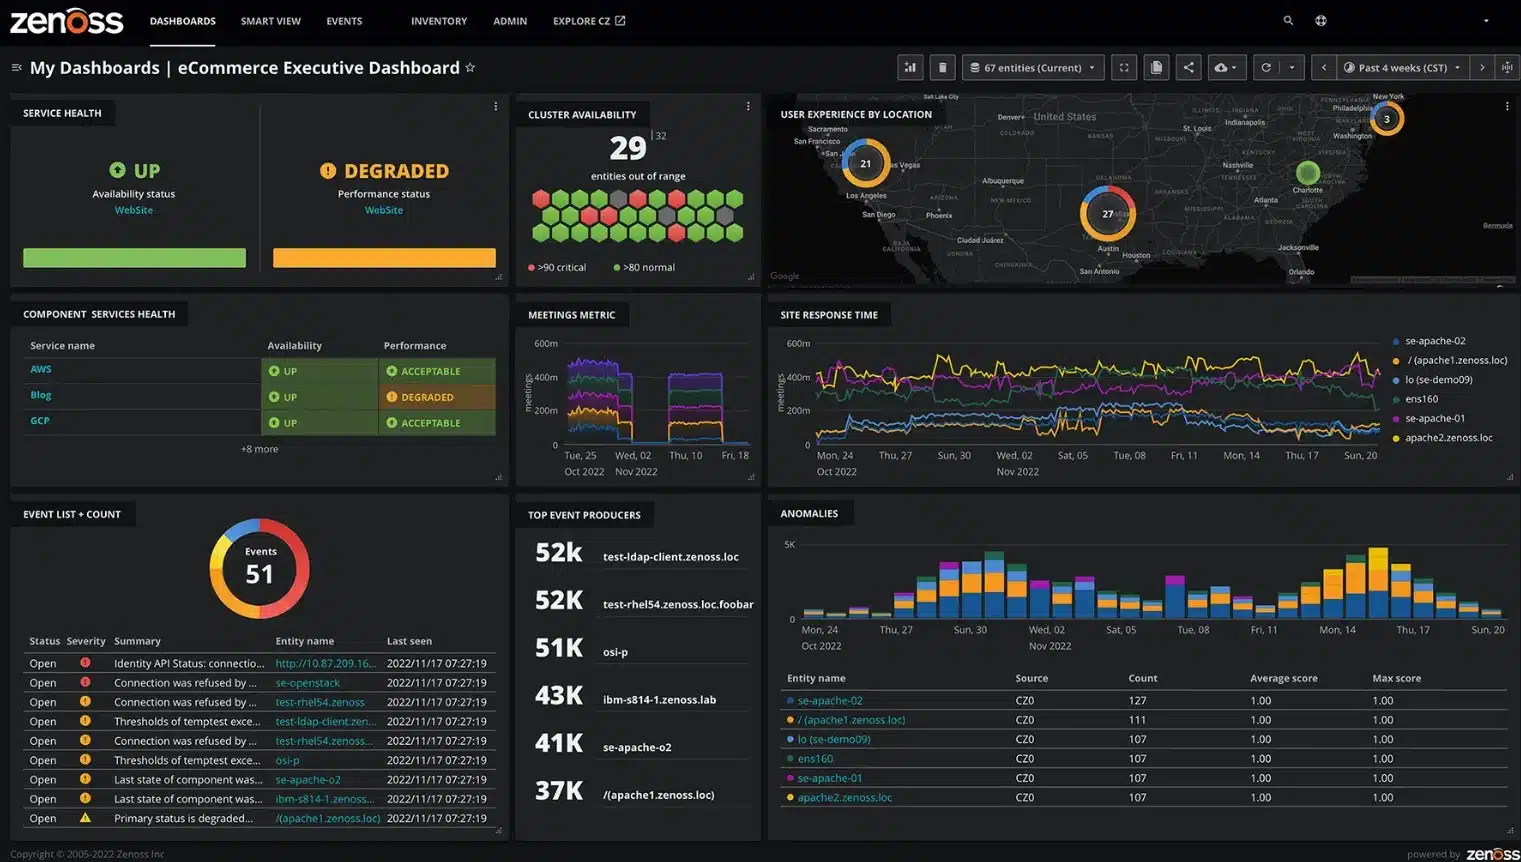
11. Zenoss
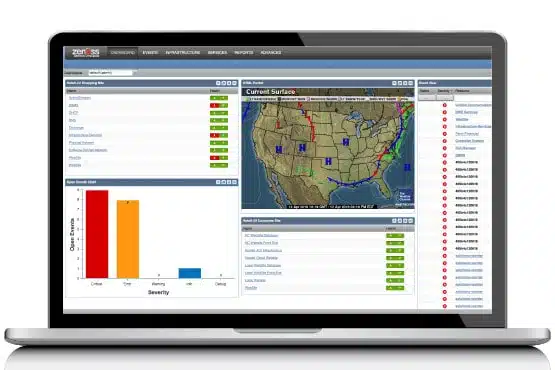
Zenoss Core is an open-source network monitoring system that you can install for free. There are two paid versions of this real-time network monitoring and analyzing software. You can get an onsite version, which is called Zenoss Service Dynamics, or you can have a managed cloud-based service, called Zenoss-as-a-service.
When we tested Zenoss we found the following key features.
Key Features:
- Cloud-Based: This is a SaaS platform
- Extensible System: Add on functions with ZenPacks
- Network Discovery: Documents all network hardware
Why do we recommend it?
Zenoss offers an on-premises version and two cloud editions. This tool is primarily a server and application monitoring system – it is described as “application-centric” monitoring. However, there is a network monitoring add-on that will identify the supporting infrastructure that delivers on-premises or cloud-based applications.
Whichever option you go for, you will get an auto-discovery module. This automatically maps your network topology and logs all of the devices connected to the system. You are allowed up to 1,000 network devices, but with both of the paid services, the number of devices you can have is unlimited.
The monitoring doesn’t just limit itself to standard network equipment, terminals, and printers. It will also monitor power supplies, server racks, ports, fans, and fabric cards.
The network monitoring system is based on SNMP. This is great because it means that you get automatic compatibility with all new equipment currently manufactured with network connectors. SNMP alerts provide device failure notification that feeds directly into the dashboard. Traffic flows around the network are monitored by NetFlow.
Whether you choose to use the onsite system or the cloud-based version of Zenoss’s LAN monitoring service, the dashboard is web-based, which means that it can be accessed from any GUI operating system. You can extend the capabilities of Zenoss to cover multiple sites and institute remote monitoring by installing data collectors on each site.
The standard monitoring software can be expanded by ZenPacks. These are notification add-ons that cater to specific hardware produced by a range of well-known equipment manufacturers. You don’t need to install all of the available ZenPacks. However, knowledge of the existence of a ZenPack for a specific device will make it easier to buy new equipment for your multi-vendor environment.
Who is it recommended for?
As it is very application-centric, Zenoss is not the first choice for network managers. If your system is reliant on cloud-based SaaS packages both to serve your office users and customers, then Zenoss is a good choice. The company recently discontinued its free version, which was called Zenoss Core, or the Zenoss Community Edition. That removal of a free option makes Zenoss less appealing to small businesses.
During our testing, we identified the following pros and cons related to Zenoss.
Pros:
- NetFlow Sensor: Tracks traffic patterns
- Alerts: The system gathers hardware notifications and consolidates them
- Network Device Status Monitoring: Uses the Simple Network Management Protocol
Cons:
- No On-Premises Version: The free Zenoss Core has been dropped
All flavors of the Zenoss network monitoring software include server and storage monitoring functions and they all also include IP address management functions.
12. Dynatrace
Dynatrace is different to all of the other network monitoring systems on this list. It focuses on the performance of network connections rather than on the statuses of devices connected to the network. The graphical representations of the network are stunning and they can highlight where physical cabling got overcomplicated, giving you an overview of how you can better lay out your network.
When we tested Dynatrace we found the following key features.
Key Features:
- Full Stack Observability: Monitors networks, endpoints, and software
- AI-Based: Provides predictive alerts
- Part of an Infrastructure Monitoring Package: Checks on virtualizations and connection software
Why do we recommend it?
Dynatrace keeps evolving and it is becoming more intensively a cloud services analyzer and an application performance monitor for Web applications. This move makes the network monitoring element in the platform less prominent. However, it is still included and it will examine the performance of internet links as well as LAN activity.
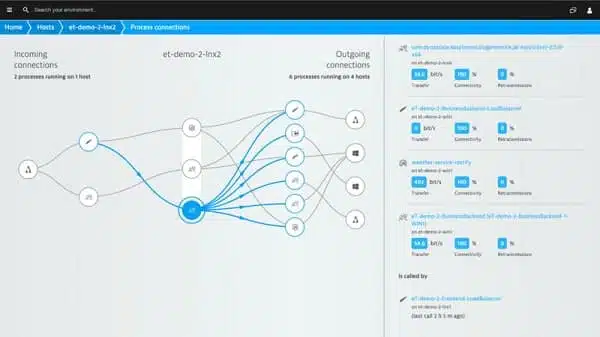
The real-time network monitoring extends to virtual environments. As with the physical network, Dynatrace will discover your connections and map them. The layout of the virtual environment shows you how much traffic each of your virtual machines attracts, giving you a better chance of right-sizing capacity. The nodes mapped as part of the virtual environment can also include any cloud services that your business employs.
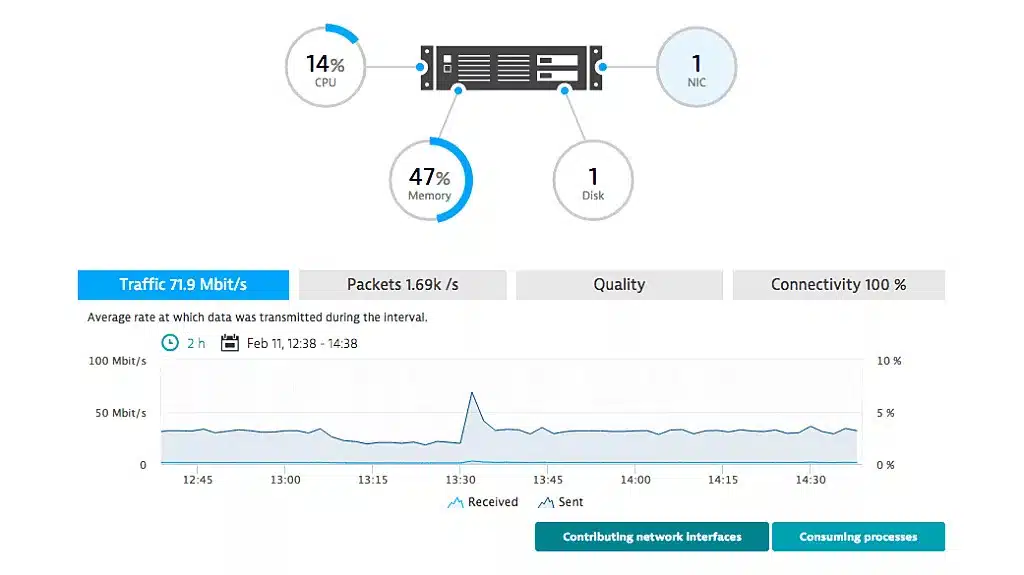
Dynatrace analyzes network traffic at the process level. You will be able to see which processes use the most resources and which aspects of your infrastructure are being strained. Apart from network resources, Dynatrace presents server utilization metrics, including memory, disk, and CPU usage.
The Dynatrace system would be ideal for online businesses. You can track application performance and see how each user’s activities ripple through to software activation, process network activity, and resource usage. The representations of network activity rely heavily on mapping. This is a fairly unique approach to network performance monitoring and is very effective. The focus on process flows rather than equipment performance makes this more of a network analyzer rather than a straightforward monitor.
Who is it recommended for?
Although this review is concerned with LAN monitoring tools, Dynatrace is more appealing to those who are looking for a monitor to track the performance of Web applications. You will get network and internet link analysis as part of that effort.
During our testing, we identified the following pros and cons related to Dynatrace.
Pros:
- Path Analysis: Examine the weak points in data delivery
- Connection Testing: Uses Ping to check on device availability
- Web Monitoring: Checks on Web response times
Cons:
- Application Monitoring: Emphasizes application monitoring over network monitoring
If you looked at the other network monitors on this list and decided that they don’t really give you the details on flows of data that you were looking for, then Dynatrace is probably the answer to your problem.
13. ConnectWise Automate
ConnectWise produces a range of networking services and its network monitoring system is called Automate. This cloud-based solution is aimed at small and mid-sized businesses. The company doesn’t publish its prices on its website. Instead, you have to contact a sales representative to negotiate a quote. The secretive pricing method can be a little off-putting for entrepreneurs.
When we tested Automate we found the following key features.
Key Features:
- Remote Monitoring and Management: Provides tools for support technicians
- Full Stack Observability: Monitors networks, endpoints, cloud systems, and software
- Network Discovery: Creates a network inventory and topology map
Why do we recommend it?
ConnectWise Automate is a remote monitoring and management package. Its remit includes network monitoring and all of its IT asset management capabilities implement task automation as much as possible. This system provides asset discovery and inventory creation for network devices and endpoints and then implements automated network activity scanning alongside software and server management.
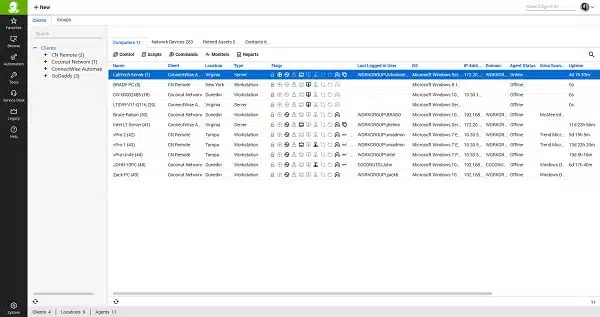
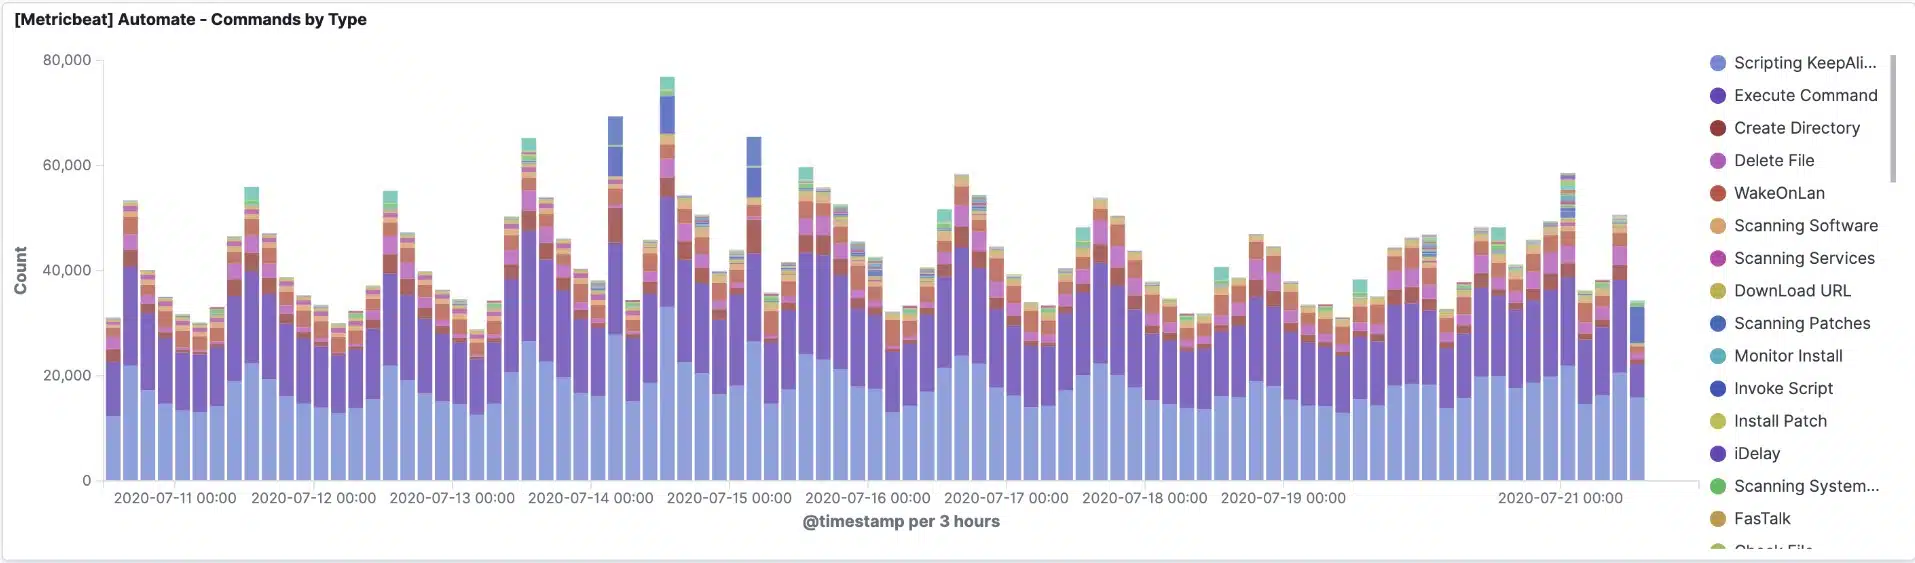
The Dashboard offers several view formats for your data, so you can just watch plain lists of events or get graphical displays of live data.
The Automate name explains the operating methodologies of the package. The idea is that this monitoring system will do everything for you, including network discovery and user tracking. A number of extra features enable you to run a lot of network administration tasks on auto-pilot. For example, version control is not normally a function expected of a network monitoring system. However, Automate includes a patch management tool, which logs all of the versions of the software on your system and enables you to update all of it from one central location.
ConnectWise Automate is not limited to a single site. The software is able to serve an MSP’s multiple clients and their many networks. Automate can monitor multiple locations based on an IP range as well as incorporate subnets of those client networks.
Who is it recommended for?
ConnectWise always marketed Automate as a solution for IT departments and managed service providers. However, now the business has an extra product called ConnectWise RMM, which is marketed to MSPs, while Automate is now almost exclusively presented as a tool for use by in-house IT support, or Service Desk teams. This is a complex solution for large businesses that operate a central support team to serve multiple sites.
During our testing, we identified the following pros and cons related to Automate.
Pros:
- Alerts: Notify performance problems and broken equipment
- Performance Scanning: Uses the Simple Network Management Protocol
- VM Monitoring: Tracks virtualizations as well
Cons:
- Stronger on Endpoint Management: Network monitoring isn’t the focus of the package
Remote management tools, such as ConnectWise Control, are included with the purchase of ConnectWise Automate. This could be a good solution for a software or IT service provider because it gives your IT department full user support capabilities, not just a network monitoring software.
14. Zabbix
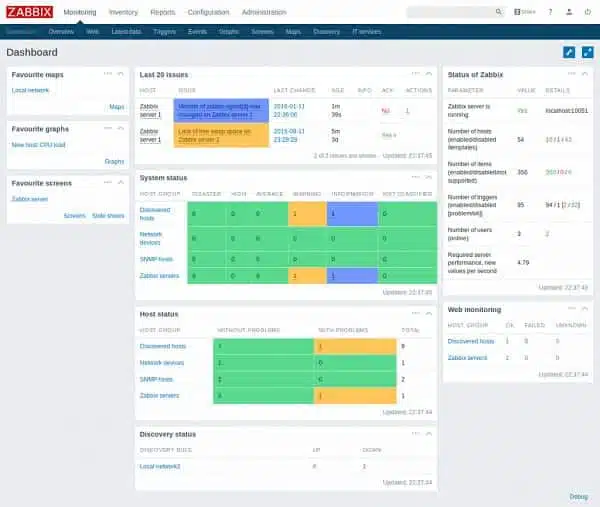
Zabbix is another open-source system. A benefit of open-source software is that anyone can produce add-ons. The core program is available for free and so are most of the add-ons.
When we tested Zabbix we found the following key features.
Key Features:
- Free to Use: Not a free trial
- Full Stack Observability: Monitors networks, endpoints, and software
- Network Discovery and Device Tracking: Uses the Simple Network Management Protocol
Why do we recommend it?
Zabbix is a reliable and impressive full-stack monitoring tool that covers networks, endpoints, and applications. The network monitoring module of the system is based on SNMP and provides autodiscovery of devices and it also creates a hardware inventory. The discovery process moves up to identify each endpoint and its software inventory. A nice feature of Zabbix is that it is one of the few remaining on-premises packages that combine network device monitoring with traffic analysis features.
Despite being free, the dashboard has a very professional look to it. You can switch out elements of the dashboard to get your most important information visible in the most prominent areas of the screen. Dashboard features include lists of live event data, graphs, and color-coding to make important information instantly recognizable.
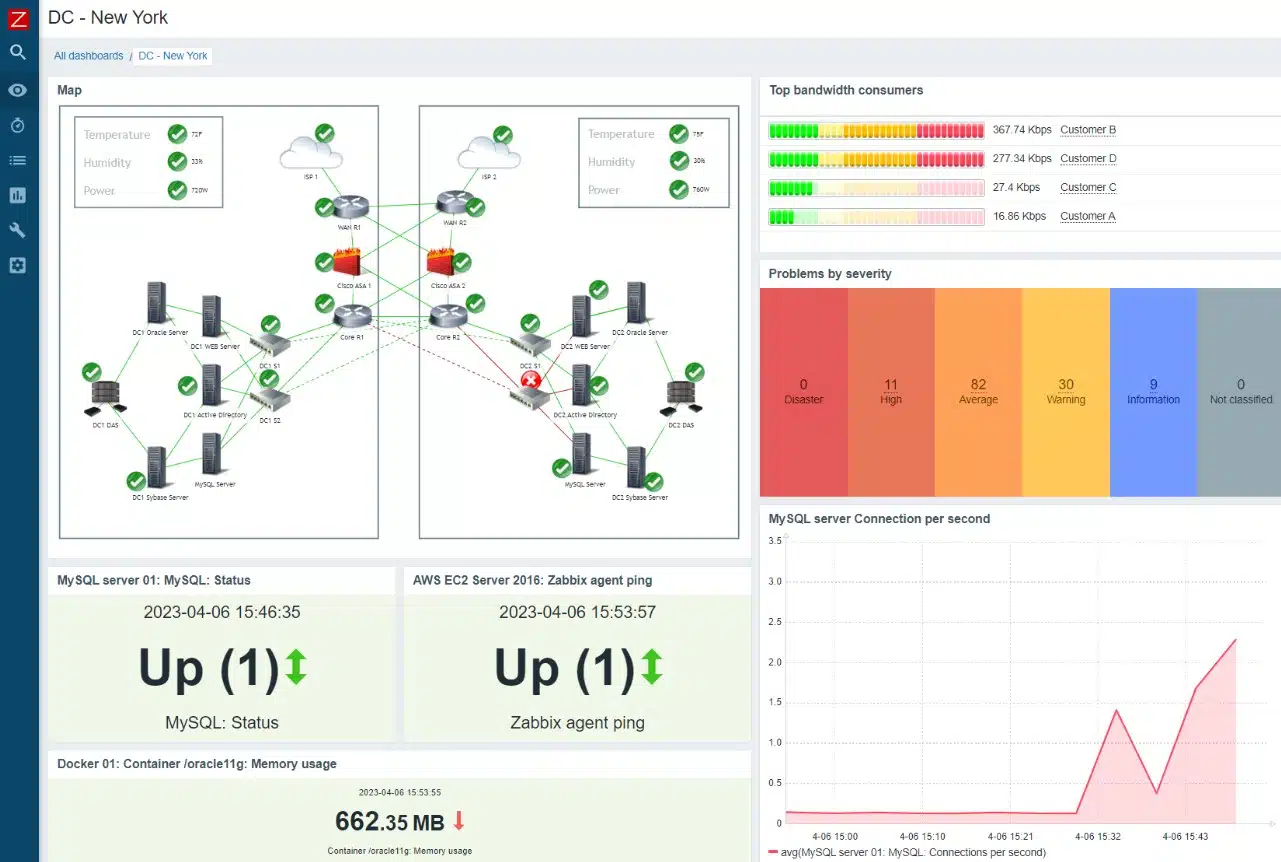
The real-time network monitoring module of Zabbix relies on SNMP, so you will be able to benefit from the device agents that your equipment already has installed by its manufacturers. The Zabbix system can monitor cloud services, application performance, hardware such as racks and UPS, and servers. The system can also implement remote monitoring if you have other sites that you want to manage centrally.
There isn’t a pre-written reporting module with Zabbix, but you can create your own custom reports and look for report formats written by others on the community forums of the Zabbix website.
A weakness in many networking protocols is that they operate at lower levels in the protocol stack, which makes encryption difficult. Zabbix includes an encryption layer, which locks out wiretappers and snoopers and enables monitoring data to securely pass through the network. The encryption system makes authentication procedures available so you can create different permission levels for access to the data available in the dashboard of the network monitor.
Who is it recommended for?
Zabbix is a free tool, which makes it appealing to small businesses but it is also sufficiently comprehensive to be suitable for use by large businesses – its client list includes Altice, Dell, and SEAT. This used to be one of the best free tools for monitoring networks. However, over the years, the free-to-use competitors to the service have disappeared. Leaving Zabbix as a leader in an increasingly small field.
During our testing, we identified the following pros and cons related to Zabbix.
Pros:
- Traffic Metrics: Shows link capacity and utilization
- Alerts for Problems: Notifications for traffic irregularities and equipment failure
- Connection Testing: Troubleshooting with Ping
Cons:
- Professional Support for a Fee: Not free
Zabbix is aimed at small and middle-sized businesses, so if you are just starting out, this free network monitoring solution would be ideal for you.
Open-source Network Software
The concept of open-source software is becoming more common in networking technology. This is because proprietary, closed-source systems could cloak malware and so network owners tended to gravitate towards the big software providers such as Microsoft and Cisco. However, larger corporations have been proven on occasion to be not entirely trustworthy.
An example of this situation was unearthed during the Edward Snowden revelations into spying by the National Security Agency (NSA) on American citizens. It was revealed that Microsoft had built a back door into its encryption for Skype, enabling it to provide the NSA with details of private conversations.
So, the open-source movement is seen as a positive solution to software security. You might think that allowing every hacker in the world access to the source code of network software would give them time to work out how to crack it and break into your network. However, open-source software for security-sensitive applications generally includes tried and tested authentication procedures that no one can crack. Essentially, the open-source model relies on a thorough approach to security rather than expecting that secrecy will suffice.
Open-source network monitors can provide small businesses with good entry-level access to network management software for free.
Selecting LAN monitoring software
If you run a small business and you need to start buying monitoring software for your expanding network, then take a look at some of the open-source options listed in this guide. If you want a top-quality system that will keep monitoring network activity as your business expands, then SolarWinds, OpManager, and Paessler PRTG would probably be your best options. Take a look at the other monitoring systems in our list, such as Dynatrace to discover some unique features that might suit your overall network monitoring strategy better than the leaders of the pack.
Selecting LAN monitoring software can be a time-consuming task because there are so many contenders in the market. Thanks to this guide, you can now limit your search to just the top ten LAN monitoring tools.
LAN Monitoring FAQ
What can affect network performance?
The three main causes of network performance problems are excessive traffic, damaged equipment, and addressing errors.
- If the amount of traffic that needs to pass through a network device exceeds that device’s throughput capacity, packets will be queued.
- If the queue gets full, packets will get dropped. In the case of TCP communication, the failure to receive an acknowledgment for a packet causes it to be re-sent.
- This increases the amount of traffic on the network, slows down the receiving application, and causes services and software to hang.
- Loose hardware connectors can also cause network traffic problems. If these connectors function some of the time, it makes the problem harder to spot than a node that is completely broken and creates a network dead-end.
Not addressing these problems can cause packets to be dropped and can even prevent some devices from communicating at all.
Good research. personally used Pandora NMS. I think it is mostly reliable.
Thank you to share this article.
I suggested to get back – 5 Lan Network Monitoring Software | Ares Group
# Buena investigación. usó personalmente Pandora NMS. Creo que es mayormente confiable.
Gracias por compartir este articulo
Sugerí volver – 5 Lan Network Monitoring Software | Ares Group