![]()
Prevent port connection issues by port monitoring with PRTG
- Query the port status such as open/closed or up/down
- Keep an eye on connections using UPD and TCP protocols
- Monitor bandwidth & traffic via SNMP, NetFlow & packet sniffing
Our users give top ratings for monitoring with Paessler PRTG


Port monitoring: What you’ll find on this page
- Why PRTG is the port monitoring solution of your choice
- What port monitoring looks like in PRTG
- 5 use cases where port monitoring with PRTG helps you out of trouble
- Discover some of our preconfigured PRTG sensors for monitoring your ports
- 5 use cases where port monitoring with PRTG helps you out of trouble
- Hardware ports that you should keep an eye on
- Port monitoring: FAQ
PRTG makes port monitoring easy
Custom alerts and data visualization make it easy to monitor, identify, and prevent port connection issues.
Why PRTG is the port monitoring solution of your choice
![]()
Keep an eye on possible port security issues
Open ports put your network at risk as they are an entryway for trojans and other malware. It takes a lot of effort to manually check which ports are open or closed.
Often, ports are opened temporarily for individual applications and then forgotten. In such cases, Paessler PRTG checks if TCP/IP ports are open and alerts you in case of an issue.
![]()
Get insights into the traffic on your ports
Our PRTG port monitoring software helps you monitor the traffic that runs through your routers and switches, as well as the amount of bandwidth that is consumed.
Set up our preconfigured sensors for port traffic monitoring using various technologies such as SNMP, flow protocols (NetFlow, IPFIX, jFlow, and sFlow), and packet sniffing.
![]()
Check packet delays and packet losses
You can monitor both TCP and UDP packets with PRTG.
This way, you can identify packet delays or packet losses immediately, along with their impact on the quality of service.
In addition, it is possible to monitor the connectivity of TCP ports and their response to specific commands.
![]()
Monitor multiple ports across devices
PRTG is designed to monitor multiple ports across several devices simultaneously.
You can add sensors for various ports on different devices and view their status on the centralized PRTG dashboard.
This gives you a comprehensive view of the network's health and helps in identifying potential issues that might affect multiple devices or connections.
![]()
Receive instant alerts on unusual port activity
In PRTG, you can set up notifications based on various conditions.
You can configure the system to alert you via email, SMS, push notifications, or even execute HTTP actions if a monitored port goes down or experiences unusual activity.
This helps to immediately identify and address potential issues before they escalate.
![]()
Generate custom reports on port monitoring data
With the reporting feature in PRTG, you can easily generate detailed reports on port activity over specified time periods.
Customize the report using various settings and filters to focus on the port data that is most relevant for your needs.
Once generated, you can view the reports online or export them in various formats.
What port monitoring looks like in PRTG
Diagnose connection issues by continuously monitoring different ports in your network. Show port status in real time and visualize port monitoring data in graphic maps & dashboards to identify problems more easily. Gain the visibility you need to troubleshoot all kinds of port connection issues.

Device tree overview of a PRTG monitoring setup
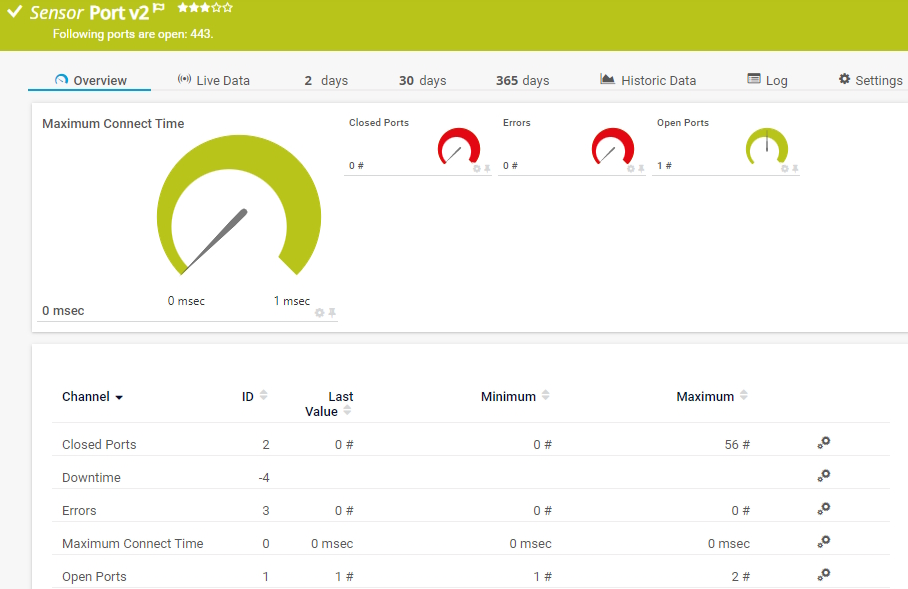
Port v2 sensor (beta) in PRTG
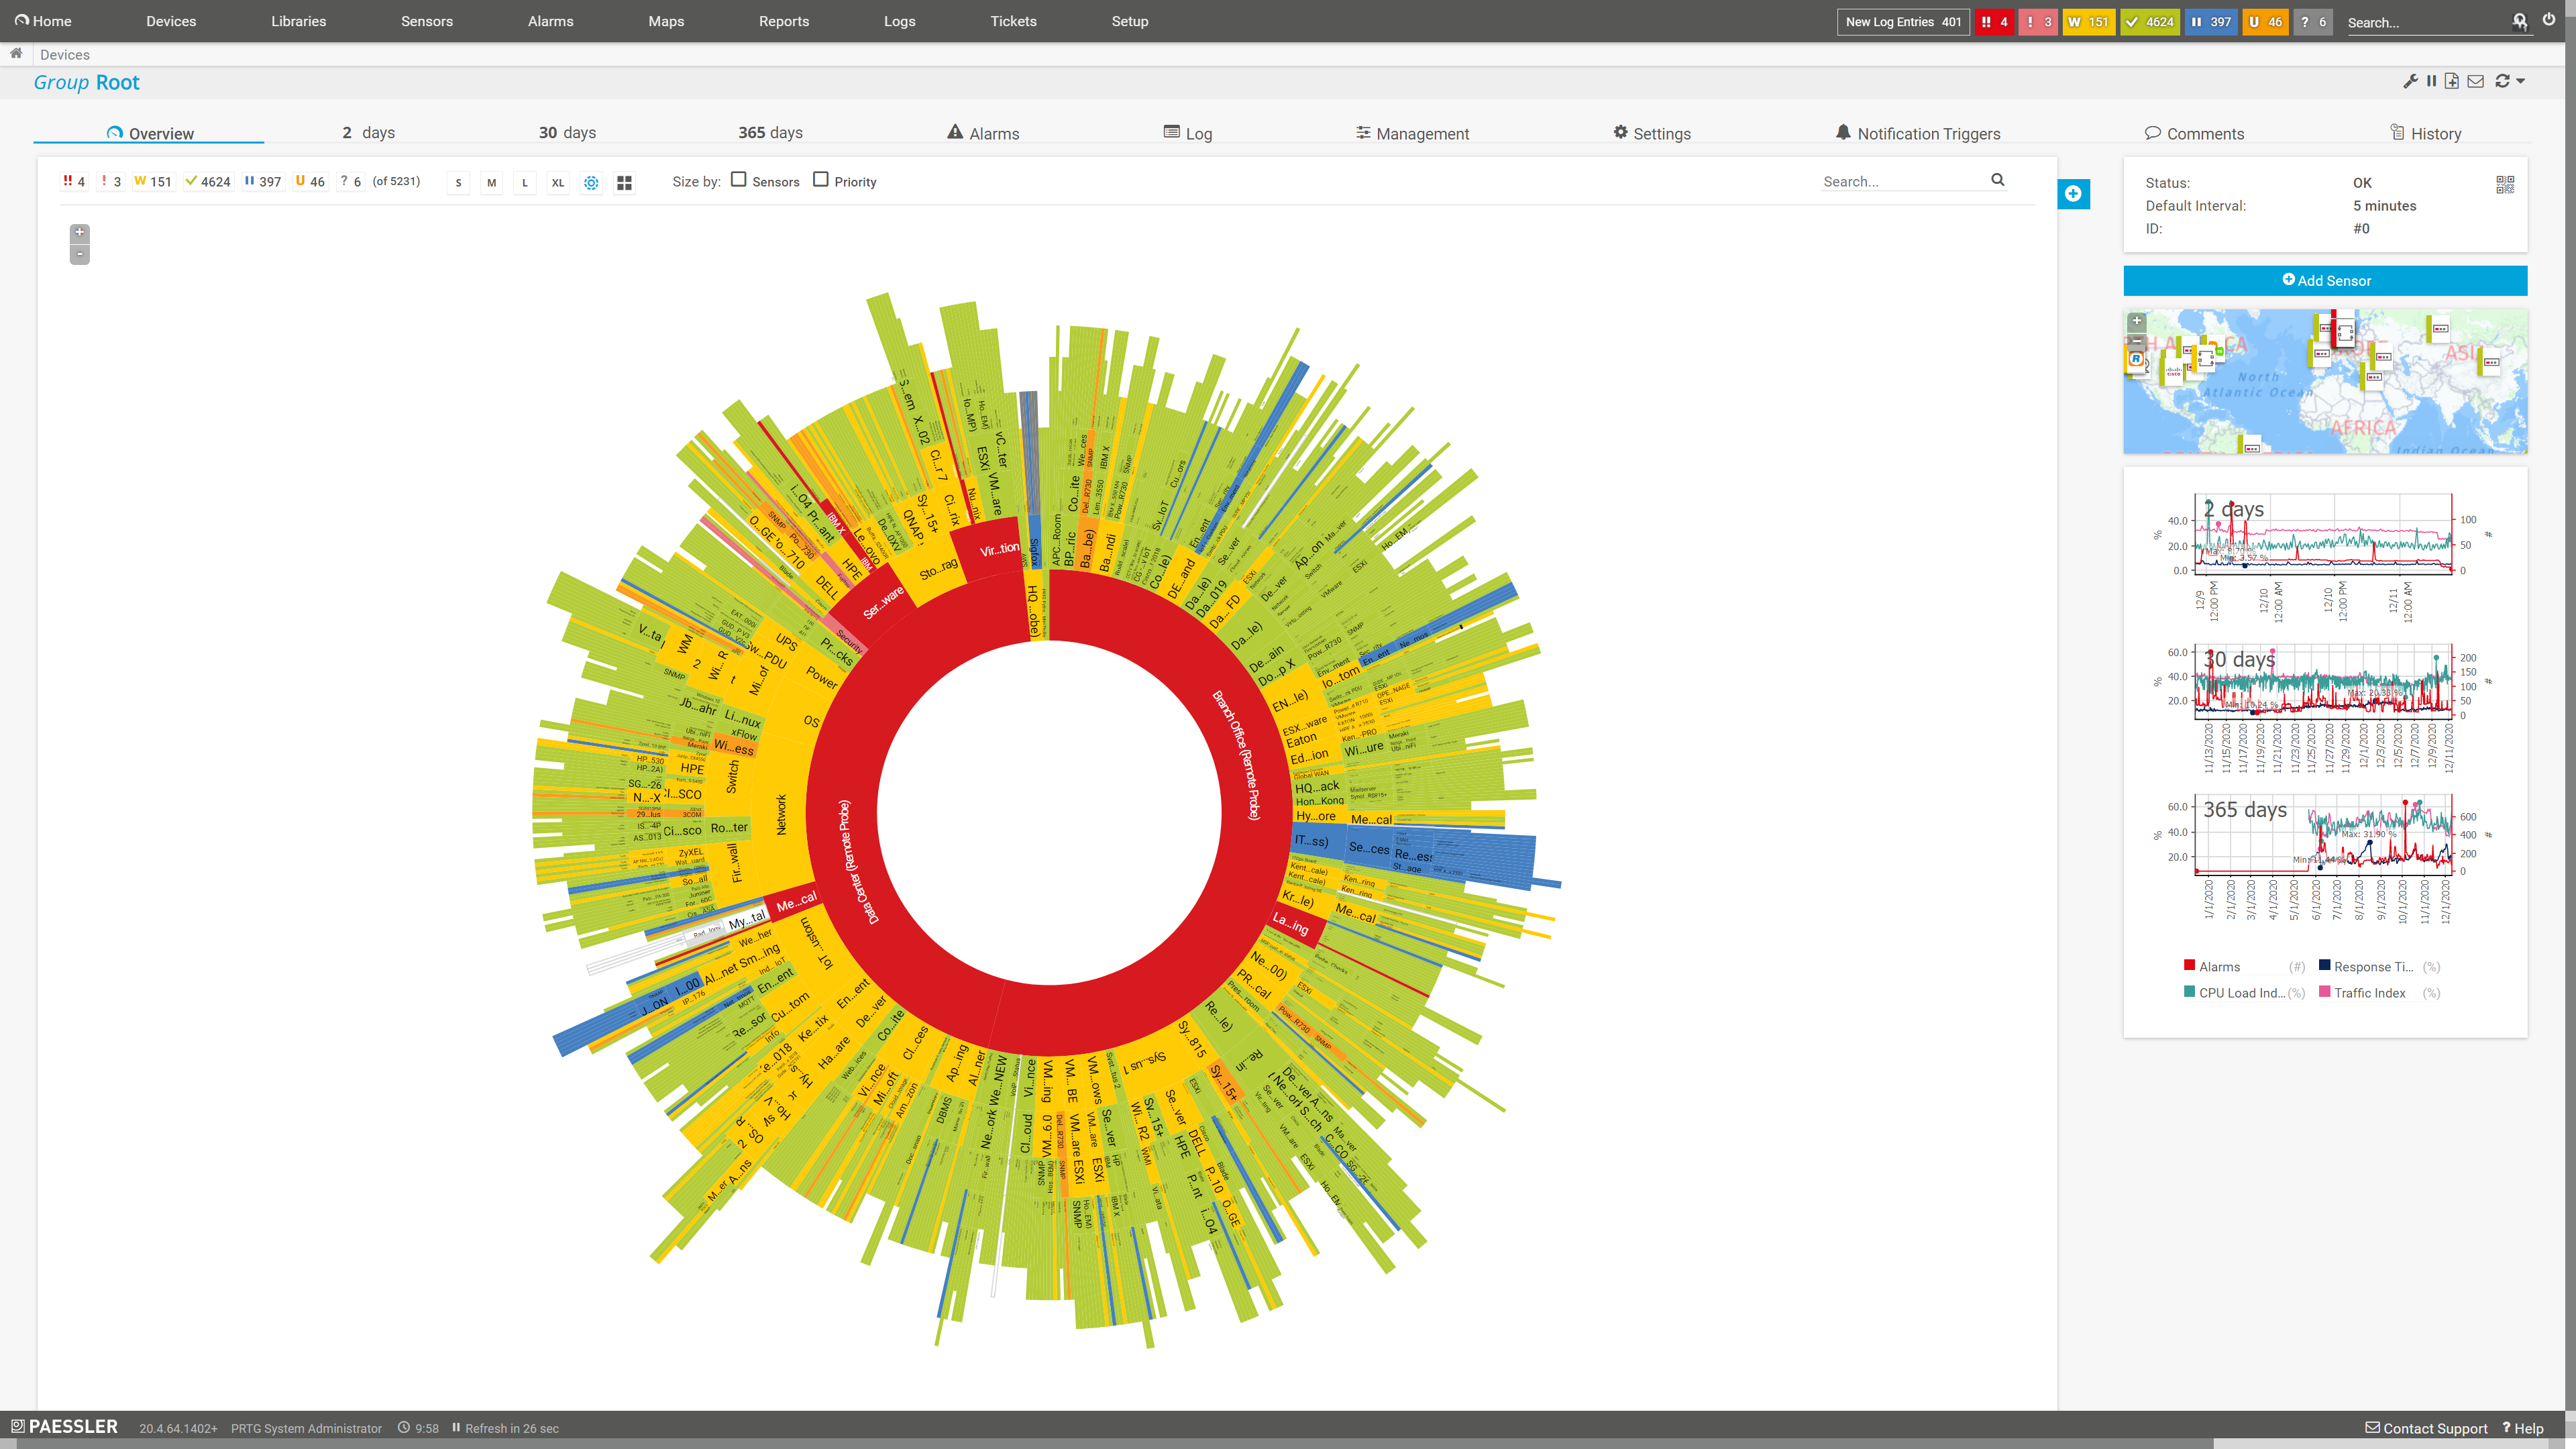
Sunburst view of a PRTG monitoring setup
Start monitoring all kinds of ports with PRTG and see how it can make your network more reliable and your job easier.
“All-around winning “The real beauty of PRTG is the endless possibilities it offers” “Outstanding cloud IT experts agree: Paessler PRTG is a great solution for IT infrastructure monitoring

network monitor”

monitoring”
Discover some of our preconfigured PRTG sensors for monitoring your ports
![]() How PRTG defines sensors
How PRTG defines sensors
In PRTG, “sensors” are the basic monitoring elements. One sensor usually monitors one measured value in your network, e.g. the traffic of a switch port, the CPU load of a server, the free space of a disk drive. On average you need about 5-10 sensors per device or one sensor per switch port.
Port sensor
The Port sensor monitors a network service by trying to connect to the specified TCP/IP port number of a device and waiting for the request to be accepted. It shows the time until a request to a port is accepted.
Port v2 sensor (beta)
The Port v2 sensor (beta) monitors a network service by connecting to one or more of its TCP/IP ports. It shows the number of open and closed ports, the number of errors, and the maximum time until a request to connect to a port was accepted.
Port Range sensor
The Port Range sensor monitors a network service by connecting to various TCP/IP ports. It tries to connect to the specified TCP/IP port numbers of a device in succession and waits for the device to accept each request. It shows the number of open and closed ports and the time until a request to a port is accepted.
SSL Security Check sensor
The SSL Security Check sensor monitors SSL/TLS connectivity to the port of a device. It tries to connect to the specified TCP/IP port number using different SSL/TLS versions and shows if the device supports a particular protocol. It also shows an overall security rating of the monitored device.
5 use cases where port monitoring with PRTG helps you out of trouble
- Enhance your network security by blocking or deactivating unused ports.
- Easily detect overloaded parts of your network by measuring bandwidth and traffic.
- Visualize the coherences in your network. Sometimes the problem is not a defective port, but the cable.
- Instantly pinpoint the reasons for shaky connections in your network.
- Strengthen your security by recognizing unauthorized physical access to your network
Easily find the source of the problem with our PRTG port monitoring solution
Real-time alerts and custom notifications make it easy to solve issues with port monitoring.
PRTG is compatible with all major vendors, products, and systems
![]()
Hardware ports that you should keep an eye on
Switch ports
Switches are often bottlenecks and the failure of a single switch can impact an entire network. With switch port monitoring, you can see at a glance how much traffic runs through your switch.
Router ports
How many router ports are currently in use and how many are still free? How high is the bandwidth load? With continuous router port scans, you can identify early on when ports reach their capacity.
Server ports
Servers are at the heart of any IT infrastructure. If a server port fails, this can be felt in the whole network immediately. With PRTG, you can monitor your servers as well as your server ports.
Start monitoring all kinds of ports with PRTG and see how it can make your network more reliable and your job easier.
Your port monitor at a glance – even on the go
Set up PRTG in minutes and use it on almost any mobile device.


Create innovative solutions with Paessler’s partners
Partnering with innovative vendors, Paessler unleashes synergies to create
new and additional benefits for joined customers.


PRTG makes port monitoring easy
Custom alerts and data visualization make it easy to monitor, identify, and prevent port connection issues.
“Excellent tool for detailed monitoring. Alarms and notifications work greatly. Equipment addition is straight forward and server initial setup is very easy. ...feel safe to purchase it if you intend to monitor a large networking landscape.”
Infrastructure and Operations Engineer in the Communications Industry, firm size 10B - 30B USD
Port monitoring: FAQ
1. What is a port?
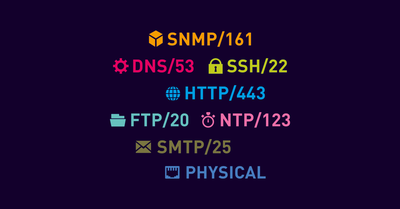
A port is a part of the network address and ensures the proper distribution of connections and data packets. Valid port numbers range from 0 to 65535. Many applications use typical or standardized ports like FTP (port 20), SMTP (port 25), and SNMP (port 161). These ports are used primarily by protocols such as the Transmission Control Protocol (TCP) and User Datagram Protocol (UDP).
2. What are common port protocols?
The Transmission Control Protocol (TCP) is the most commonly used protocol to send packets. It operates in a connection-oriented manner and requires the establishment of a connection between a client and server before any data can be sent. The server needs to be in a listening state (referred to as passive open) to accept connection requests from clients. the resulting load is higher than with UDP. There are standardized ports for TCP.
The User Datagram Protocol (UDP) is a connectionless protocol. There is no sequential numbering and it generates much less load. Therefore, UDP is more economical, but also more prone to errors. The UDP protocol is often used for applications where packet loss is not that important. There are also standardized ports for UDP.
3. How does Paessler PRTG help me with port monitoring?
Paessler PRTG is a comprehensive network monitoring tool that helps administrators keep an eye on the health and performance of their networks. In the context of port monitoring, PRTG can monitor the status and activity of network ports on various devices, helping to identify potential issues such as traffic bottlenecks, unauthorized access, or malfunctioning ports. It can monitor ports on switches, routers, and other network devices to ensure optimal network performance.
4. What is the difference between port monitoring and a port sniffer?
Port monitoring is a network management technique that is used to analyze traffic on specific ports and to determine whether ports are open or closed for maintaining network security and performance.
A port sniffer is a tool or software that captures and analyzes data on network ports. It is commonly used for network diagnostics and troubleshooting. While port monitoring offers a broader range of functionalities including security features, a port sniffer focuses more on detailed data packet analysis and can be used for specific investigations or audits.
5. How does port mirroring work with PRTG?
Port mirroring is a network technique that allows you to copy or mirror the network traffic from one network port (or multiple ports) and send that copy to another port on the same network switch. In PRTG, port mirroring is used by the Packet Sniffer sensor to monitor header traffic.
6. Which ports does PRTG use?
PRTG requires several ports to be open and reachable on your system for full functionality. Here you can find a first overview:
- LDAP port for Active Directory integration: 389 (unsecure), 636 (secure)
- Auto-update and activation: 443
- Communication between cluster nodes: 23570
- Incoming remote probe connections: 23560
- Notifications: 443 (push), 25 (SMTP), 162 (SNMP trap), 514 (Syslog)
- PRTG application server and PRTG core server: 23580
- PRTG web server: 443 (secure), 80 (unsecure); fallbacks: 8443 and 8443+ (secure), 8080+ (unsecure)
- Report generation (PDF): 8085
- Update check and download: 80
7. What is a sensor in PRTG?
In PRTG, “sensors” are the basic monitoring elements. One sensor usually monitors one measured value in your network, for example the traffic of a switch port, the CPU load of a server, or the free space on a disk drive.
On average, you need about 5-10 sensors per device or one sensor per switch port.

PRTG: The multi-tool for sysadmins
Adapt PRTG individually and dynamically to your needs and rely on a strong API:- HTTP API: Access monitoring data and manipulate monitoring objects via HTTP requests
- Custom sensors: Create your own PRTG sensors for customized monitoring
- Custom notifications: Create your own notifications and send action triggers to external systems
- REST Custom sensor: Monitor almost everything that provides data in XML or JSON format
More than just a monitoring tool:
Reasons our customers love PRTG


Paessler PRTG is used by companies of all sizes. Sysadmins love PRTG because it makes their job a whole lot easier. Bandwidth, servers, virtual environments, websites, VoIP services – PRTG keeps an eye on your entire network. Everyone has different monitoring needs. That’s why we let you try PRTG for free.Still not convinced?
![]()
More than 500,000
sysadmins love PRTG![]()
Monitor your entire IT infrastructure
![]()
Try Paessler PRTG
for free
![]()
Start monitoring all kinds of ports with PRTG and see how it can make your network more reliable and your job easier.
|
PRTG |
Network Monitoring Software - Version 24.2.94.1400 (April 10th, 2024) |
|
Hosting |
Download for Windows and cloud-based version PRTG Hosted Monitor available |
Languages |
English, German, Spanish, French, Portuguese, Dutch, Russian, Japanese, and Simplified Chinese |
Pricing |
Up to 100 sensors for free (Price List) |
Unified Monitoring |
Network devices, bandwidth, servers, applications, virtual environments, remote systems, IoT, and more |
Supported Vendors & Applications |
|
Combining the broad monitoring feature set of PRTG with IP Fabric’s automated network assurance creates a new level of network visibility and reliability.