![]()
All-in-one uptime monitoring
with PRTG Network Monitor

Check the uptime of all your servers: FTP server, mail server, DNS server, SQL server,
virtual servers
PRTG monitors your
website availability
Determine causes
of crashes
PRTG offers a comprehensive report system including statistics, charts, and much more
Uptime monitoring with PRTG
Definition: What does uptime mean for IT networks?
The term "uptime" is used in IT to define the period of time in which a computer system is functional and available. When referring to a network, uptime is defined in terms of the availability and reliability of servers and devices, or by domain and website availability. Most of the time, availability is displayed as a percentage. An availability of 90% measured over the course of a day means the system was functional and available for exactly 1296 minutes (21.6 hours) on that particular day.
Ensure a working IT environment with uptime monitoring
The goal of uptime monitoring with PRTG is to guarantee smooth running of all your services. Whether it be your hardware devices, your servers, your CDN or your websites - you can keep an eye on the availability of your entire IT environment.
If any of your monitored services goes down, you get an instant alarm per email, SMS or push notification. This gives you the possibility to react before things get worse. Of course, your goal should be to get as close to 100 % uptime as possible. PRTG provides detailed statistics about network uptime and the availability of individual services.
Uptime monitoring: Why PRTG is the right choice
![]() How PRTG defines sensors
How PRTG defines sensors
In PRTG, “sensors” are the basic monitoring elements. One sensor usually monitors one measured value in your network, e.g. the traffic of a switch port, the CPU load of a server, the free space of a disk drive. On average you need about 5-10 sensors per device or one sensor per switch port.
![]()
Cost-free start up
There is a free trial version of PRTG. Take our network monitoring tool for a trial run and find out how you can use it monitor your uptime to prevent costly downtime.
![]()
One-stop monitoring
Many companies monitor using a number of disparate solutions. Couple this with all of the other in-house IT duties and you have a recipe for confusion and at times, disaster. But with PRTG, you get one central, comprehensive monitoring tool for ALL of your monitoring. PRTG is simple to set up, requires little bandwidth, and makes your day-to-day work easier.
![]()
Get straight to the causes
With PRTG, you'll enjoy an exhaustive view of your entire IT infrastructure. It not only keeps track of your uptime and downtime, but can also determine the causes of crashes. What is really behind the crash? The hardware, network connection, or a faulty configuration? Thanks to PRTG, you'll save time when troubleshooting.
![]()
Prompt notifications
A customizable notification system quickly sends off an alert by Email, SMS, or push notification so you can fix bugs before more serious problems arise. Don't wait to put out the fire, stop the fire starting!
![]()
Detailed reports
PRTG boasts an exhaustive report system with statistics, charts, and much more. Create customized reports and have them sent to your superiors automatically. Use these reports to see how and where you are saving resources.
![]()
Perfectly compatible
PRTG offers monitoring sensors - predefined measuring points - for practically every major device manufacturer, including Cisco, Dell, Oracle, and HP.
![]()
Public status pages
PRTG also allows you to automatically communicate outages of your website or services. Read here how to connect PRTG to statuspage.io and how to transmit information to a status page in the event of an IT system failure in real time.
![]()
Greater predictability
Monitoring with PRTG allows you to take total control. Take advantage of a reliable database to optimize load distribution. Or plan the expansion of your network.

Your goal: Use PRTG to near 100% uptime!
When it comes to uptime, only one percentage will do: 99.999! These "5 nines" are the badge of your network's high level of availability. PRTG can help you reach this ambitious goal. On this page, you'll discover the advantages of uptime monitoring with PRTG, the sensors we provide, and a few of our tips on network monitoring!
A quick glimpse into PRTG: uptime monitoring
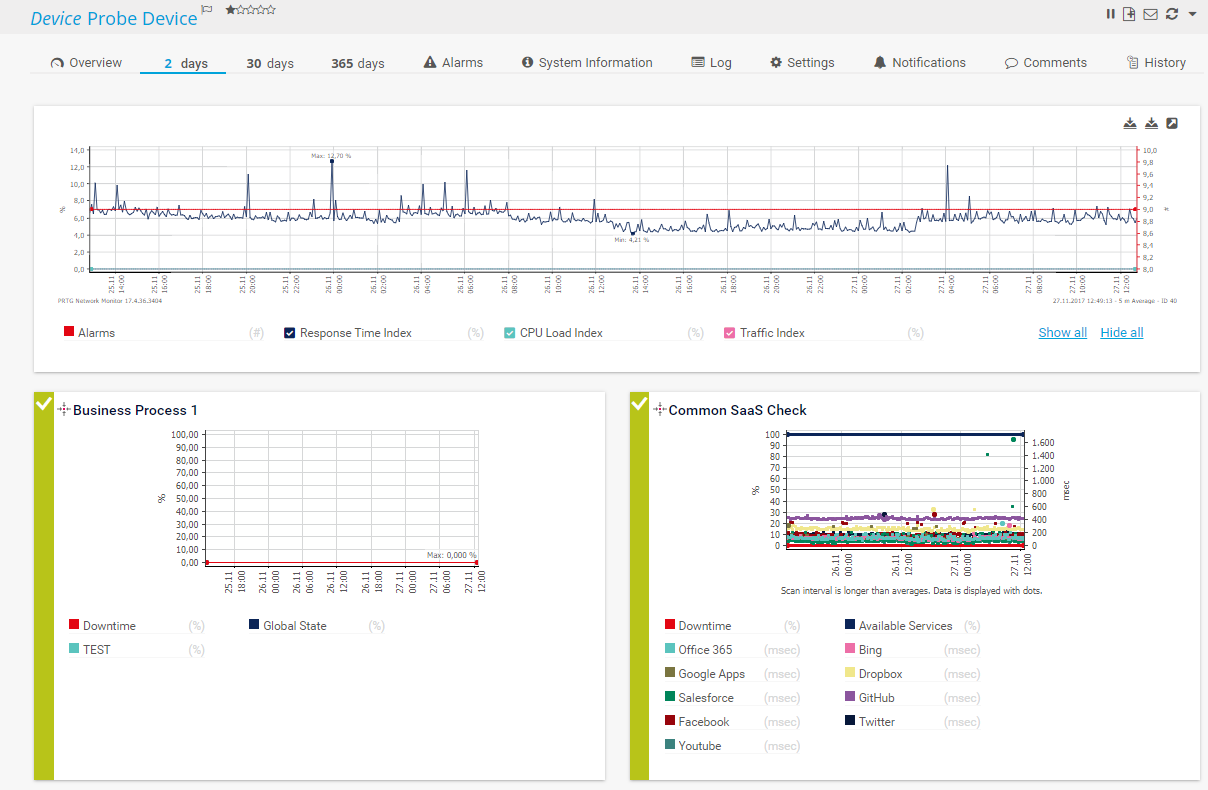
Monitoring sample graph for availability monitoring statistics

The PRTG Sunburst View
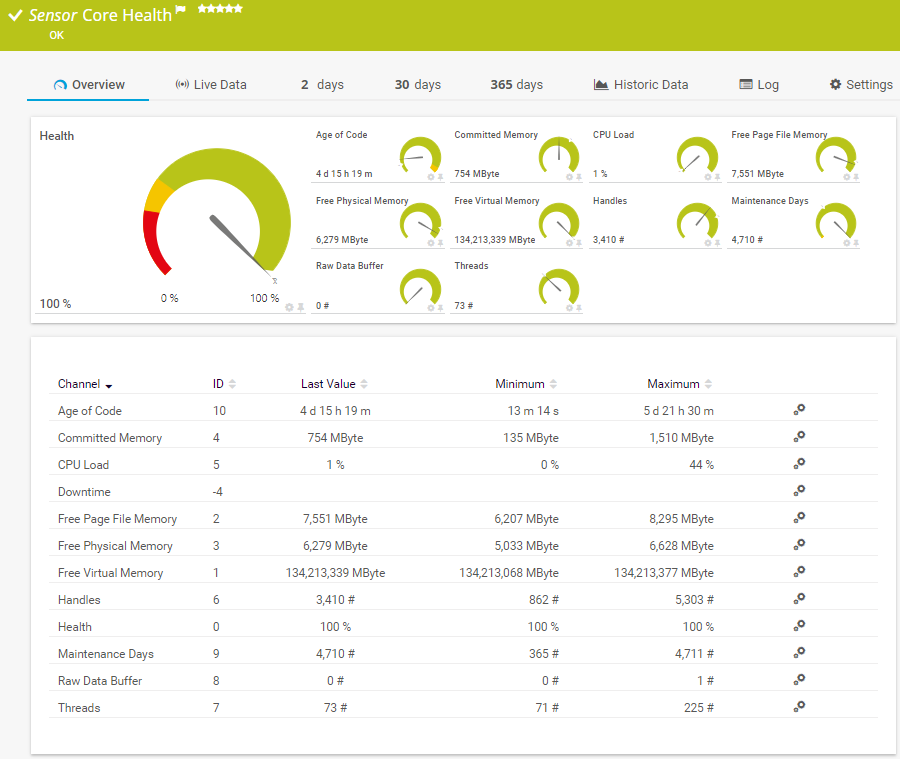
Core Health
Measuring uptime: Keep an eye on everything
![]()
Uptime of your servers
With PRTG, you can check the uptime of all your servers. Whether a FTP server, mail server, web server like IIS, DNS server, SQL server, or virtual servers such as VMware or Hyper-V, PRTG keeps track of everything. CPU load, memory, bandwidth, and many other parameters of your server performance are monitored by default. For more information, see our page on the availability of your servers.
![]()
Uptime of devices
When coworkers complain about their devices malfunctioning, many administrators embark upon a time-consuming search for the culprit. Is the bug in the network or in the user's device? With PRTG, you can check the functions of each individual device - whether it be a desktop computer, router, switch, or another network component. For more information, visit our page on hardware monitoring with PRTG.
![]()
Uptime of your websites
For many companies, website availability is an important factor in their sales performance. Every second a company is offline is a second when customers are unable to browse products or place orders. With PRTG, you'll not only monitor availability, speed, and database performance, but also the individual content of your website. When it comes to domain availability, the issues are often the same. With PRTG, website monitoring is easy.
We asked: would you recommend PRTG?
Over 95% of our customers say yes!
Paessler AG conducted trials in over 600 IT departments worldwide to tune its network monitoring software closer to the needs of sysadmins.
The result of the survey: over 95% of the participants would recommend PRTG – or already have.


“The support we received from Paessler AG was extremely reassuring. Their reaction time, know-how, and solutions were outstanding in every department.”
Andreas Reimann, Senior Networking Communication Architect at Zürich Airport. Zürich Airport uses more than 4,500 sensors for its monitoring
Trusted by 500,000 users and recognized
by industry analysts as a leader

“Fantastic network and infrastructure monitoring solution that is easy to deploy and easier still to use. Simply the best available.”

“Software is absolutely perfect, Support is superior. Meets all needs and requirements, this is a must have solution if you are needing any form of monitoring.”

“The tool excels at its primary focus of being a unified infrastructure management and network monitoring service.”
PRTG makes your job easier
Our monitoring software frees you to focus on other tasks by promptly notifying you of potential issues.
![]()
Save effort
PRTG gives you one central monitoring tool for your servers and entire network. Enjoy a quick overview of your whole infrastructure via our dashboard and app.
![]()
Save time
Getting started with PRTG is a breeze. Setting up or switching from another network monitoring tool is easy thanks to the auto-discovery and pre-configured device templates.
![]()
Save money
80% of our customers report substantial cost savings with network monitoring. Your costs of licenses will likely pay for themselves within weeks.
Your uptime at a glance – even on the go
Set up PRTG in minutes and use it on almost any mobile device.


Practical tip: “Hey Arne, what would you tell administrators looking to use PRTG to monitor the uptime of their networks?”
“For sensor lists and reports, PRTG immediately sorts between uptime and downtime. Usually, the ping downtime sensor is all you’ll need to get a quick overview of what’s going on. Simply enter “pingsensor” and right away you’ll see where most of the problems in your network lie.”
Arne Seifert works in the Paessler AG support department.
Perfect sensors for uptime monitoring
![]() Ping is a command-line utility, available on virtually any operating system with network connectivity, that acts as a test to see if a networked device is reachable. The ping command sends a request over the network to a specific device. A successful ping results in a response from the computer that was pinged back to the originating computer.
Ping is a command-line utility, available on virtually any operating system with network connectivity, that acts as a test to see if a networked device is reachable. The ping command sends a request over the network to a specific device. A successful ping results in a response from the computer that was pinged back to the originating computer.
Read more
Ping v2 Sensor: The easiest way to check the uptime or availability of your network or your website is by using a Ping v2 sensor. Find out more about the Ping v2 sensor in the PRTG manual.
SNMP Uptime v2 Sensor: This predefined sensor will enable you to monitor uptime via SNMP and see how long a device has been running without interruption. SNMP uses little bandwidth and CPU and is therefore an ideal monitoring solution. Read more about the SNMP Uptime v2 Sensor.
Windows System Uptime Sensor: With this sensor, you can monitor uptime via Windows Performance Counters or WMI (Windows Management Instrumentation) and see how long a Windows-based computer has been running without interruption. For more information, check out the Windows System Uptime Sensor. While this sensor is well-suited for Windows devices, it tends to have a greater effect on your system's performance than SNMP.
Other sensors: Our PRTG sensor list contains more than 250 predefined sensors. Sensors for servers, bandwidth, applications...the selection is vast and constantly being updated by the PAESSLER team.
Use our Smart Setup! PRTG automatically begins creating sensors right from the time it is being configured. By pinging a private IP range, PRTG lets you get started with uptime monitoring simply by opening the monitoring tool for the first time.
Create innovative solutions with Paessler’s partners
Partnering with innovative vendors, Paessler unleashes synergies to create
new and additional benefits for joined customers.


ScriptRunner
With ScriptRunner, Paessler integrates a powerful event automation platform into PRTG Network Monitor.

Also interesting:
Packet Sniffing: PRTG analyzes data packets and displays the data packet loss rate. In the event a critical value is exceeded, you’ll automatically receive an alert.
Printer Monitoring: With PRTG you know the status of every printer. See detailed printer error messages at a glance and get informed if printer replacement is necessary.
Fortinet Monitoring: Check the status of your Fortinet products and get alerts as soon as your Fortinet solution
identifies a security risk.
Website Monitoring: Is your website available? Are all its key processes operational? Are its load times increasing? With PRTG, you can monitor the status of your website from different locations with the HTTP v2 and Cloud HTTP v2 sensors. The same goes for your servers and entire IT infrastructure.
“Easy to implement and configure with good technical support.”
R. v. S., ICT Manager at Heinen & Hopman Eng BV

PRTG: The multi-tool for sysadmins
Adapt PRTG individually and dynamically to your needs and rely on a strong API:- HTTP API: Access monitoring data and manipulate monitoring objects via HTTP requests
- Custom sensors: Create your own PRTG sensors for customized monitoring
- Custom notifications: Create your own notifications and send action triggers to external systems
- REST Custom sensor: Monitor almost everything that provides data in XML or JSON format
Still not convinced?
![]()
More than 500,000 sysadmins love PRTG
Paessler PRTG is used by companies of all sizes. Sysadmins love PRTG because it makes their job a whole lot easier.
Still not convinced?
![]()
Monitor your entire IT infrastructure
Bandwidth, servers, virtual environments, websites, VoIP services – PRTG keeps an eye on your entire network.
![]()
Try Paessler PRTG for free
Everyone has different monitoring needs. That’s why we let you try PRTG for free. Start now with your trial.
|
PRTG |
Network Monitoring Software - Version 24.2.94.1400 (April 10th, 2024) |
|
Hosting |
Download for Windows and cloud-based version PRTG Hosted Monitor available |
Languages |
English, German, Spanish, French, Portuguese, Dutch, Russian, Japanese, and Simplified Chinese |
Pricing |
Up to 100 sensors for free (Price List) |
Unified Monitoring |
Network devices, bandwidth, servers, applications, virtual environments, remote systems, IoT, and more |
Supported Vendors & Applications |
|
Combining the broad monitoring feature set of PRTG with IP Fabric’s automated network assurance creates a new level of network visibility and reliability.