![]()
PRTG makes monitoring your internet
connection both quick and easy

Keep a constant eye on
your internet connection
Be alerted immediately if the connection goes down
Check to make sure your provider is honoring the terms of your SLA
A stable internet connection is a must for nearly every business transaction. Glitches and slow transmission rates can have serious consequences for your business.
Is one of your internet services or web pages down, or are your emails simply stuck in your outbox? The culprit may be a blocked or interrupted internet connection.
With continuous internet monitoring, you'll always know if your internet connection is to blame for errors in your network.
And if your system does indeed crash, you'll see so immediately and can quickly take action to keep the potential damage to your company to a minimum. You can also check to make sure your ISP (internet Service Provider) is abiding by your SLA.
How to monitor your internet connection
![]()
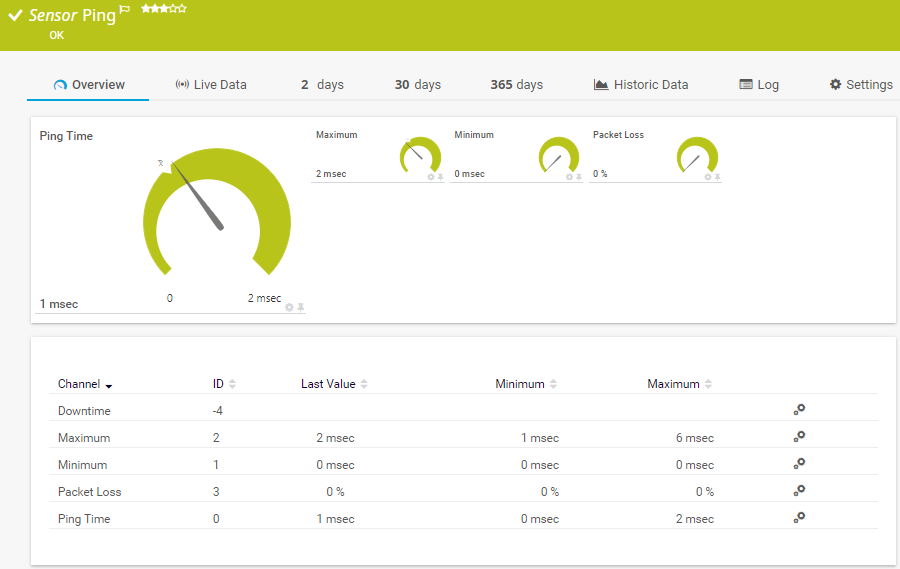
Using the Ping sensor, send a ping at regular intervals to the IP addresses of services such as Google (8.8.8.8) and Cloudflare (1.1.1.1).
![]()
If all of your monitored services are down, it probably means that you have no internet connection. In such a case, set up an SMS notification in PRTG (no internet-based notifications like push or email).
For more information about the reliability of the connection between you and a specific device or server, you can use the Ping Jitter sensor. In addition to the information about the device's reachability, the sensor will give you indicators on the reliability of lines in the form of variation in response times.
Trusted by 500,000 users and recognized
by industry analysts as a leader
by industry analysts as a leader

“Fantastic network and infrastructure monitoring solution that is easy to deploy and easier still to use. Simply the best available.”

“Software is absolutely perfect, Support is superior. Meets all needs and requirements, this is a must have solution if you are needing any form of monitoring.”

“The tool excels at its primary focus of being a unified infrastructure management and network monitoring service.”
PRTG sensors for monitoring your internet connection
There are several ways to monitor your network’s internet connection with PRTG. You can use our Ping v2 sensor to ping the DNS-IP of large and reliable web services at regular intervals.
![]() Ping is a command-line utility, available on virtually any operating system with network connectivity, that acts as a test to see if a networked device is reachable. The ping command sends a request over the network to a specific device. A successful ping results in a response from the computer that was pinged back to the originating computer.
Ping is a command-line utility, available on virtually any operating system with network connectivity, that acts as a test to see if a networked device is reachable. The ping command sends a request over the network to a specific device. A successful ping results in a response from the computer that was pinged back to the originating computer.
Read more
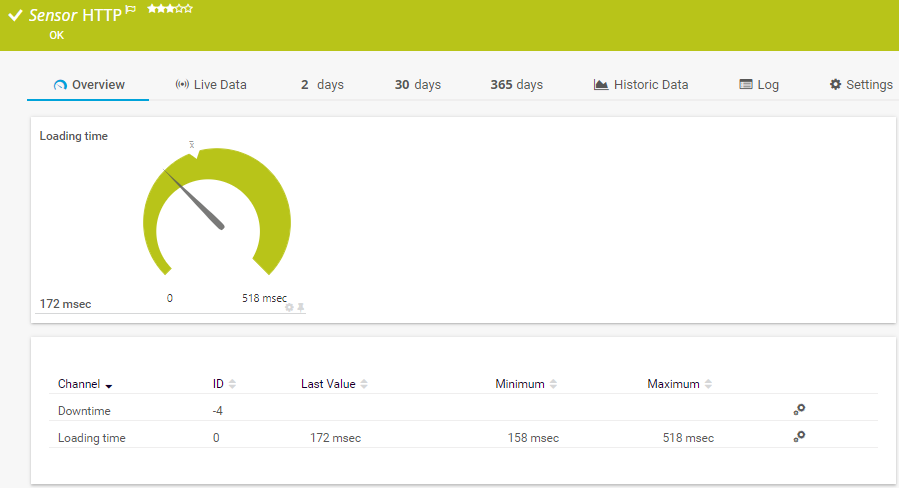
The HTTP v2 sensor checks the load time of a website or component. It lets you check the length of time required to load specific content, and draw conclusions with regard to the performance of your internet connection.
Solving issues with your internet connection
If you have issues with your internet connection and need to know where the problem lies, you can use a series of sensors to pinpoint the location.
First, figure out all hops between you and the device you are trying to connect to using traceroute or tracert 9.9.9.9:
Traceroute or tracert 9.9.9.9
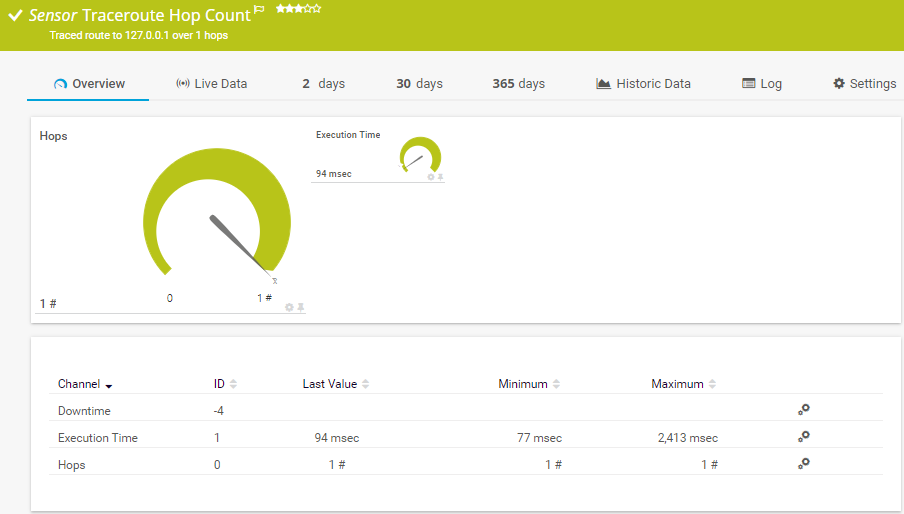
Then create a device for each one of the hosts and add a Ping v2 or a Ping Jitter sensor for each. Now, you can see which hop or which router is introducing the issues in your connection.
Take that information and call your Internet Service Provider (ISP), you will probably get a better response than "Take two aspirin’s and call me in the morning".
Using the PRTG Traceroute Hop Count sensor, you can also see if there are changes in the route itself. This would happen if there was a routing change or someone was redirecting the traffic. In that case, you would see a change in the number of hops between your device and the destination. You could use this sensor as an indicator that the ISP is having issues with the connections.
Checking the availability of your device
If your concern is more the availability of the device/host, PRTG has different sensors that can assist.
Again, the Ping v2 sensor will let you know that the device is reachable and, in most cases, if the operating system is alive.
But there are cases where the machine may have crashed and is still responding to pings. In this age of more sophisticated peripherals, basic functionality is often off-loaded to hardware. Like ping, which is a simple standard protocol, it can be implemented in firmware on network cards.
If you have a false positive, it may be great for the normal operational efficiency, but devastating to monitoring. In order to get around this issue, you have to test the services running on the device. Like in our prior example Quad9 DNS (9.9.9.9).

How to make sure your server is up and running
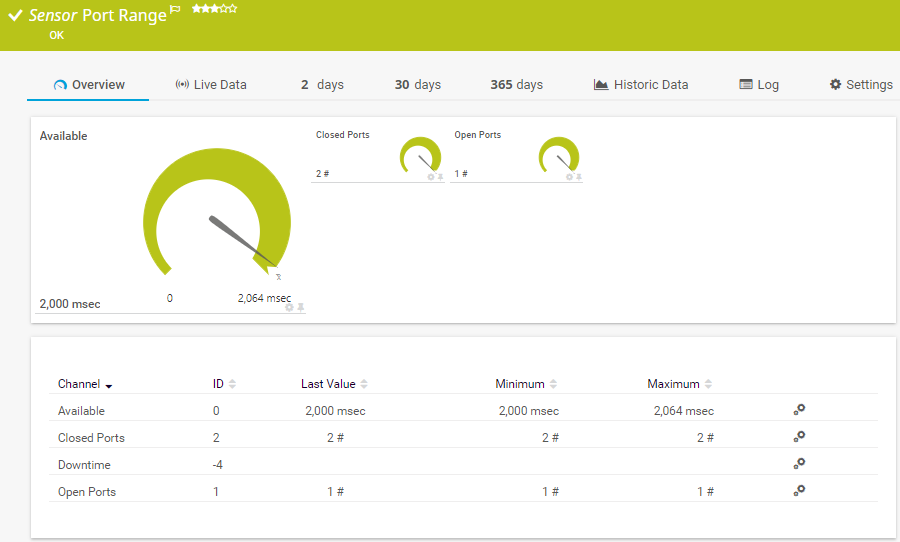
If you want to make sure the server is up and functioning you can use the Port Range sensor to establish a connection with the service on the particular server.
If the sensor succeeds, you know a couple of things:
-
The device is reachable through the network
-
The operating system on the device is active and managing connections
-
The program that performs the service is active and ready to perform the service
-
Given the timing, you can see how busy it is
With this one sensor, you have gleamed a lot more information about the state of the device on the other end without the need for credentials of any security information.
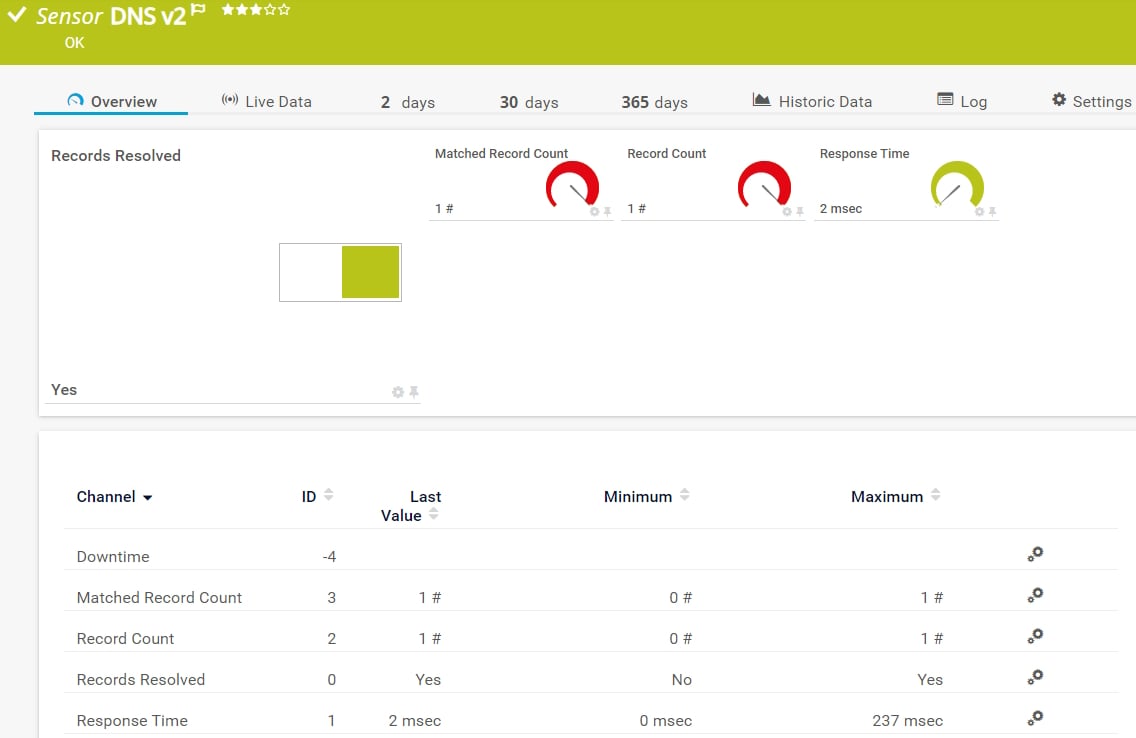
Checking the performance of the DNS Server
You can check the performance of the DNS server by querying a record by adding the DNS v2 sensor to the device.
Additionally to the information provided by the Port Range sensor, you now know:
- The DNS service is doing its job of resolving DNS records
- If you pick one of your own website DNS records, your records resolve correctly
Why PRTG is the perfect monitoring tool
Simple and intuitive
PRTG is set up and configured in no time, and extremely easy to use. What’s more, an easy-to-read user interface turns internet monitoring and daily work with PRTG into a genuinely pleasurable experience.
Automated alarms
PRTG automatically sounds the alarm if your internet connection is interrupted or another problem arises in your network. You can set your own threshold values, and be informed by SMS, email, or push notification in the event they are exceeded.
Quick troubleshooting
PRTG allows you to promptly take action in the event of a problem, such as when the internet is unreachable. It lets you stop potential errors and malfunctions in their tracks, before the company takes notice of them. Your coworkers will thank you for it!
PRTG keeps an eye on everything

We'll make you a monitoring expert
Gain practical knowledge on how to monitor your infrastructure with Paessler PRTG. Our training sessions are planned and provided by Paessler system engineers and are suitable for different experience levels.
PRTG in a nutshell
PRTG monitors your entire IT infrastructure
Use PRTG to monitor, for example, network traffic, applications, bandwidth, cloud services, databases, virtual environments, availability & uptime, ports, IP addresses, hardware status, network security, web services, and much more.
PRTG supports the most important technologies
Monitor your network for example via SNMP, flow protocols (NetFlow, jFlow, sFlow, IPFIX), SSH, WMI, or ping. PRTG also supports technologies used in Industrial IT & OT environments, such as OPC UA, MQTT, or Modbus. Use the powerful PRTG API for custom integrations (for example via Python, PowerShell, or REST).
PRTG can be used for any operating system
Download and install PRTG Network Monitor on a Windows system or use our cloud-based product PRTG Hosted Monitor for all other operating systems. What’s more: our native PRTG Desktop application runs on Windows or macOS – for even quicker access & multi-server views.


Still not convinced?
![]()
More than 500,000 sysadmins love PRTG
Paessler PRTG is used by companies of all sizes. Sysadmins love PRTG because it makes their job a whole lot easier.
Still not convinced?
![]()
Monitor your entire IT infrastructure
Bandwidth, servers, virtual environments, websites, VoIP services – PRTG keeps an eye on your entire network.
![]()
Try Paessler PRTG for free
Everyone has different monitoring needs. That’s why we let you try PRTG for free. Start now with your trial.
|
PRTG |
Network Monitoring Software - Version 24.2.94.1400 (April 10th, 2024) |
|
Hosting |
Download for Windows and cloud-based version PRTG Hosted Monitor available |
Languages |
English, German, Spanish, French, Portuguese, Dutch, Russian, Japanese, and Simplified Chinese |
Pricing |
Up to 100 sensors for free (Price List) |
Unified Monitoring |
Network devices, bandwidth, servers, applications, virtual environments, remote systems, IoT, and more |
Supported Vendors & Applications |
|
Combining the broad monitoring feature set of PRTG with IP Fabric’s automated network assurance creates a new level of network visibility and reliability.