![]()
Increased network stability
with PRTG jFlow monitoring

Identify overload times
and potential bottlenecks
PRTG ensures bandwidth
is used efficiently
Sort and analyze your network traffic by address or application
Sort and analyze traffic with jFlow monitoring
Companies require increasingly larger bandwidths and sophisticated capacity management to optimize the performance of their networks and business processes, to avoid overloads, and to save money by detecting and fixing of bandwidth consumers. The Flow technology for Juniper devices (jFlow) is best suited for this, but requires professional monitoring in order to collect and analyze corresponding traffic data.
With PRTG jFlow monitoring, overload times and potential bottlenecks can be identified, and based on that data you can adjust your IT infrastructure as well as the available bandwidth.
During Bandwidth monitoring via the jFlow protocol the router or switch collects data packets, groups them to flows and this information about the flows is sent to PRTG via UDP. In PRTG you can filter those data automatically by traffic type (e.g. mail, web, FTP) and immediately see which applications and devices use your bandwidth within your network. You can also turn on sampling if your router supports it. Then only every n-th data packet is sent to PRTG which minimizes your CPU and bandwidth usage.
The visual presentation of the monitoring tool PRTG in top lists provides additional optimal analysis conditions: you immediately get informed by sudden increases of the bandwidth usage of a certain network address or application. With jFlow and PRTG you get the most of your network and protection against failures.
With PRTG, everyone can work with peace of mind.
This is what monitoring looks like in PRTG
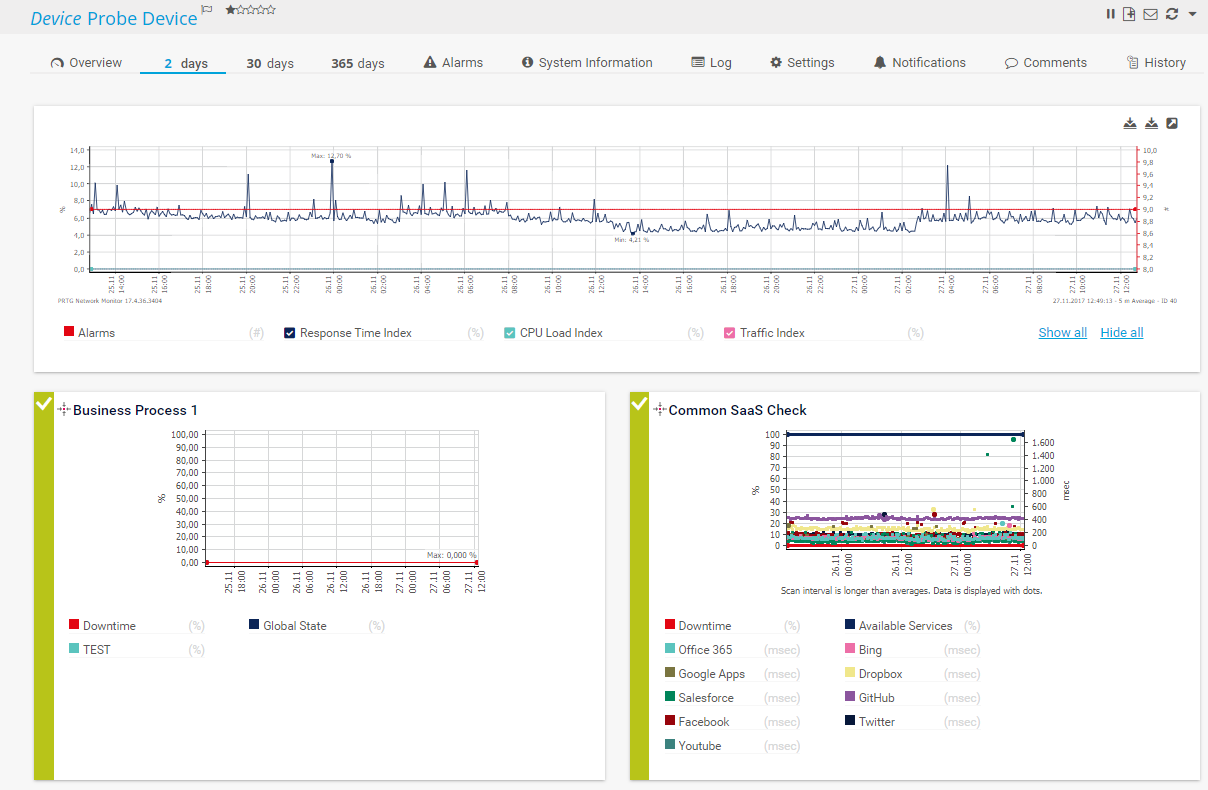
2 days devicetab
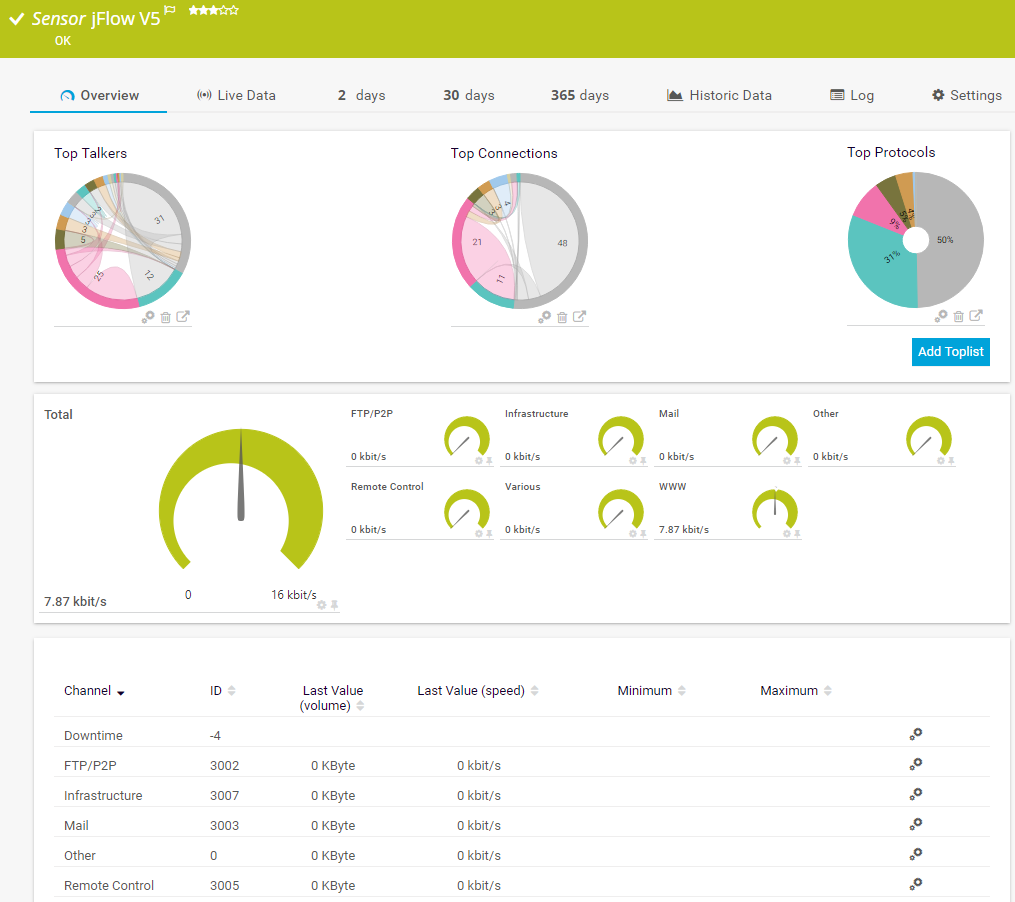
jFlow Sensor: overview
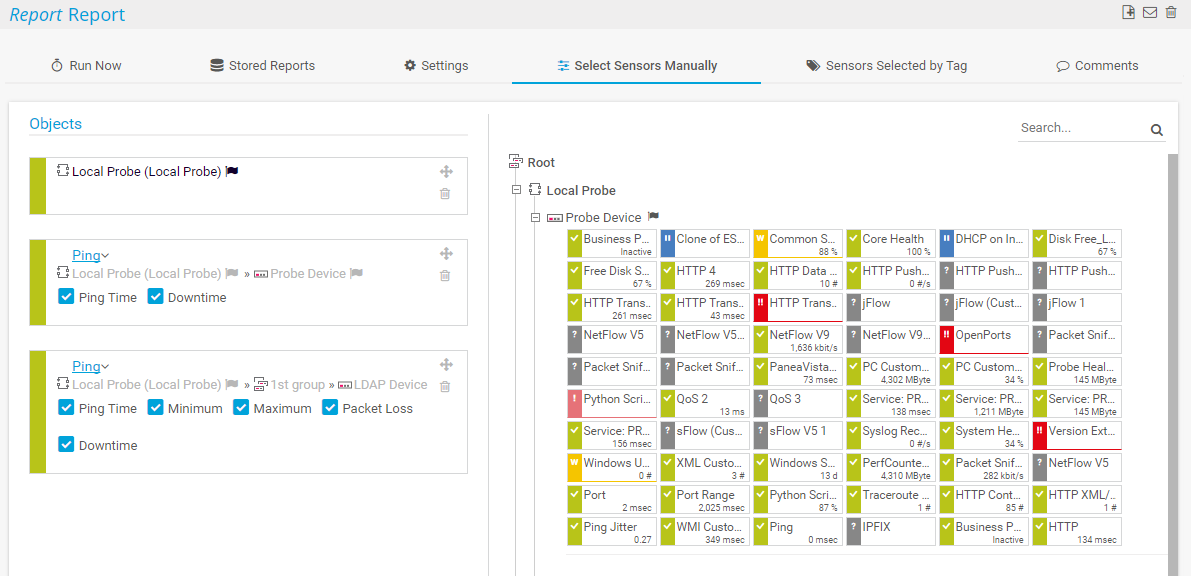
Sensor report selection
This is how jFlow monitoring with PRTG works
JFlow is a data flow sampling technology optimized for Juniper devices for the monitoring of computer networks. It is mostly identical with Cisco NetFlow. Bandwidth usage data is collected in the router, firewall or switch in the form of flows and is sent to the Flow Collector PRTG via UDP.
With PRTG, you sort the flow automatically by traffic type (mail, FTP, or WWW) and use it for statistical processing and visualization. With PRTG, you detect the originators of the data traffic within your network sorted by sender/target IP, sender/target port, IP protocol, and service type.
Flow technology is characterized by minimal bandwidth usage as well as a high degree of detail, and is especially suitable for high traffic networks.
6 advantages of jFlow monitoring with PRTG

Notifications
PRTG warns against network failures
and protocol errors
Troubleshooting
Promptly fix errors and
prevent network crashes
Network stability
A decision-making tool for traffic reduction, bandwidth usage, and the scaling of capacities

Increased productivity
Business processes and applications benefit from optimized bandwidth usage

Analytical capabilities
Traffic visuals
display correlations
Security optimization
Identify suspicious
traffic and malware
PRTG makes your job easier
Our monitoring software frees you to focus on other tasks by promptly notifying you of potential issues.
![]()
Save effort
PRTG gives you one central monitoring tool for your servers and entire network. Enjoy a quick overview of your whole infrastructure via our dashboard and app.
![]()
Save time
Getting started with PRTG is a breeze. Setting up or switching from another network monitoring tool is easy thanks to the auto-discovery and pre-configured device templates.
![]()
Save money
80% of our customers report substantial cost savings with network monitoring. Your costs of licenses will likely pay for themselves within weeks.
Trusted by 500,000 users and recognized
by industry analysts as a leader

“Fantastic network and infrastructure monitoring solution that is easy to deploy and easier still to use. Simply the best available.”

“Software is absolutely perfect, Support is superior. Meets all needs and requirements, this is a must have solution if you are needing any form of monitoring.”

“The tool excels at its primary focus of being a unified infrastructure management and network monitoring service.”
Your jflow monitoring at a glance – even on the go
Set up PRTG in minutes and use it on almost any mobile device.


“The greatest advantage of PRTG? You get to rest easy.“
Steffen Ille, Bauhaus-University of Weimar, Germany


“Easy to implement and configure with good technical support.”
R. v. S., ICT Manager at Heinen & Hopman Eng BV

PRTG: The multi-tool for sysadmins
Adapt PRTG individually and dynamically to your needs and rely on a strong API:- HTTP API: Access monitoring data and manipulate monitoring objects via HTTP requests
- Custom sensors: Create your own PRTG sensors for customized monitoring
- Custom notifications: Create your own notifications and send action triggers to external systems
- REST Custom sensor: Monitor almost everything that provides data in XML or JSON format
Still not convinced?
![]()
More than 500,000 sysadmins love PRTG
Paessler PRTG is used by companies of all sizes. Sysadmins love PRTG because it makes their job a whole lot easier.
Still not convinced?
![]()
Monitor your entire IT infrastructure
Bandwidth, servers, virtual environments, websites, VoIP services – PRTG keeps an eye on your entire network.
![]()
Try Paessler PRTG for free
Everyone has different monitoring needs. That’s why we let you try PRTG for free. Start now with your trial.
|
PRTG |
Network Monitoring Software - Version 24.2.94.1400 (April 10th, 2024) |
|
Hosting |
Download for Windows and cloud-based version PRTG Hosted Monitor available |
Languages |
English, German, Spanish, French, Portuguese, Dutch, Russian, Japanese, and Simplified Chinese |
Pricing |
Up to 100 sensors for free (Price List) |
Unified Monitoring |
Network devices, bandwidth, servers, applications, virtual environments, remote systems, IoT, and more |
Supported Vendors & Applications |
|