![]()
Scalable database monitoring for multiple database providers
- All-in-one database monitoring from a single pane of glass
- Monitor Oracle SQL, Microsoft SQL, MySQL, PostgreSQL & more
- Avoid downtimes and optimize database performance
Our users give top ratings for monitoring with Paessler PRTG


PRTG database monitoring: What you’ll find on this page

PRTG makes database monitoring easy
Custom alerts and data visualization make it easy to monitor, identify, and prevent database server issues.
Database monitoring with PRTG: The basics
Business operations are almost always based on information that is stored and managed in SQL databases. For a business to be successful, these databases must always be up and running to avoid costly downtime.
The challenge: Database downtimes
Database downtime, or crashes, are caused by hardware errors, faulty configurations, or insufficient disk space or memory. Corrupted databases with defective files can also lead to problems.
If a downtime occurs, time is of the essence to prevent data loss and costly interruptions of business services and processes.
The solution: Real-time database monitoring
Paessler PRTG helps ensure your databases are always available and operating at optimal performance. With its customizable alarm system, you’re informed promptly of any issues before bigger problems arise.
This way, you can quickly resolve the database issue and keep your operations running smoothly.
5 reasons to use PRTG as your database monitoring tool
A quick, concise overview
Query data from your database without lengthy connection or response times. PRTG displays the database request’s execution time on your database dashboard in real time.
This includes database availability and database performance, vital elements to your business operations.
Detailed views defined by you
PRTG is the only database monitoring tool that lets you monitor specific data sets from your databases with individually configured sensors and SQL queries that you define yourself.
This enables you to optimize your data storage and processing, as well as your business processes.
Designed for many vendors
PRTG comes with preconfigured sensors for many common database manufacturers, including MySQL, Microsoft SQL, Oracle SQL, and PostgreSQL.
If you use a different database, you can easily write your own custom sensor – or you use our brand-new product extension PRTG Database Observer for extended database activity monitoring.
Custom, in-depth reports
Use PRTG to analyze and monitor specific data sets in your databases. Just create database reports on demand or via schedule, and include raw or accumulated data, as well as data graphs, as required.
This way, trend analysis and database capacity planning are easier than ever.
Individual data visualization
View your database monitoring data from the central dashboard, or create custom PRTG dashboards and maps to visualize your setup the way you need.
PRTG includes an easy-to-use drag & drop map editor with which displaying your database infrastructure for public or internal use is no problem at all.
Bring your monitoring experience to the next level with our PRTG product extensions
Enhance the functionality of Paessler PRTG & benefit from an extended feature set for data export and advanced database monitoring.
Data extraction for easier monitoring data analysis
- Export raw monitoring data from PRTG & store it in your relational database – no programming skills needed
- Have all important data available in a single database
- Generate your own analyses & reporting using third-party tools
Database monitoring with extended database support
- Monitor the health & performance of databases that go beyond the standard PRTG set
- Use predefined SQL queries for easier setup of your database monitoring
- Manage and test database queries & share them in your team
“All-around winning “The real beauty of PRTG is the endless possibilities it offers” “Outstanding cloud IT experts agree: Paessler PRTG is a great solution for IT infrastructure monitoring

network monitor”

monitoring”
What database activity monitoring looks like in PRTG
Diagnose network issues by continuously monitoring the performance and health of your database servers. Show execution time, online status, and tablespace size in real time and visualize data in graphic maps & dashboards to identify problems more easily. Gain the visibility you need to troubleshoot issues with your SQL databases.
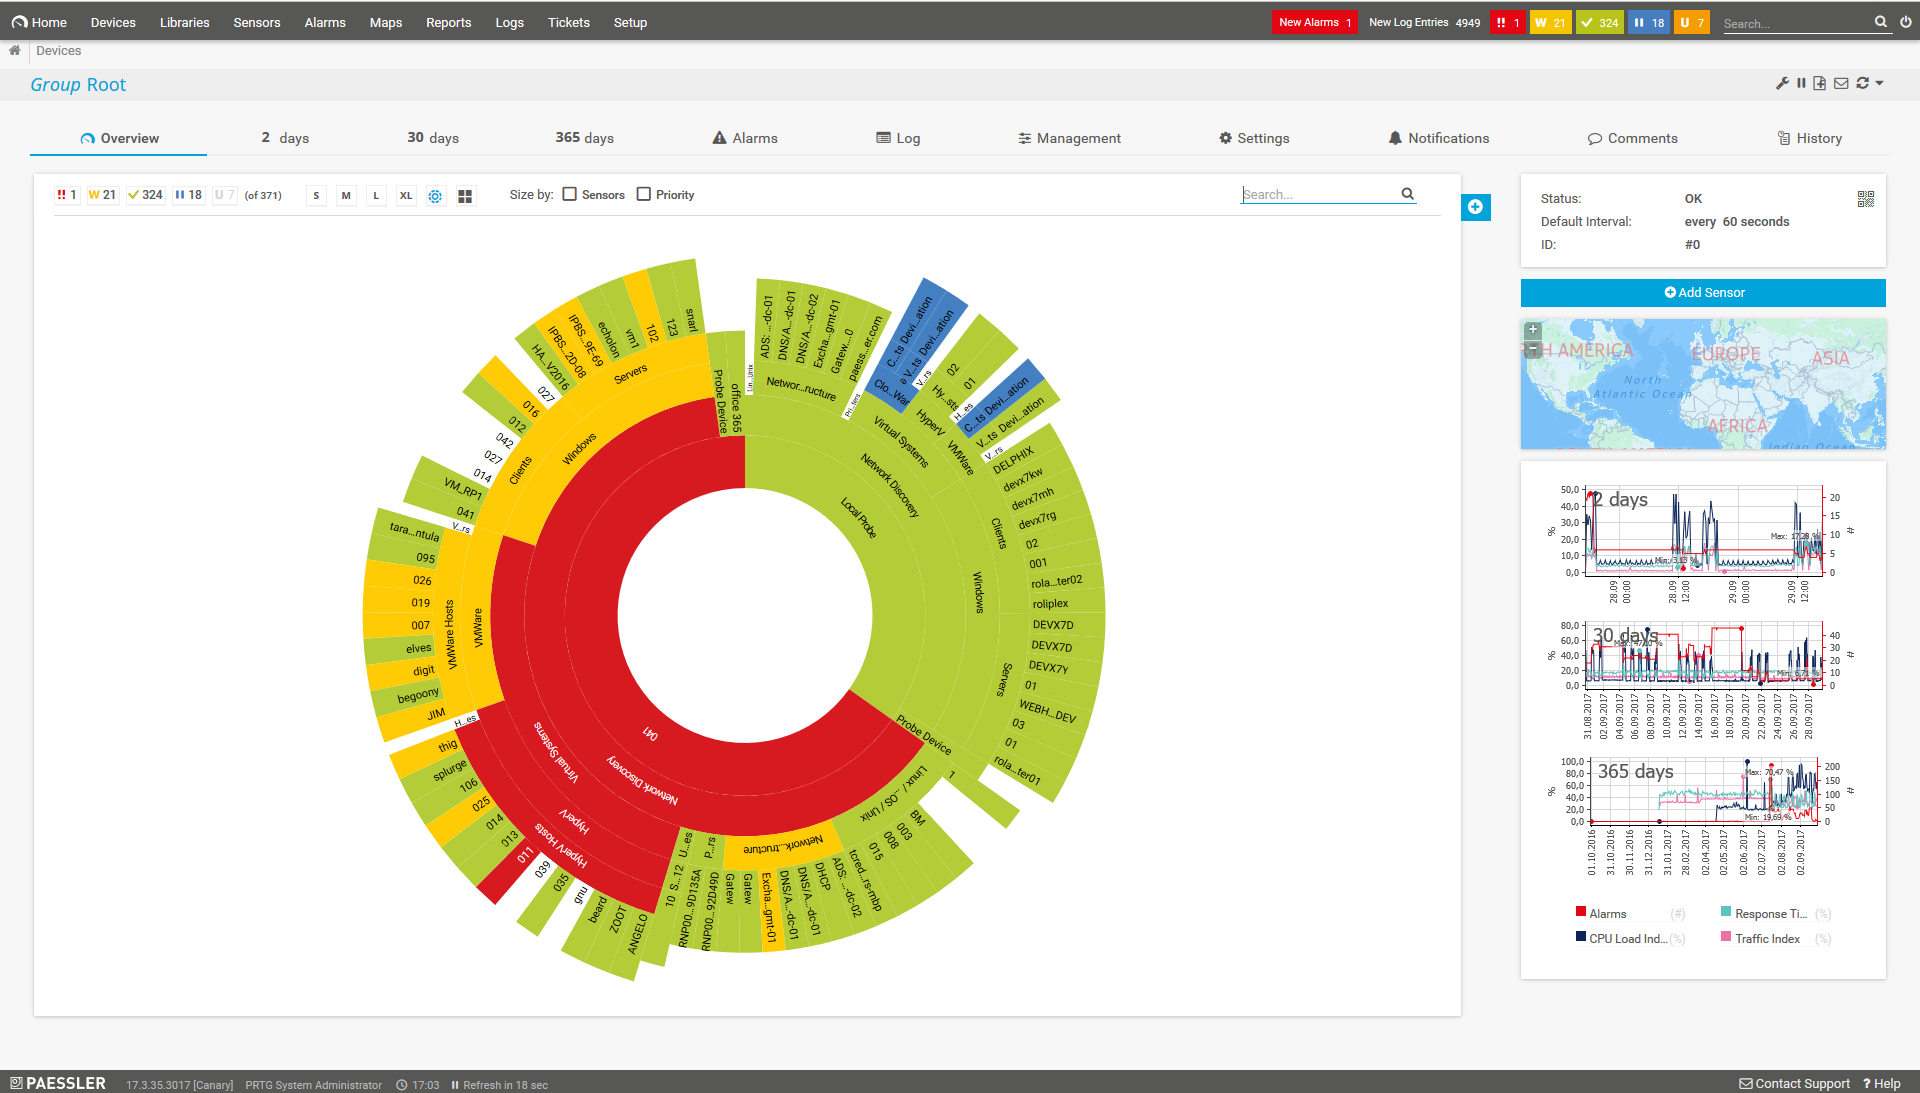
Sunburst view of the entire monitoring setup
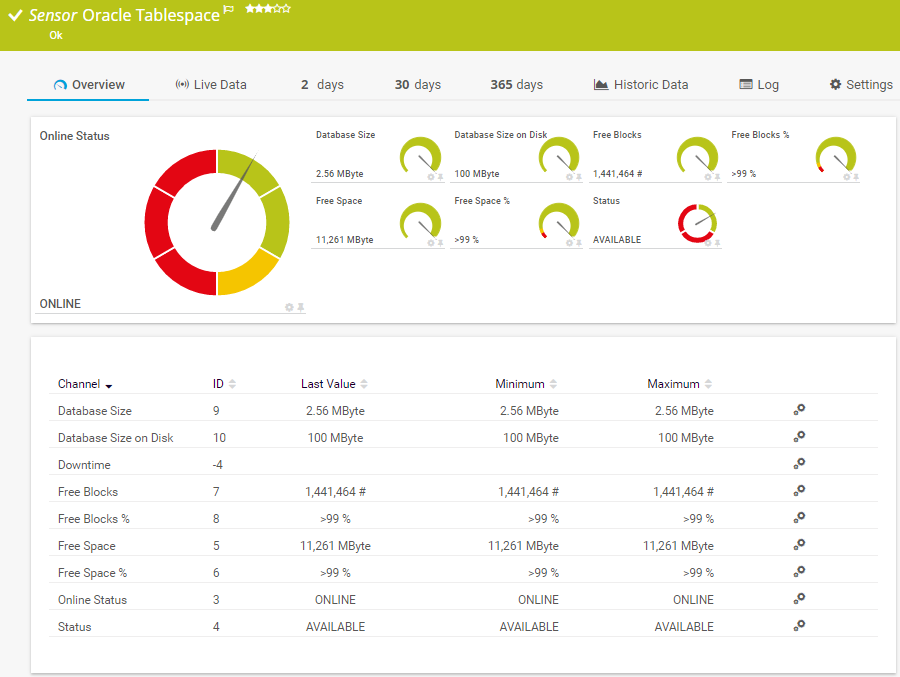
Oracle Tablespace sensor in PRTG
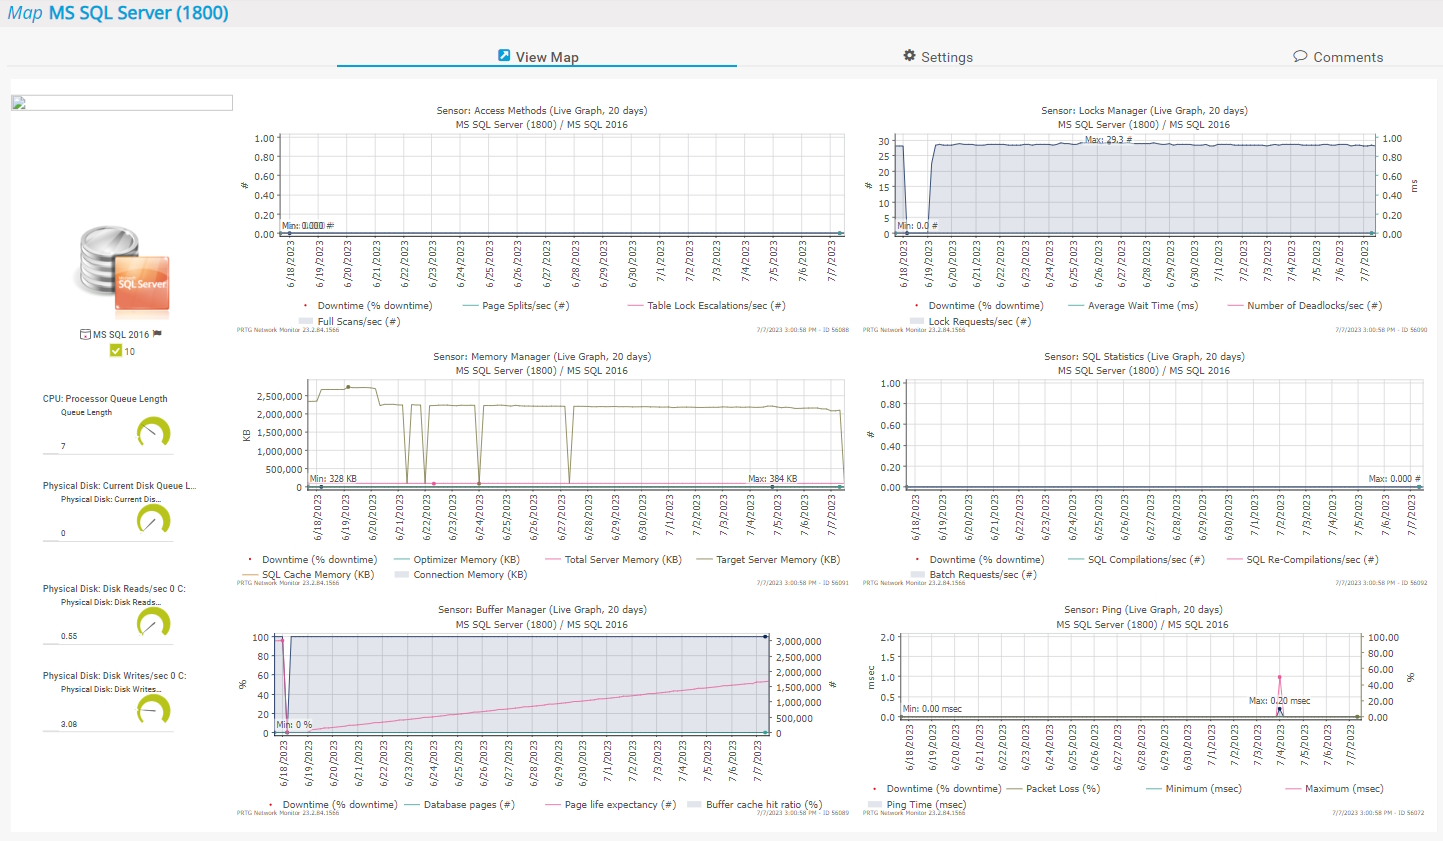
Custom PRTG map for MS SQL monitoring
Easily find the source of the problem with our PRTG database activity monitoring solution
Real-time alerts and custom notifications make it easy to solve issues with the performance of your database servers and processes.
PRTG is compatible with all major vendors, products, and systems
![]()
3 uses cases for database monitoring with PRTG
Optimize database efficiency
Bad database performance always impacts your business-critical infrastructure. Thus, it is important to monitor database performance and database activity round the clock.
PRTG helps you check the query execution time on your database servers and notifies you in case of slow performance.
Check database scalability
It’s no secret that databases are growing hugely over time.
Use our database monitor PRTG to make sure that you always know when database space is beginning to run low so that you can expand existing database space or set up new ones in time and prevent database crashes.
Watch database processes
With our PRTG database monitoring software, you can easily keep an eye on various database transactions. If these transactions do not work as expected, this might also point to a problem somewhere else in your network.
To find the root cause of an issue, PRTG provides a wealth of historical data for detailed analysis.
Your database monitor at a glance – even on the go
Set up PRTG in minutes and use it on almost any mobile device.


What database providers does PRTG cover?
PRTG comes with various preconfigured sensors for monitoring database systems like Oracle SQL, Microsoft SQL, MySQL, PostgreSQL, or Microsoft Azure:
Oracle SQL
PRTG includes the Oracle SQL v2 sensor as well as the Oracle Tablespace sensor for this database type, commonly used in business environments.
Microsoft SQL
With the WMI Microsoft SQL Server 2019 sensor, you can monitor your MS SQL databases. Also available for SQL Server 2008, 2012, 2014, 2016, and 2017.
MySQL
For MySQL, apply the MySQL v2 sensor to handle the most popular open-source database, used by small and medium-sized company websites.
Microsoft Azure
With the Microsoft Azure SQL Database sensor, you can monitor the metrics of single database or elastic pool in a Microsoft Azure subscription.
Other databases
If you work with a different database, use our ADO SQL v2 sensor. It can monitor any data source which is available through OLE DB or ODBC.
If you need extended database monitoring for databases such as IBM DB2, SAP HANA, SAP MaxDB, and others, check out our brand-new product extension PRTG Database Observer.
Create innovative solutions with Paessler’s partners
Partnering with innovative vendors, Paessler unleashes synergies to create
new and additional benefits for joined customers.


UVnetworks
UVexplorer integrates tightly with PRTG to bring fast and accurate network discovery, detailed device inventory, and automatic network mapping to the PRTG platform.
“Excellent tool for detailed monitoring. Alarms and notifications work greatly. Equipment addition is straight forward and server initial setup is very easy. ...feel safe to purchase it if you intend to monitor a large networking landscape.”
Infrastructure and Operations Engineer in the Communications Industry, firm size 10B - 30B USD
PRTG makes database monitoring easy
Custom alerts and data visualization make it easy to monitor, identify, and prevent database server issues.
Monitor databases: FAQ
1. What is database monitoring?
Database monitoring involves tracking and analyzing the performance, health, and activity of a database system in real-time. It helps identify and address issues such as slow queries, resource bottlenecks, and potential failures to ensure optimal database performance and reliability. Database monitoring tools often provide insights into metrics like response times, throughput, and resource utilization.
2. What are the benefits of database monitoring tools?
Using a database monitoring software like PRTG has several benefits, for example:
- Performance optimization: Database monitoring tools help identify and address performance bottlenecks. This ensures efficient query execution and optimal use of system resources.
- Proactive issue detection: By continuously monitoring database metrics, these tools can detect and alert on potential issues before they escalate. This allows administrators to take preventive measures.
- Resource management: Database monitoring tools provide insights into resource utilization, which enables administrators to allocate resources effectively, scale infrastructure as needed, and avoid unnecessary downtime.
- Security and compliance: Monitoring tools contribute to security by identifying unusual activities or potential security breaches.
- Capacity planning: By analyzing historical trends and current usage patterns, database monitoring tools assist in capacity planning. This allows organizations to anticipate future resource needs and make informed decisions about scaling infrastructure.
3. What database types are there?
Databases can be categorized into various types based on their data model, structure, and usage. Some common types of databases include:
- Relational Databases (RDBMS): Organize data into tables with predefined relationships between them. Examples include MySQL, PostgreSQL, and Oracle Database.
- NoSQL Databases: Designed to handle unstructured or semi-structured data and provide flexible schema designs. Types include document-oriented (e.g., MongoDB), key-value stores (e.g., Redis), and column-family stores (e.g., Apache Cassandra).
- Object-Oriented Databases (OODBMS): Store data in the form of objects, encapsulating data and behavior. They are well-suited for object-oriented programming paradigms.
- Graph databases: Optimize for storing and querying data with complex relationships, represented as a graph. Examples include Neo4j and Amazon Neptune.
- Time-series databases: Specialized for handling time-stamped data, such as sensor readings or financial market data. InfluxDB and OpenTSDB are examples.
- Spatial databases: Designed for storing and querying spatial data, supporting geographical information systems (GIS). PostGIS is an example.
- In-memory databases: Store data in the system's main memory (RAM) for faster retrieval and processing. Examples include Redis (also a NoSQL database) and SAP HANA.
- Multi-model databases: Support multiple data models within a single database system, allowing users to choose the most appropriate model for their needs.
These categories highlight the diversity of databases, each suited to specific use cases and data management requirements.
4. How does an SQL database work?
In an SQL database, data is organized into tables, each with predefined columns and data types. SQL (Structured Query Language) is used to define, manipulate, and query the data. When a query is executed, the database management system (DBMS) interprets and optimizes the SQL statements to interact with the underlying data.
The DBMS processes queries using algorithms to efficiently retrieve, update, or delete records. Additionally, SQL databases enforce data integrity through constraints like primary keys, foreign keys, and unique constraints, ensuring consistency and reliability in the stored data.
5. What is a sensor in PRTG?
In PRTG, “sensors” are the basic monitoring elements. One sensor usually monitors one measured value in your network, for example the traffic of a switch port, the CPU load of a server, or the free space on a disk drive.
On average, you need about 5-10 sensors per device or one sensor per switch port.

PRTG: The multi-tool for sysadmins
Adapt PRTG individually and dynamically to your needs and rely on a strong API:- HTTP API: Access monitoring data and manipulate monitoring objects via HTTP requests
- Custom sensors: Create your own PRTG sensors for customized monitoring
- Custom notifications: Create your own notifications and send action triggers to external systems
- REST Custom sensor: Monitor almost everything that provides data in XML or JSON format
More than just a monitoring tool:
Reasons our customers love PRTG


Paessler PRTG is used by companies of all sizes. Sysadmins love PRTG because it makes their job a whole lot easier. Bandwidth, servers, virtual environments, websites, VoIP services – PRTG keeps an eye on your entire network. Everyone has different monitoring needs. That’s why we let you try PRTG for free.Still not convinced?
![]()
More than 500,000
sysadmins love PRTG![]()
Monitor your entire IT infrastructure
![]()
Try Paessler PRTG
for free
![]()
Start database server monitoring with PRTG and see how it can make your network more reliable and your job easier.
|
PRTG |
Network Monitoring Software - Version 24.2.94.1400 (April 10th, 2024) |
|
Hosting |
Download for Windows and cloud-based version PRTG Hosted Monitor available |
Languages |
English, German, Spanish, French, Portuguese, Dutch, Russian, Japanese, and Simplified Chinese |
Pricing |
Up to 100 sensors for free (Price List) |
Unified Monitoring |
Network devices, bandwidth, servers, applications, virtual environments, remote systems, IoT, and more |
Supported Vendors & Applications |
|