![]()
Packet capture tool PRTG:
All-in-one monitoring

PRTG monitors
data traffic
PRTG analyzes
data packets
PRTG monitors IP, UDP,
and TCP traffic
PRTG uses
packet sniffers
PRTG uses NetFlow, IPFIX,
sFlow and jFlow
PRTG sensors for analyzing data packets
![]() How PRTG defines sensors
How PRTG defines sensors
In PRTG, “sensors” are the basic monitoring elements. One sensor usually monitors one measured value in your network, e.g. the traffic of a switch port, the CPU load of a server, the free space of a disk drive. On average you need about 5-10 sensors per device or one sensor per switch port.
PRTG lets you monitor IP packets and filter according to UDP and TCP packets, for example. The following PRTG sensors will allow you to capture packets:
![]()
Packet Sniffer sensor
With the Packet Sniffer Sensor, you can monitor web traffic, mail traffic, file transfer traffic, infrastructure traffic, and remote control traffic, among others. The sensor only analyzes the headers of data packets, and therefore puts little strain on your system. To the Packet Sniffer Sensor.
![]()
NetFlow sensors
The NetFlow protocol is mainly used by Cisco devices. PRTG comes with corresponding NetFlow sensors. Whether NetFlow v5, NetFlow v9, or IPFIX: PRTG has sensors for Cisco routers and switches that can handle any future developments. To the NetFlow sensors.
![]() NetFlow is a protocol for collecting, aggregating and recording traffic flow data in a network. NetFlow data provide a more granular view of how bandwidth and network traffic are being used than other monitoring solutions, such as SNMP. NetFlow was developed by Cisco and is embedded in Cisco’s IOS software on the company’s routers and switches and has been supported on almost all Cisco devices since the 11.1 train of Cisco IOS Software.
NetFlow is a protocol for collecting, aggregating and recording traffic flow data in a network. NetFlow data provide a more granular view of how bandwidth and network traffic are being used than other monitoring solutions, such as SNMP. NetFlow was developed by Cisco and is embedded in Cisco’s IOS software on the company’s routers and switches and has been supported on almost all Cisco devices since the 11.1 train of Cisco IOS Software.
Read more
![]()
sFlow sensors
sFlow sensors only check every nth packet. You will therefore put even less strain on your network. These sensors are especially suited for extremely large networks, where reducing the network load caused by monitoring is a must. To the sFlow Sensor.
![]()
jFlow sensors
jFlow sensors are often used for Juniper Networks devices. If you use Juniper routers or switches, jFlow is a particularly good way to monitor data traffic and packets. To the jFlow-Sensor.
![]()
Custom sensors
NetFlow, IPFIX, jFlow, and sFlow sensors are also available as custom sensors. These sensors can be configured to serve as individual channels or to monitor the data traffic you wish to analyze. As a result, you can pinpoint your troubleshooting. To the Flow-sensors.
![]()
... more than sensors
You'll find over 250 sensors in our sensor list. These sensors are part of a single, centralized tool that allows you to perform comprehensive monitoring and capture data traffic. With PRTG, you’ll keep a constant eye on your entire network and all ongoing network activities. Our sensor list is continually being updated.
PRTG is a vital tool for getting your IT into tip-top shape!
The costs for a one-year PRTG license pay for themselves in an average of only a few weeks.
License costs vary according to the size of your network.
PRTG makes your network more reliable
PRTG saves network management costs
PRTG saves time spent on network management
Keep a constant eye on your network – even while on the go
Set up PRTG in minutes and use it on almost any mobile device.


Packet analysis: 6 advantages of PRTG
![]()
Quick setup
While configuring PRTG, the Auto Discovery feature is launched automatically. This feature searches all the devices in your network, and creates sensors for monitoring them. Basic monitoring is therefore configured during the setup process, and available when opening PRTG for the very first time. This saves you time and hassle. Initial results, furthermore, are displayed immediately.
![]()
Custom filters
Custom sensors allow you to choose the types of data you wish to capture. For example, you may opt to only analyze HTTP or file transfer traffic. You can also just have certain servers or devices displayed. As a result, you will pinpoint your troubleshooting.
![]()
Easy-to-understand dashboard
All important facts and figures are displayed in an easy-to-understand, customizable dashboard. Whether on your desktop, smartphone, or tablet: PRTG is always available!
![]()
Toplists for the overview
Each sensor automatically provides “toplists.” View the top talkers, top connections, and top protocols at a glance. You'll maintain a constant overview, and can subsequently perform an in-depth packet analysis or diagnosis.
![]()
Long-term analysis
PRTG lets you capture data traffic over a longer period of time, and then analyze this traffic. You’ll therefore detect long-term anomalies, such as an abnormal increase in certain protocols or data types in the total traffic at certain times or on specific days.
![]()
One tool for a variety of manufacturers
Whether a Cisco router, Juniper switch, or Microsoft server: PRTG has the right sensors for your network. Benefit from one central monitoring tool instead of a handful of separate solutions. PRTG lets you monitor total traffic as well as individual data packets. Have a look at some examples of dashboards.
Trusted by 500,000 users and recognized
by industry analysts as a leader

“Fantastic network and infrastructure monitoring solution that is easy to deploy and easier still to use. Simply the best available.”

“Software is absolutely perfect, Support is superior. Meets all needs and requirements, this is a must have solution if you are needing any form of monitoring.”

“The tool excels at its primary focus of being a unified infrastructure management and network monitoring service.”
Network: Where do I monitor data packets?
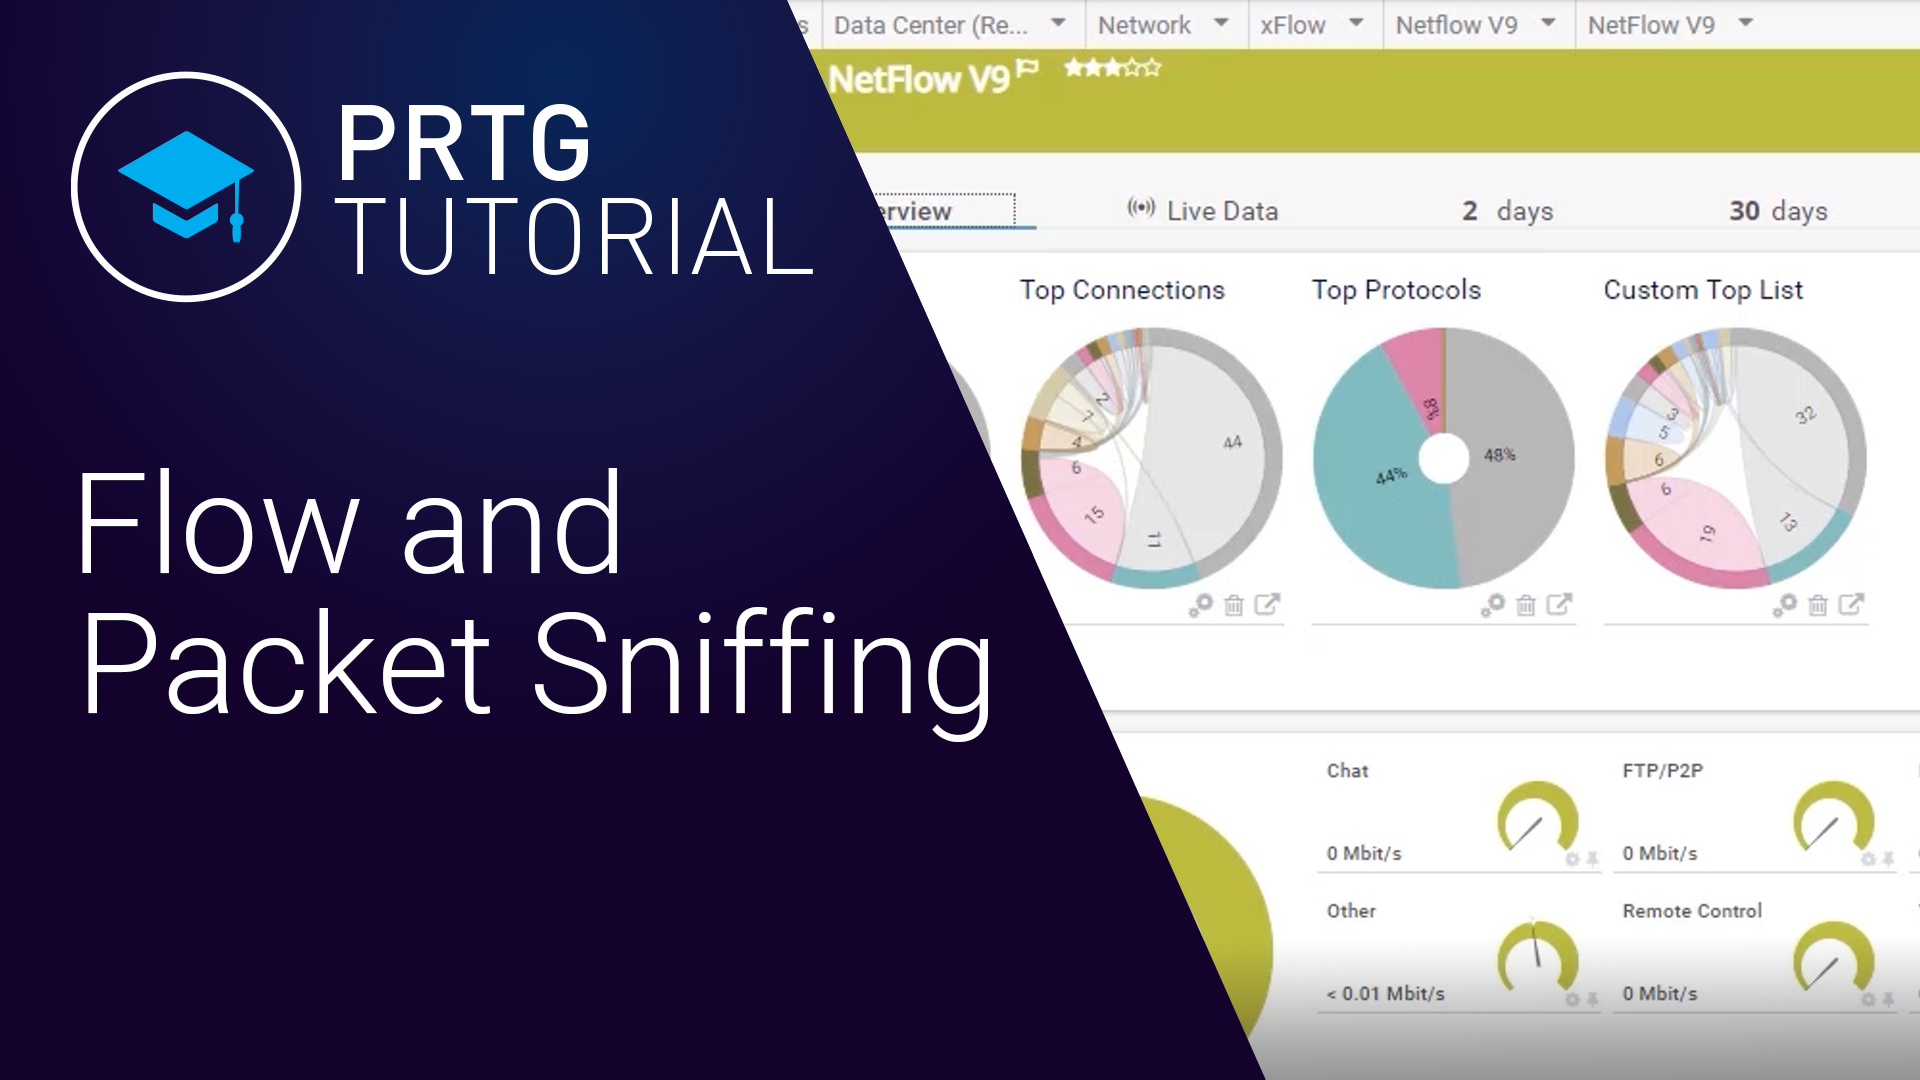
Video Tip: How to monitor your bandwidth with packet sniffing and flow technologies
View video (19:04 Min., English)
![]()
Capturing packets on the router
Connect PRTG to the monitoring port of a router or send flows to PRTG and use corresponding sensors to capture all data packets which pass through it. This procedure is the most common one.
![]()
Capturing packets on the switch
You can also use sensors to monitor data packets on an individual switch.
![]()
Capturing packets with VMware
PRTG monitors your virtual infrastructure by way of port mirroring on routers or access points. You will subsequently see which and how much data your ESX server sends and receives.
![]()
Capturing packets on the server
With PRTG, you can limit packet capture to individual servers. This is appropriate for email and web servers, for example.
We asked: would you recommend PRTG?
Over 95% of our customers say yes!
Paessler AG conducted trials in over 600 IT departments worldwide to tune its network monitoring software closer to the needs of sysadmins.
The result of the survey: over 95% of the participants would recommend PRTG – or already have.

What are data packets? Definition & tools
![]()
Data packets
Data packets make it possible for data to be communicated via the Internet. They are sent via all the usual protocols. TCP packets are extremely reliable during the exchange of data, as errors are checked for and eventually removed. With UDP packets, the focus is on the quick exchange of data. PRTG monitors IP, TCP, and UDP packets, as well as other protocols.
![]()
Packet capture tools
Many administrators use Wireshark to analyze their data packets. This tool, however, has the disadvantage that all information is captured live and unfiltered. This makes analyses difficult to perform as there is no clear indication of where to start. Although the tool provides an in-depth look, it does not come with an overview. PRTG takes a different approach. It lets you filter data packets according to various properties to detect potential problem areas, and then check these areas in more detail. By doing so, you'll get to the root of problems faster and more easily.

Also interesting:
Uptime Monitoring: PRTG checks the uptime of all your servers and ensures smooth running of your services. If any of your monitoring services goes down, you get an instant alarm.
Performance Monitoring: PRTG provides you with a constant overview of the performance levels of each and every component in your network. With a high-performance network, your whole company will work with maximum efficiency.
For administrators, PRTG means...
![]()
Less stress for the help desk
With the PRTG monitoring software, your network is demonstrably more stable.As a result, the help desk has a lot fewer calls. Most administrators dread help desk inquiries. With PRTG, you’ll save yourself this added stress.
![]()
More time for hardware
The built-in alarm system of PRTG lets you focus on the important tasks at hand with total peace of mind. You can calmly install a new piece of hardware, for example, a task which you usually don’t have the time to get around to.
![]()
Greater optimization possibilities
PRTG provides for detailed network traffic monitoring on a permanent basis. This means you can keep an eye on both total traffic and data packets. Thanks to historical data, you'll get a long-term database and can constantly improve your network.
![]()
More time for evaluations
PRTG makes evaluating new hardware and applications a breeze. With PRTG, network monitoring is fun! Every day, you’ll get to know your network a little bit better.
Create innovative solutions with Paessler’s partners
Partnering with innovative vendors, Paessler unleashes synergies to create
new and additional benefits for joined customers.


UVnetworks
UVexplorer integrates tightly with PRTG to bring fast and accurate network discovery, detailed device inventory, and automatic network mapping to the PRTG platform.
“Easy to implement and configure with good technical support.”
R. v. S., ICT Manager at Heinen & Hopman Eng BV

PRTG: The multi-tool for sysadmins
Adapt PRTG individually and dynamically to your needs and rely on a strong API:- HTTP API: Access monitoring data and manipulate monitoring objects via HTTP requests
- Custom sensors: Create your own PRTG sensors for customized monitoring
- Custom notifications: Create your own notifications and send action triggers to external systems
- REST Custom sensor: Monitor almost everything that provides data in XML or JSON format
Tips from our knowledge base
PRTG comes with fast, friendly, and comprehensive support. We speak the same language as administrators. On business days, we usually answer inquiries within 24 hours. You will also find answers to many of your questions in our knowledge base.
Two tips on packet sniffing:
A tip on how to configure Cisco routers for NetFlow:
Still not convinced?
![]()
More than 500,000 sysadmins love PRTG
Paessler PRTG is used by companies of all sizes. Sysadmins love PRTG because it makes their job a whole lot easier.
Still not convinced?
![]()
Monitor your entire IT infrastructure
Bandwidth, servers, virtual environments, websites, VoIP services – PRTG keeps an eye on your entire network.
![]()
Try Paessler PRTG for free
Everyone has different monitoring needs. That’s why we let you try PRTG for free. Start now with your trial.
|
PRTG |
Network Monitoring Software - Version 24.2.94.1400 (April 10th, 2024) |
|
Hosting |
Download for Windows and cloud-based version PRTG Hosted Monitor available |
Languages |
English, German, Spanish, French, Portuguese, Dutch, Russian, Japanese, and Simplified Chinese |
Pricing |
Up to 100 sensors for free (Price List) |
Unified Monitoring |
Network devices, bandwidth, servers, applications, virtual environments, remote systems, IoT, and more |
Supported Vendors & Applications |
|
Combining the broad monitoring feature set of PRTG with IP Fabric’s automated network assurance creates a new level of network visibility and reliability.