![]()
Operating system monitoring
with PRTG

PRTG monitors Windows
PRTG monitors
Linux and macOS
PRTG uses SNMP, performance counters,
and WMI
PRTG is agentless monitoring
PRTG comes with
an alarm system
Operating system with PRTG
The starting point: Several different operating systems
![]() How PRTG defines sensors
How PRTG defines sensors
In PRTG, “sensors” are the basic monitoring elements. One sensor usually monitors one measured value in your network, e.g. the traffic of a switch port, the CPU load of a server, the free space of a disk drive. On average you need about 5-10 sensors per device or one sensor per switch port.
Many administrators work with a variety of network operating systems. Computers, servers, firewalls – the operating system landscape is vast.
PRTG stands out from the crowd as it is both customizable and compatible with all the major manufacturers.
![]()
Windows monitoring with PRTG
PRTG monitors the following Windows server/computer components: CPU, traffic, memory, hard drives, and much more. To do so, it uses Windows Management Instrumentation (WMI), performance counters, and SNMP. PRTG will even analyze applications such as Windows SharePoint and Microsoft SQL, Windows Event Log files, and the Windows Security Center. More on Windows Monitoring.
![]()
Linux monitoring with PRTG
PRTG monitors Linux operating systems, which means it can also monitor the performance of your servers. To do so, it uses the protocols SNMP and SSH. PRTG runs on popular distributions such as Ubuntu, Debian, CentOS, RedHat, and SUSE, and can also read data from other Linux distributions. More on Linux Monitoring.
![]()
Mac OS X monitoring with PRTG
PRTG also monitors macOS. Although it forms the basis for only the smallest of networks, macOS is often installed on workstations and sometimes even on servers. Here too, PRTG uses the SNMP protocol. Certain macOS systems (such as Yosemite - version 10.10) can also be monitored via SSH.
![]()
Other operating systems
Many network devices have their own operating systems. There are SonicWall firewalls, IBM servers, and Hyper-V virtualization solutions, just to name a few. The big advantage of PRTG is that it comes with sensors for specific manufacturers, as well as sensors that you can customize.
A sneak peek into monitoring with PRTG
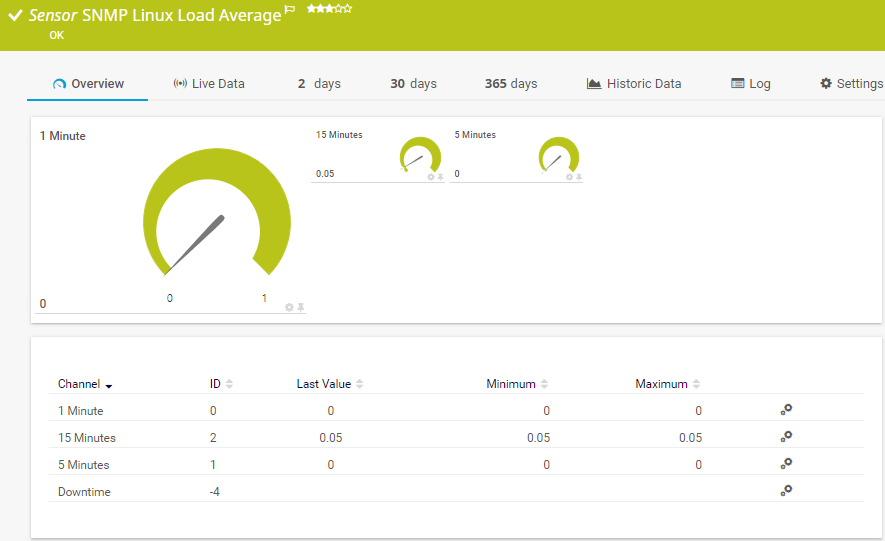
Sensor SNMP Linux Load Average
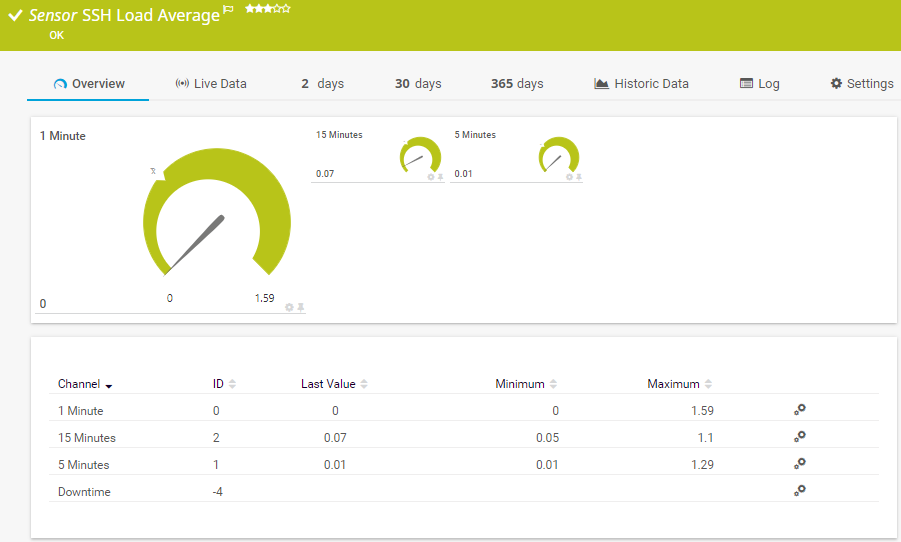
SSH sensors on a Linux device: 30-day graph
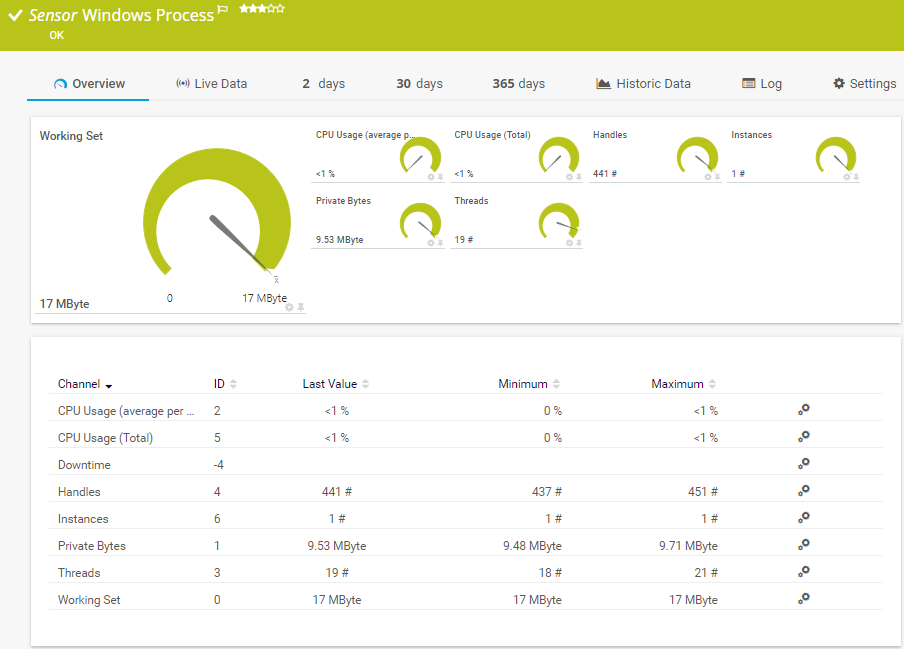
The Windows Process Sensor provides a clear overview of all Windows processes
Other sensors to help you get started
- SNMP sensors: Check out the many SNMP sensors of PRTG, which are specially designed for a variety of different manufacturers and operating systems.
- WMI/performance counter sensors: Explore our full range of predefined Windows sensors that run with Windows Management Instrumentation and performance counters.
- Common Sensors: Some of our most widely-used sensors include the Ping v2 Sensor, Port v2 Sensor, and HTTP v2 Sensor.
The advantages of PRTG
![]() Ping is a command-line utility, available on virtually any operating system with network connectivity, that acts as a test to see if a networked device is reachable. The ping command sends a request over the network to a specific device. A successful ping results in a response from the computer that was pinged back to the originating computer.
Ping is a command-line utility, available on virtually any operating system with network connectivity, that acts as a test to see if a networked device is reachable. The ping command sends a request over the network to a specific device. A successful ping results in a response from the computer that was pinged back to the originating computer.
Read more
![]()
For all popular operating systems
PRTG is compatible with all the most popular operating systems. These include Windows, as well as Linux with its many distributions. If you use several operating systems at the same time, then PRTG can serve as your central monitoring tool.
![]()
For custom monitoring
The PRTG “custom sensors” allow you to synchronize your monitoring with your network and your application ideas. PRTG adapts to your network and is single-source monitoring.
![]()
Quick configuration
The PRTG auto-discovery feature automatically searches for devices and sets up initial monitoring while the software is being configured. Auto Discovery uses ping queries and corresponding predefined device templates to save you precious time during setup.
Your operating system monitoring at a glance – even on the go
Set up PRTG in minutes and use it on almost any mobile device.


Agent monitoring and agentless monitoring
![]() WMI stands for Windows Management Instrumentation. Designed by Microsoft, it is an infrastructure for the standardized management of data and information that is device independent. Since Windows 2000, WMI comes preinstalled with Windows operating systems.
WMI stands for Windows Management Instrumentation. Designed by Microsoft, it is an infrastructure for the standardized management of data and information that is device independent. Since Windows 2000, WMI comes preinstalled with Windows operating systems.
Read more
Agentless monitoring: Standard for PRTG
With PRTG, you won’t need to install software on the devices you’ll be monitoring. Our network monitoring tool functions without “agents.” PRTG uses well-known protocols such as SNMP, WMI or performance counters, and SSH, all of which run on your target devices. As a result, you’ll keep the strain on your system to a minimum and be able to quickly get started with your monitoring.
Agent monitoring for distributed monitoring and load balancing
Monitoring several networks with one monitoring solution is usually not possible, or else accompanied by exorbitant costs. PRTG is different: Thanks to its remote probes, you can even monitor distributed networks. Here’s how it works: a remote probe is created on a server in an external network, allowing all the devices in that location to be monitored. Because remote probes can be configured on any Windows system, e.g. for load balancing, you can also use PRTG as an agent-based monitoring tool, even if you are not usually required to do so.
More on agentless monitoring vs. agent monitoring and distributed monitoring.
3 case studies that show why administrators use PRTG
"Our infrastructure cannot go down. Period. And if it does go down, it must be detected and resolved immediately. At this point we couldn't live without PRTG."
Jonathan Hoppe, Co-Founder,
Total Uptime Technologies
"PRTG is a noticeable improvement on our previous network monitoring software. It's simple to use, very flexible and saves me and my team a lot of time."
Brian Corbett, Senior Infrastructure Analyst, Trowers & Hamlins LLP
![]()
“Paessler’s no-nonsense pricing structure allows for immediate identification of costs without having to worry about hidden expenses down the road.”
William Hardy, information systems engineer at Westrope

Trusted by 500,000 users and recognized
by industry analysts as a leader

“Fantastic network and infrastructure monitoring solution that is easy to deploy and easier still to use. Simply the best available.”

“Software is absolutely perfect, Support is superior. Meets all needs and requirements, this is a must have solution if you are needing any form of monitoring.”

“The tool excels at its primary focus of being a unified infrastructure management and network monitoring service.”
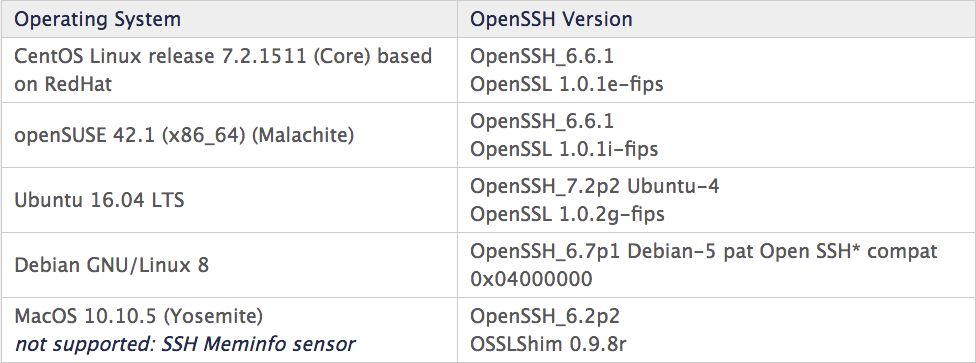
Which Linux and macOS distributions are compatible with PRTG?
We regularly test distributions. Some of these include various versions of CentOS, openSUSE, Ubuntu, Debian, macOS, Fedora, Gentoo, Red Hat Enterprise, and OpenSolaris. See our knowledge base for an overview of the SSH sensors that are used.
You can set up SNMP on most operating systems and then use it to query the respective systems (see the following blog article: How to Enable SNMP on Your Operating System). Here’s an excerpt from our knowledge base:

“Hey Greg, what would you tell administrators looking to monitor their Windows Server with PRTG?“
„PerfCounter custom sensors are some of the most useful sensors to be overlooked by users. Imagine SNMP sensors, but for Windows performance counters. Simply find out the name of the counter you wish you monitor. There’s a great knowledge base article on this topic.
Once you have the name, setting up the sensor is a piece of cake. It’s amazing to think of how many PerfCounters are really available for Windows applications, especially those which don’t come from Microsoft itself. These counters often offer insights into applications or processes which you may have once thought to be impossible.“
Greg Campion is a SysAdmin at PAESSLER AG.
PRTG is a vital tool for getting your IT into tip-top shape!
The costs for a one-year PRTG license pay for themselves in an average of only a few of weeks.
License costs vary according to the size of your network.
PRTG makes your network more reliable
PRTG saves network management costs
PRTG saves time spent on network management
Create innovative solutions with Paessler’s partners
Partnering with innovative vendors, Paessler unleashes synergies to create
new and additional benefits for joined customers.


ScriptRunner
With ScriptRunner, Paessler integrates a powerful event automation platform into PRTG Network Monitor.

“The greatest advantage of PRTG? You get to rest easy.“
Steffen Ille, Bauhaus-University of Weimar, Germany
“Easy to implement and configure with good technical support.”
R. v. S., ICT Manager at Heinen & Hopman Eng BV

PRTG: The multi-tool for sysadmins
Adapt PRTG individually and dynamically to your needs and rely on a strong API:- HTTP API: Access monitoring data and manipulate monitoring objects via HTTP requests
- Custom sensors: Create your own PRTG sensors for customized monitoring
- Custom notifications: Create your own notifications and send action triggers to external systems
- REST Custom sensor: Monitor almost everything that provides data in XML or JSON format
Still not convinced?
![]()
More than 500,000 sysadmins love PRTG
Paessler PRTG is used by companies of all sizes. Sysadmins love PRTG because it makes their job a whole lot easier.
Still not convinced?
![]()
Monitor your entire IT infrastructure
Bandwidth, servers, virtual environments, websites, VoIP services – PRTG keeps an eye on your entire network.
![]()
Try Paessler PRTG for free
Everyone has different monitoring needs. That’s why we let you try PRTG for free. Start now with your trial.
|
PRTG |
Network Monitoring Software - Version 24.2.94.1400 (April 10th, 2024) |
|
Hosting |
Download for Windows and cloud-based version PRTG Hosted Monitor available |
Languages |
English, German, Spanish, French, Portuguese, Dutch, Russian, Japanese, and Simplified Chinese |
Pricing |
Up to 100 sensors for free (Price List) |
Unified Monitoring |
Network devices, bandwidth, servers, applications, virtual environments, remote systems, IoT, and more |
Supported Vendors & Applications |
|


Combining the broad monitoring feature set of PRTG with IP Fabric’s automated network assurance creates a new level of network visibility and reliability.