![]()
Proactively fix application performance issues with PRTG application monitoring software
- Comprehensively monitor server, web, cloud, and virtualized apps
- Track the availability and performance of all kinds of applications
- Compatible with most standard enterprise applications like ERP systems and SAP
Our users give top ratings for monitoring with Paessler PRTG


PRTG application monitoring: What you’ll find on this page

- Enterprise networks need a steady rhythm – why application monitoring
- Comprehensive. Flexible. Easy to use: 3 reasons to choose PRTG as your application monitoring tool
- What application monitoring looks like in PRTG
- A complete view of your applications: How PRTG application monitoring service works
- Monitoring applications: FAQ
PRTG makes managing applications easy
Custom alerts and data visualizations make it easy to monitor, identify, and prevent status errors, unresponsive applications, and other performance issues.
Enterprise networks need a steady rhythm – why application monitoring
They pump the data, processing tools, and other vital resources your colleagues need to do their jobs well. And one small, skipped beat – or performance issue – can slow down your network to the point where your organization risks grinding to a halt.
Paessler PRTG provides a single unified view of every application on your network – from hardware-based apps to virtual systems – so it's easy to keep track of critical stats, spot problems before they cause disruption, and ensure your organization stays heart-healthy.
Comprehensive. Flexible. Easy to use: 3 reasons to choose PRTG as your application monitoring tool
All-in-one app monitoring
All your applications' critical stats, at your fingertips: server applications (databases, email, Exchange, …), cloud applications (Azure, AWS, Google Cloud, …), web applications (Zoom, Microsoft 365, …), virtualized applications (Citrix, VMware, Docker Container, …), plus standard Windows applications such as SharePoint, FTP, and Active Directory. If it runs on your network, PRTG can monitor it.
Real-time alerts & notifications
Pick your preferred warning and error thresholds for the various application performance metrics you want to keep an eye on and get notified as soon as an application is at risk of going under or over them, so you can ensure you're using your resources efficiently, avoid network disruption, and leave the office at a reasonable hour.
Endless customization possibilities
Can't find a preconfigured sensor for a specific app? You can easily create a custom sensor that's tailor-made to your needs. Pick the predefined PRTG sensor that most closely matches your requirements from our extensive library, and create your custom .exe script. PRTG will take it from there.
What application monitoring looks like in PRTG
Diagnose network issues by continuously monitoring server, cloud, web, and virtual applications across your network. Show application health, usage, and other performance stats in real time and visualize data in graphic maps & dashboards to identify problems more easily. Gain the visibility you need to troubleshoot and fix application performance issues.

Device tree view of the entire monitoring setup
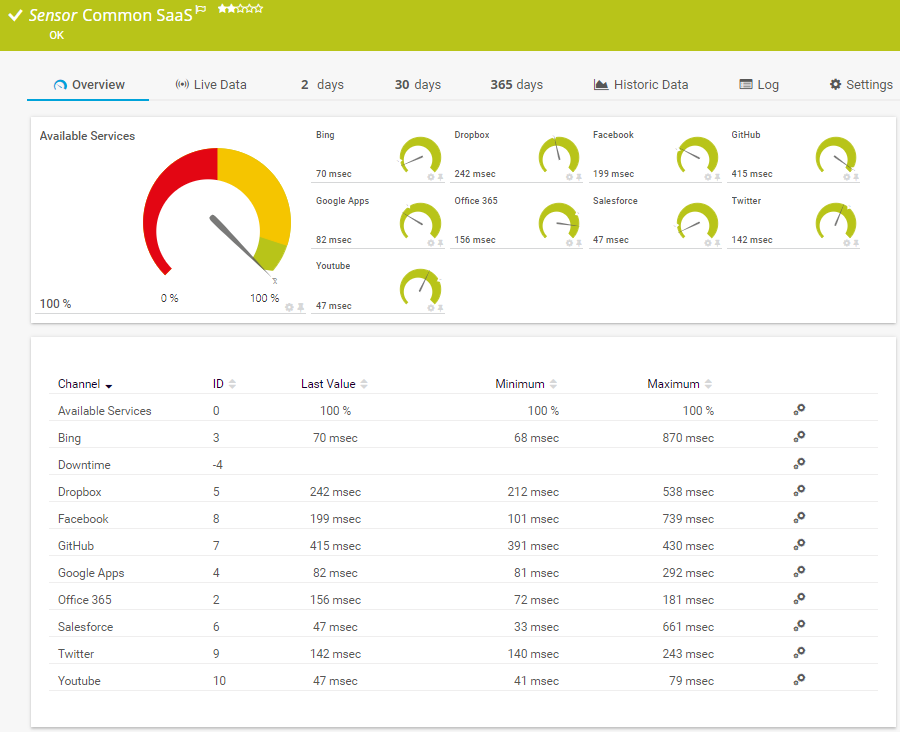
Common SaaS sensor in PRTG
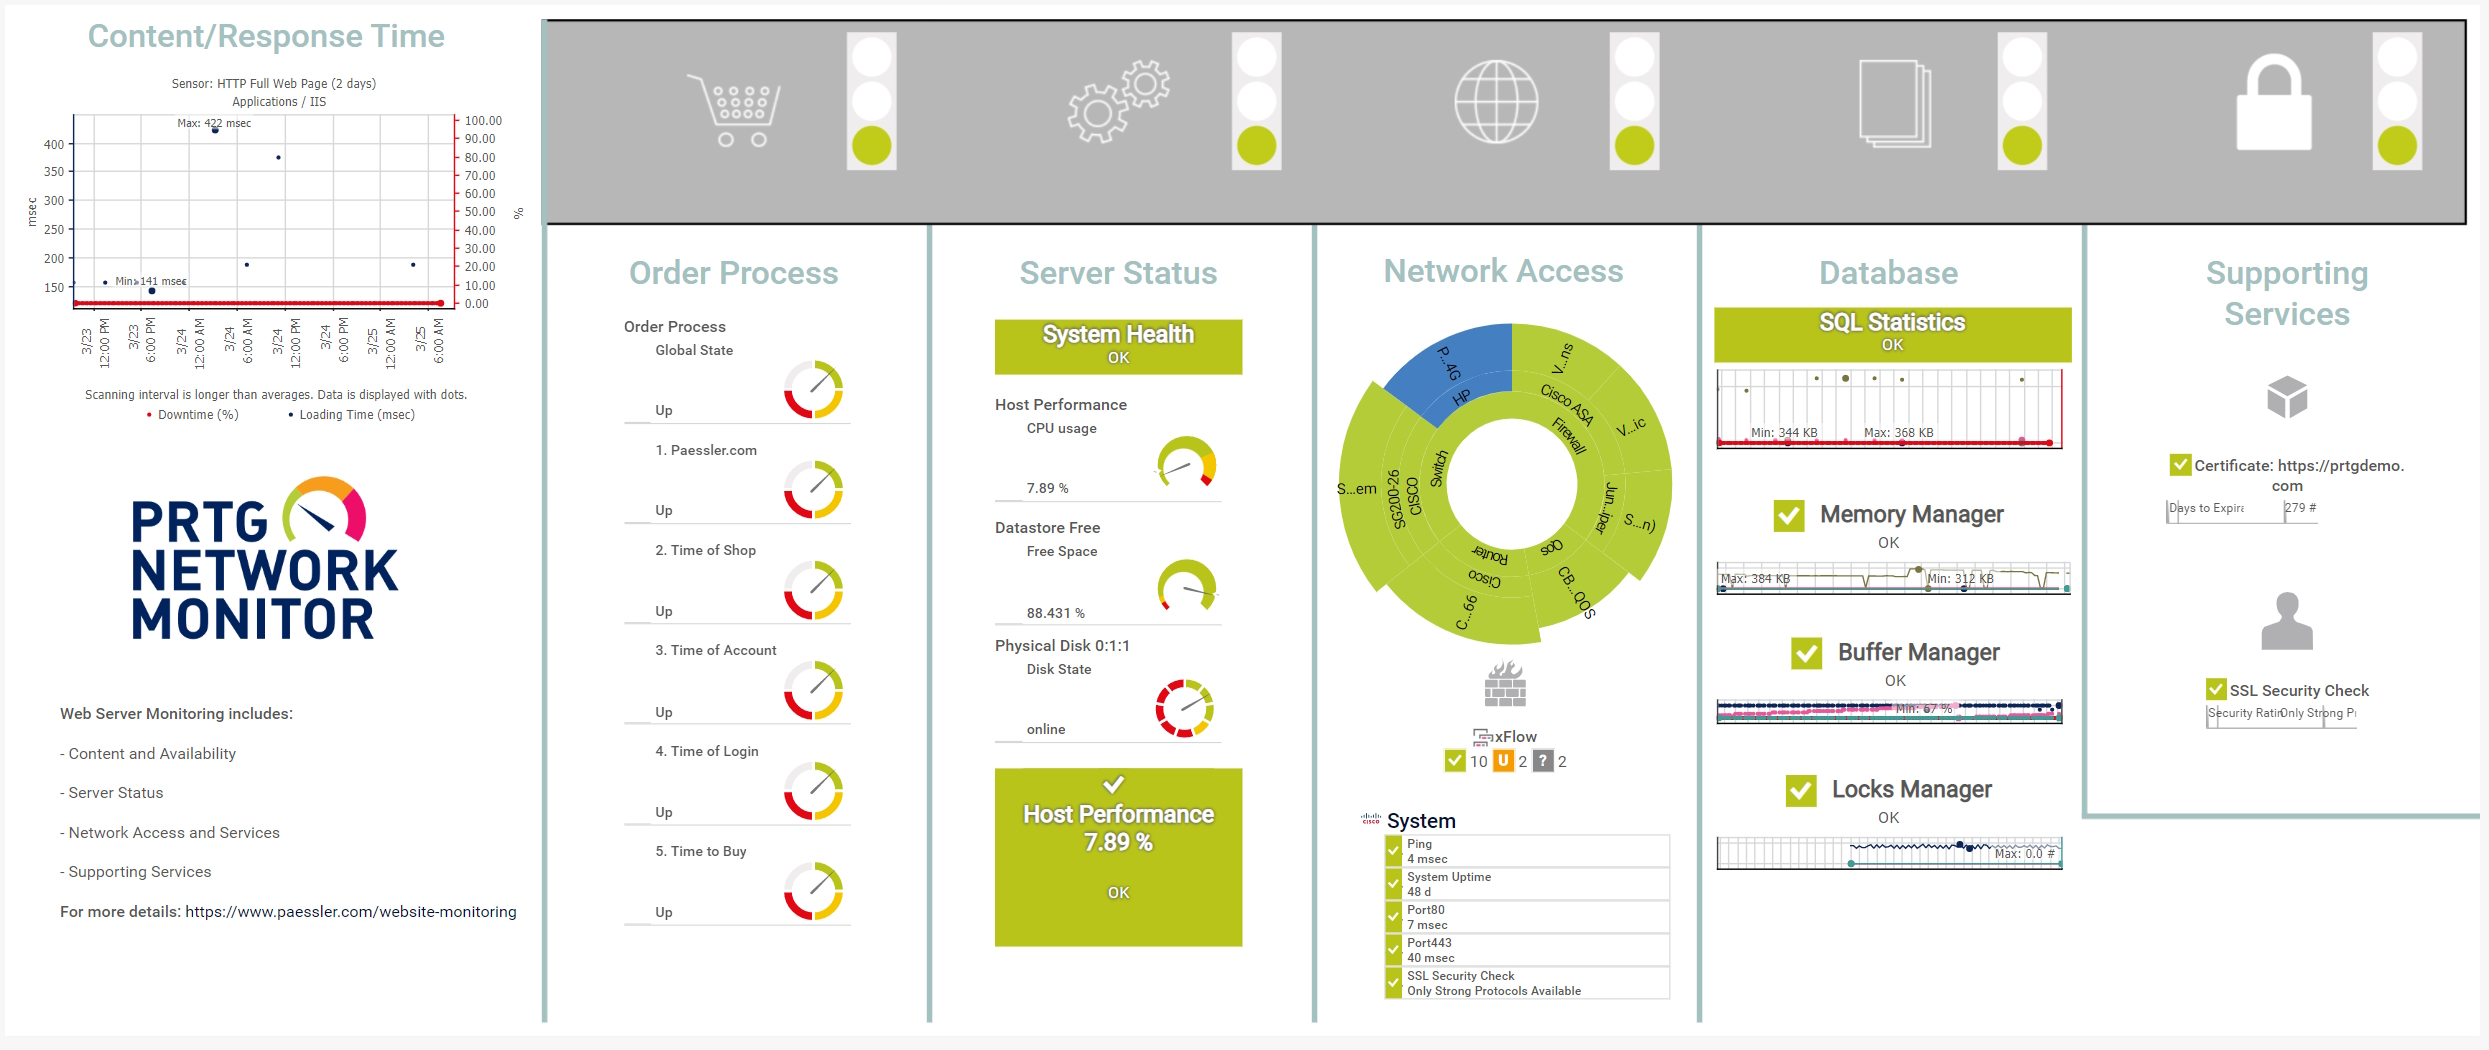
Custom PRTG dashboard for comprehensive web application monitoring
Start monitoring applications with PRTG and see how it can make your network more reliable and your job easier.
“All-around winning “The real beauty of PRTG is the endless possibilities it offers” “Outstanding cloud IT experts agree: Paessler PRTG is a great solution for IT infrastructure monitoring

network monitor”

monitoring”
A complete view of your applications: How PRTG application monitoring service works
PRTG monitors your applications, application servers, and services using sophisticated sensors. Each sensor tracks a specific variable, and the stats are brought together on a single, intuitive dashboard so you can keep an eye on every application that runs on your network from one place.
Just a few examples what PRTG's more than 250 preconfigured sensors can monitor:
Mail servers and applications
- IMAP, POP3, SMTP: response time, round-trip time
- MS Exchange: size of different mail queues, delivery times, latency
Backup solutions
- Active Directory: replication errors
- Veeam: status of backup jobs
- IMAP: checking email headers for specific strings
Cloud-based applications
- Amazon Web Services (AWS): subscription cost, status of AWS services
- Microsoft 365: email folder status, status of services
- Various SaaS solutions: availability of Bing, Dropbox, GitHub, Google apps, YouTube, …
Web application and services
- HTTP monitoring: loading time and response code of a web server
- Cloud HTTP: loading time of a web server from different locations worldwide
- Full web page: rendering an image of the current appearance of a website to create a visual history
- HTTP transactions: simulating a buying process
- Apache: activity and performance stats of an Apache web server
Your application monitor at a glance – even on the go
Set up PRTG in minutes and use it on almost any mobile device.


Easily find the source of the problem with our PRTG application monitoring solution
Real-time alerts and custom notifications make it easy to solve application status errors, unresponsive applications, and other issues.
PRTG is compatible with all major vendors, products, and systems
![]()
Create innovative solutions with Paessler’s partners
Partnering with innovative vendors, Paessler unleashes synergies to create
new and additional benefits for joined customers.

With ScriptRunner, Paessler integrates a powerful event automation platform into PRTG Network Monitor.
ScriptRunner
“Excellent tool for detailed monitoring. Alarms and notifications work greatly. Equipment addition is straight forward and server initial setup is very easy. ...feel safe to purchase it if you intend to monitor a large networking landscape.”
Infrastructure and Operations Engineer in the Communications Industry, firm size 10B - 30B USD
PRTG makes managing applications easy
Custom alerts and data visualizations make it easy to monitor, identify, and prevent status errors, unresponsive applications, and other performance issues.
Monitoring applications: FAQ
1. What is an application?
An application refers to a software program or set of programs designed to perform a specific task or function for end users, businesses, or other software applications. Applications are the tools that allow users to interact with computers and computer systems to accomplish various tasks.
There are various types of applications, including:
- Desktop applications: These are standalone programs that run on a user's computer. Examples include word processors, spreadsheet software, and graphic design tools.
- Web applications: These are applications accessed through web browsers over a network. Users interact with them by accessing a specific URL. Examples include email services or online banking.
- Server applications: These run on servers and provide services or data to other applications or end users. Examples include web servers, database servers, and email servers.
- Enterprise applications: These are large-scale software solutions used by businesses and organizations to manage their operations. Examples include Enterprise Resource Planning (ERP) systems, Customer Relationship Management (CRM) software, and Supply Chain Management (SCM) systems.
- Network applications: These are programs that facilitate communication and data exchange between devices on a network. Examples include file transfer protocols (FTP), email protocols (SMTP, IMAP), and network monitoring tools.
2. What is application monitoring?
Application monitoring involves the continuous tracking and analysis of software applications to ensure optimal performance, identify issues, and maintain a positive user experience. Application monitoring tools include monitoring various metrics such as response times, error rates, and resource utilization to detect anomalies or potential problems. This proactive approach allows IT teams to address issues promptly, minimize downtime, and optimize application performance.
3. What is application management?
Application management encompasses a broader set of activities involved in the lifecycle of an application. It includes tasks such as installation, configuration, updating, and overall administration of applications. Application management also involves activities related to user access, security, and ensuring that applications align with business objectives. It focuses on the overall governance and maintenance of applications throughout their lifecycle.
4. What is application performance monitoring (APM)?
APM specifically targets the performance aspects of applications. Application performance monitoring tools and practices are designed to monitor and analyze various performance metrics, such as response times, resource utilization, and error rates. The goal of APM is to identify bottlenecks, inefficiencies, or issues affecting the performance of an application. By closely monitoring these metrics, APM helps organizations optimize application performance, enhance user experience, and troubleshoot performance-related issues.
5. What is PRTG application monitoring?
PRTG is a proprietary software tool that tracks the availability and performance of every application that runs on your network. Available for Windows-based on-premises servers or as a cloud-hosted solution, it's capable of monitoring unlimited web applications, server applications, cloud applications, virtual applications, and more, bringing critical system data together in one simple, intuitive interface you can access from anywhere: at the office, at home, or on the go.
6. What else can PRTG monitor?
PRTG is way more than an application performance or web application monitoring tool: it can keep an eye on your whole IT infrastructure, no matter how complex. We have preconfigured sensors to track a wide range of values, including network traffic, bandwidth, cloud services, availability & uptime, ports, IP addresses, hardware health, network security, and web services. You can also monitor industrial IT and OT environments using OPC UA, MQTT, or Modbus, and create custom integrations with our API.
7. What is a sensor in PRTG?
In PRTG, “sensors” are the basic monitoring elements. One sensor usually monitors one measured value in your network, for example the traffic of a switch port, the CPU load of a server, or the free space on a disk drive.
On average, you need about 5-10 sensors per device or one sensor per switch port.

PRTG: The multi-tool for sysadmins
Adapt PRTG individually and dynamically to your needs and rely on a strong API:- HTTP API: Access monitoring data and manipulate monitoring objects via HTTP requests
- Custom sensors: Create your own PRTG sensors for customized monitoring
- Custom notifications: Create your own notifications and send action triggers to external systems
- REST Custom sensor: Monitor almost everything that provides data in XML or JSON format
More than just a monitoring tool:
Reasons our customers love PRTG


Paessler PRTG is used by companies of all sizes. Sysadmins love PRTG because it makes their job a whole lot easier. Bandwidth, servers, virtual environments, websites, VoIP services – PRTG keeps an eye on your entire network. Everyone has different monitoring needs. That’s why we let you try PRTG for free.Still not convinced?
![]()
More than 500,000
sysadmins love PRTG![]()
Monitor your entire IT infrastructure
![]()
Try Paessler PRTG
for free
![]()
Start monitoring applications with PRTG and see how it can make your network more reliable and your job easier.
|
PRTG |
Network Monitoring Software - Version 24.2.94.1400 (April 10th, 2024) |
|
Hosting |
Download for Windows and cloud-based version PRTG Hosted Monitor available |
Languages |
English, German, Spanish, French, Portuguese, Dutch, Russian, Japanese, and Simplified Chinese |
Pricing |
Up to 100 sensors for free (Price List) |
Unified Monitoring |
Network devices, bandwidth, servers, applications, virtual environments, remote systems, IoT, and more |
Supported Vendors & Applications |
|
Combining the broad monitoring feature set of PRTG with IP Fabric’s automated network assurance creates a new level of network visibility and reliability.