![]()
Database performance monitoring with PRTG

Optimize the performance
of your databases
Enjoy a quick and concise overview and detailed statistics
Be notified immediately in the event of errors and performance bottlenecks
Why is database performance monitoring important?
If the performance of your databases drops even a little, each and every process in your company can suffer. In today’s world, the effectiveness of business processes depends on quick and reliable databases.
Optimized databases make for faster applications
Quick databases will also improve the performance of your applications. In many instances, you can greatly increase the speed of your applications simply by optimizing your databases.
What is database performance monitoring?
With database performance monitoring, the performance of a specific
database is measured in real time. The performance of both the software
and hardware of database servers is taken into consideration. The goal is
to quickly identify problems and find ways to improve performance.
Trusted by 500,000 users and recognized
by industry analysts as a leader
by industry analysts as a leader

“Fantastic network and infrastructure monitoring solution that is easy to deploy and easier still to use. Simply the best available.”

“Software is absolutely perfect, Support is superior. Meets all needs and requirements, this is a must have solution if you are needing any form of monitoring.”

“The tool excels at its primary focus of being a unified infrastructure management and network monitoring service.”
Concise overview
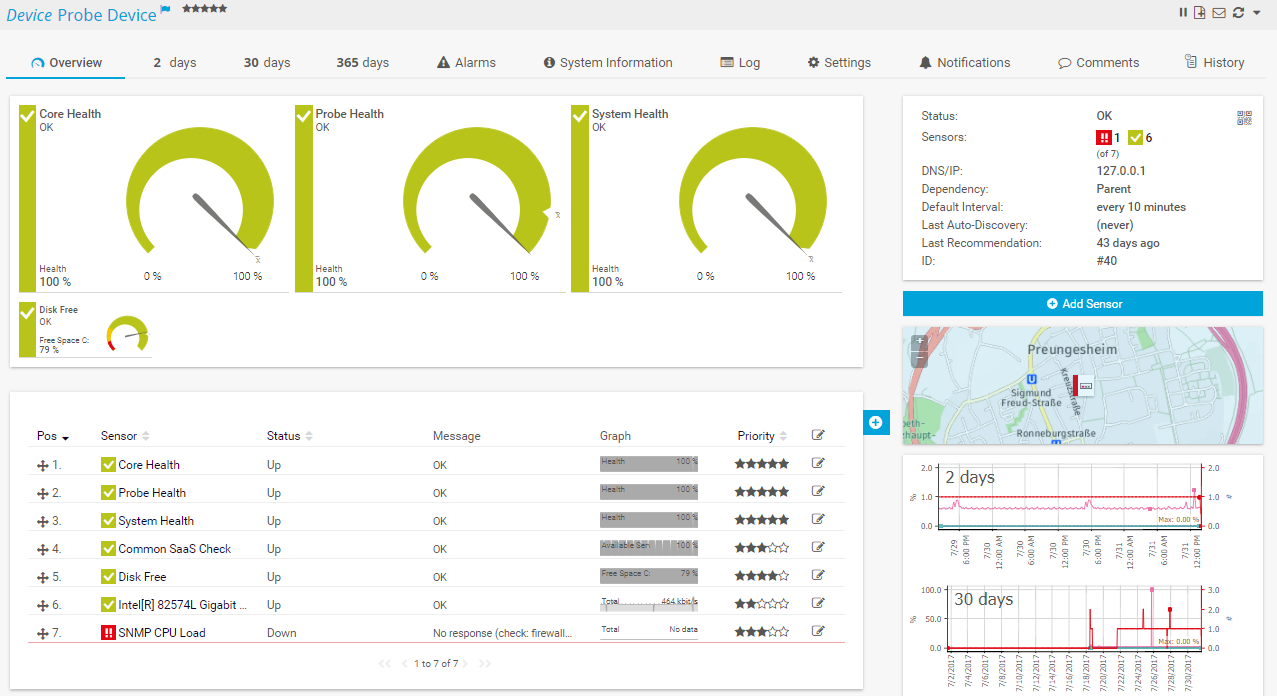
PRTG comes with customizable dashboards which provide you with an overview of all your databases. You can therefore keep a constant eye on query, connection, and return times, and immediately see if everything is OK in your network.
Detailed performance overview
Thanks to custom sensors and individual SQL queries, PRTG can also monitor specific datasets from your databases. For example, you'll be able to see if your online store is slow or if certain datasets are causing problems.
Prompt identification
of problems
Poor database performance may be the result of overloaded hardware or bandwidth bottlenecks. PRTG promptly sends you an alert so you can take the necessary action to stop downtime in its tracks. Your coworkers will thank you for it!
Compatibility with all
the biggest manufacturers
PRTG comes with a variety of preconfigured sensors for all the biggest database environments, including MySQL, Oracle SQL, Microsoft SQL, and PostgreSQL. For other databases, the ADO SQL v2 Sensor will often suffice.
How does PRTG measure database performance?
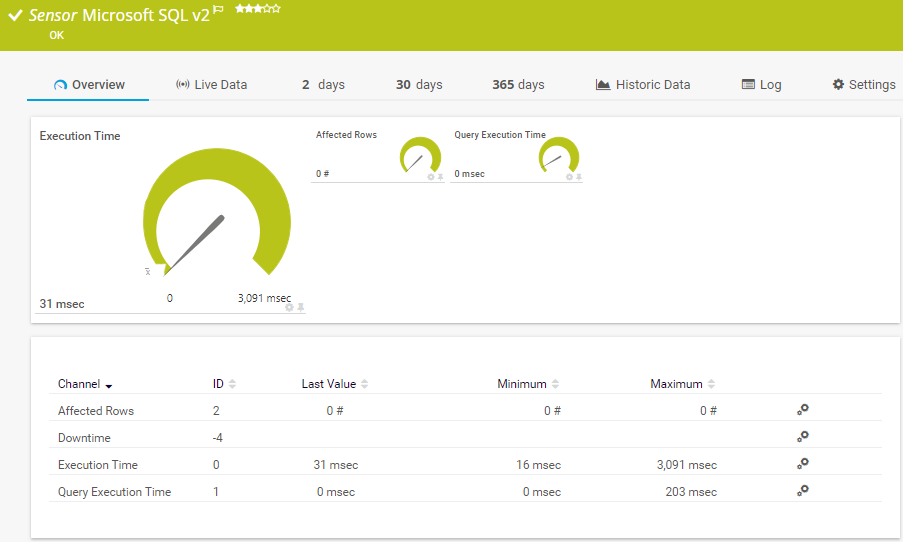
PRTG can monitor databases directly from the user’s perspective. To do so, it sends queries to the database server and measures the time required for each of the individual steps. You can also configure PRTG to monitor the return value, and define your own threshold values for the latter.
If one of these thresholds is exceeded, you’ll be informed immediately by email, SMS, or push notification.
What’s more, with PRTG you can monitor the performance of Microsoft SQL databases via WMI. PRTG displays values such as the SQL cache memory, as well as the number of batch requests and connections. Simply select all the values you wish to monitor while creating the sensor.
Bring your monitoring experience to the next level with our PRTG product extensions
Enhance the functionality of Paessler PRTG & benefit from an extended feature set for data export and advanced database monitoring.
Data extraction for easier monitoring data analysis
- Export raw monitoring data from PRTG & store it in your relational database – no programming skills needed
- Have all important data available in a single database
- Generate your own analyses & reporting using third-party tools
Database monitoring with extended database support
- Monitor the health & performance of databases that go beyond the standard PRTG set
- Use predefined SQL queries for easier setup of your database monitoring
- Manage and test database queries & share them in your team
Create innovative solutions with Paessler’s partners
Partnering with innovative vendors, Paessler unleashes synergies to create
new and additional benefits for joined customers.


With ScriptRunner, Paessler integrates a powerful event automation platform into PRTG Network Monitor.
ScriptRunner
PRTG in a nutshell
PRTG monitors your entire IT infrastructure
Use PRTG to monitor, for example, network traffic, applications, bandwidth, cloud services, databases, virtual environments, availability & uptime, ports, IP addresses, hardware status, network security, web services, and much more.
PRTG supports the most important technologies
Monitor your network for example via SNMP, flow protocols (NetFlow, jFlow, sFlow, IPFIX), SSH, WMI, or ping. PRTG also supports technologies used in Industrial IT & OT environments, such as OPC UA, MQTT, or Modbus. Use the powerful PRTG API for custom integrations (for example via Python, PowerShell, or REST).
PRTG can be used for any operating system
Download and install PRTG Network Monitor on a Windows system or use our cloud-based product PRTG Hosted Monitor for all other operating systems. What’s more: our native PRTG Desktop application runs on Windows or macOS – for even quicker access & multi-server views.
Still not convinced?
![]()
More than 500,000 sysadmins love PRTG
Paessler PRTG is used by companies of all sizes. Sysadmins love PRTG because it makes their job a whole lot easier.
Still not convinced?
![]()
Monitor your entire IT infrastructure
Bandwidth, servers, virtual environments, websites, VoIP services – PRTG keeps an eye on your entire network.
![]()
Try Paessler PRTG for free
Everyone has different monitoring needs. That’s why we let you try PRTG for free. Start now with your trial.
|
PRTG |
Network Monitoring Software - Version 24.2.94.1400 (April 10th, 2024) |
|
Hosting |
Download for Windows and cloud-based version PRTG Hosted Monitor available |
Languages |
English, German, Spanish, French, Portuguese, Dutch, Russian, Japanese, and Simplified Chinese |
Pricing |
Up to 100 sensors for free (Price List) |
Unified Monitoring |
Network devices, bandwidth, servers, applications, virtual environments, remote systems, IoT, and more |
Supported Vendors & Applications |
|