![]()
Optimize high-traffic networks
with PRTG sFlow monitoring

PRTG works with all sFlow-supported devices
PRTG captures sFlow packets and displays the data on a dashboard
PRTG sounds the alarm in the event of errors and malfunctions
PRTG monitors sFlows – one tool for everything
PRTG lets you use 100 free sensors for as long as you like
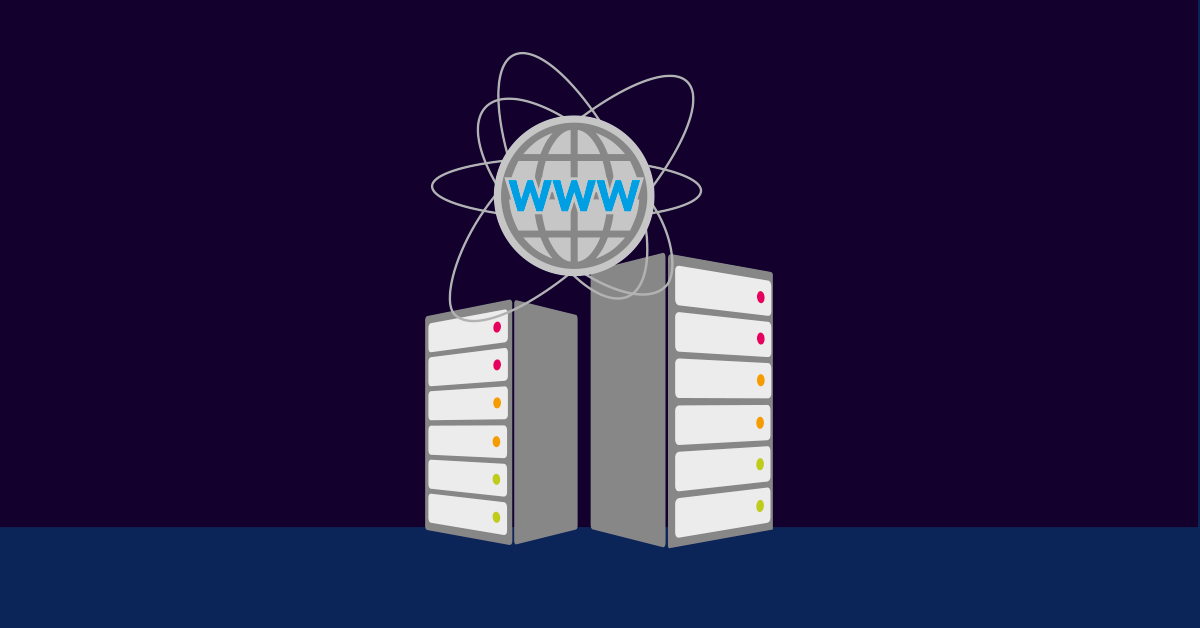
sFlow monitoring with PRTG Network Monitor
Effective traffic analysis of the industry standard sFlow
![]()
Productivity is the Alpha and the Omega
When heavily-utilized computer networks become slower or crash, corporate productivity is impaired, often resulting in financial losses.
Networks which quickly and accurately process and exchange data are an absolute must, and can guarantee trouble-free workflows and the proper “time to market” of your product. For high-traffic networks, it is therefore a good idea to monitor data traffic and available bandwidth. To do so, you can use the industry standard sFlow, and monitor professionally with PRTG.
![]()
sFlow technology
sFlow (short for "sampled flow") is a sampling technology for network monitoring invented by InMon. It works similarly to Cisco’s NetFlow, and was first introduced by HP. It stands for “sampled flow,” and uses statistical samples of data traffic to ensure scalability for interfaces with large amounts of data.
sFlow technology puts little strain on the CPU load and data line, and allows for the collection of detailed data. Because PRTG fully supports sFlow Version 5 (the most common version), switches and routers supplying data via sFlow can be monitored with a great deal of ease. PRTG offers several possibilities for individually processing the bandwidth consumption data that is gained as a result of its monitoring, as well as for the data’s subsequent presentation. PRTG lets you configure your dashboard so you can keep a constant eye on your data consumption!
![]()
Detect causes of traffic
With 24/7 network monitoring, you can identify the major sources of traffic and eliminate bottlenecks. The PRTG data analysis even allows for suspicious traffic to be detected. The combination of sFlow and PRTG effectively prevents downtime and provides valuable indicators which will enable you to optimize the overall performance of your network.
With PRTG, everyone will work with peace of mind.
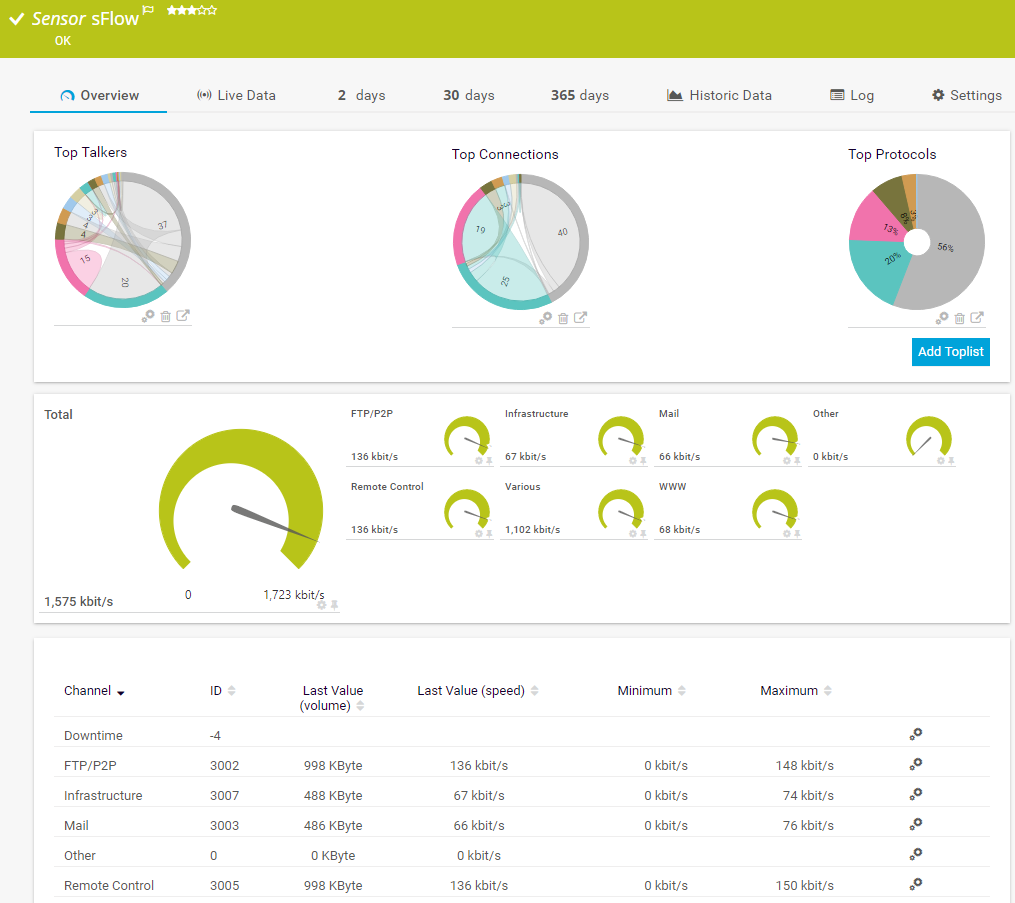
3 statistics collected by PRTG for your sFlow monitoring
Bandwidth consumption for individual connections
and the entire network
Network activities and causes of traffic according
to IP addresses, applications, and protocols
Toplists for a quick overview of the evolution of traffic over various periods of time
How sFlow monitoring works
The sFlow protocol is an industry standard for monitoring data packets in computer networks. Bandwidth utilization data is recorded and summarized inside the router or switch of the device (these processes are referred to as “flows”), while relevant information is sent as UDP packets to PRTG for statistical processing and presentation. With sFlow, you won’t analyze all your data traffic, but only every nth data packet. This method is called “sampling,” and is obligatory for sFlow. With NetFlow, sampling can be configured as required.
When it comes to monitoring bandwidth in high-traffic networks, flow monitoring is recommended the most, for in general it uses very little CPU (in contrast to protocols like packet sniffing) can provide in-depth data analysis while consuming minimal amounts of bandwidth.
To use sFlow monitoring, your network device must support sFlow version 5 and be configured to allow flow data to be sent to PRTG.

sFlow-Sensor
Your network traffic at a glance – even on the go
Set up PRTG in minutes and use it on almost any mobile device.


Trusted by 500,000 users and recognized
by industry analysts as a leader

“Fantastic network and infrastructure monitoring solution that is easy to deploy and easier still to use. Simply the best available.”

“Software is absolutely perfect, Support is superior. Meets all needs and requirements, this is a must have solution if you are needing any form of monitoring.”

“The tool excels at its primary focus of being a unified infrastructure management and network monitoring service.”
6 Advantages of PRTG
![]()
Alarms
With PRTG you are automatically informed about network problems and protocol errors by email, push message, SMS and other methods - often before costly failures occur.
![]()
Speed up troubleshooting
Correct potential errors at an early stage and prevent network failures through detailed data display.
![]()
Stabilize your network
Detect bandwidth eaters, reduce unnecessary traffic and scale the available bandwidth in time.
![]()
Increase productivity
Accelerate business processes through bandwidth optimization. Maximize service availability.
![]()
Simplify analyses
Clear traffic visualizations help you to better understand correlations in network connections.
![]()
Improve security
Detect suspicious traffic and detect malware.
How to choose the right sFlow collector tool
![]()
sFlow packets
Flows are push protocols that can be sent by target devices such as routers or switches. The same goes for sFlows: A monitoring tool is used to capture sFlow packets and process them at set intervals. These intervals can be adjusted in accordance with the amount of load you wish to generate.
![]()
sFlow collector tools
There are many different sFlow collectors on the market, including open-source tools like Nagios and proprietary software such as SolarWinds and PRTG. Each has its pros and cons. Open-source tools are considerably harder to configure. The advantage of PRTG: the collection and processing of sFlows is included. See our comparison of network monitoring tools here.
![]()
PRTG sFlow collecting software
PRTG comes with two sensors for sFlows: the sFlow Sensor and the sFlow (Custom) Sensor. Among other things, the preconfigured sFlow Sensor monitors traffic then sorts it into various channels according to standard categories and protocols. The sFlow (Custom) Sensor can be customized to monitor or analyze something specific, such as the traffic of a certain source or target.

“The great advantage of PRTG is that it comes with an incredibly intuitive user interface and a practical, automated scan function for adding sensors. Its alarm system is also super slick and can be customized for each individual sensor.”
Thomas Clauw, IT Manager at RougeGorge, which monitors more than 240 of its stores worldwide with PRTG.To the case study
FAQ: sFlow and sFlow tools
What is sFlow?
sFlow is a standard used to monitor large computer networks. It monitors random samples of the traffic that runs through routers and switches. The standard was first introduced in 2001 in RFC 2176.
What is the recommended sFlow sampling rate?
The default sFlow sampling rate is 8192. We do not however recommend a fixed sampling rate. The rate should be set in accordance with the amount of load you can (or wish) to generate and the extent to which you wish to monitor your network traffic. The less frequent the random sample, the lighter the load.
Which manufacturers use sFlow?
Many manufacturers use sFlow as a standard in their devices. Among others, these include Alcatel-Lucent Enterprise, Arista Networks, Cisco, Dell, Extreme Networks, Fortinet/Fortigate, Huawei, Hitachi, Juniper Networks, NEC, and Netgear. However, these manufacturers do not use the standard for all their devices.
What is the difference between a sFlow collector, viewer, and analyzer?
These terms often refer to the same thing. A collector collects (captures) the sFlows, a viewer displays them, and an analyzer prepares the data as a report or a graph. PRTG does all three.
Why do I need an sFlow tool?
sFlow tools are useful for analyzing traffic. Our sFlow sensors provide you with an overview of (among other things) the various types of traffic as well as the connections, sources, and protocols in your network. PRTG monitors continuously, allowing you to track the evolution of your traffic. In the event of downtime or malfunctions, you’ll be notified at once.
sFlow vs. NetFlow – Protocols and packet data at a glance
sFlow vs. NetFlow
NetFlow is a standard that was developed by Cisco. sFlow is based on this standard, but with two major differences: sFlow is an open standard, and only sends every nth packet, or a random sample. There is however no difference in the data of the packets, which means you can perform the same packet analysis. More on NetFlow monitoring.
sFlow vs. IPFIX
IPFIX (IP Flow Information Export) is an advanced form of NetFlow. The IPFIX standard was developed by the IETF and is manufacturer-independent. IPFIX is a push protocol that sends data such as mail traffic, file transfer traffic, and web traffic. Because it is relatively new, the IPFIX protocol is often found in the newer devices of manufacturers such as Dell, Juniper Networks, and HP. IPFIX can also be configured to work with random samples. More on IPFIX monitoring
Create innovative solutions with Paessler’s partners
Partnering with innovative vendors, Paessler unleashes synergies to create
new and additional benefits for joined customers.


UVnetworks
UVexplorer integrates tightly with PRTG to bring fast and accurate network discovery, detailed device inventory, and automatic network mapping to the PRTG platform.
“Easy to implement and configure with good technical support.”
R. v. S., ICT Manager at Heinen & Hopman Eng BV

PRTG: The multi-tool for sysadmins
Adapt PRTG individually and dynamically to your needs and rely on a strong API:- HTTP API: Access monitoring data and manipulate monitoring objects via HTTP requests
- Custom sensors: Create your own PRTG sensors for customized monitoring
- Custom notifications: Create your own notifications and send action triggers to external systems
- REST Custom sensor: Monitor almost everything that provides data in XML or JSON format
PRTG makes your job easier
Our monitoring software frees you to focus on other tasks by promptly notifying you of potential issues.
![]()
Save effort
PRTG gives you one central monitoring tool for your servers and entire network. Enjoy a quick overview of your whole infrastructure via our dashboard and app.
![]()
Save time
Getting started with PRTG is a breeze. Setting up or switching from another network monitoring tool is easy thanks to the auto-discovery and pre-configured device templates.
![]()
Save money
80% of our customers report substantial cost savings with network monitoring. Your costs of licenses will likely pay for themselves within weeks.
Still not convinced?
![]()
More than 500,000 sysadmins love PRTG
Paessler PRTG is used by companies of all sizes. Sysadmins love PRTG because it makes their job a whole lot easier.
Still not convinced?
![]()
Monitor your entire IT infrastructure
Bandwidth, servers, virtual environments, websites, VoIP services – PRTG keeps an eye on your entire network.
![]()
Try Paessler PRTG for free
Everyone has different monitoring needs. That’s why we let you try PRTG for free. Start now with your trial.
|
PRTG |
Network Monitoring Software - Version 24.2.94.1400 (April 10th, 2024) |
|
Hosting |
Download for Windows and cloud-based version PRTG Hosted Monitor available |
Languages |
English, German, Spanish, French, Portuguese, Dutch, Russian, Japanese, and Simplified Chinese |
Pricing |
Up to 100 sensors for free (Price List) |
Unified Monitoring |
Network devices, bandwidth, servers, applications, virtual environments, remote systems, IoT, and more |
Supported Vendors & Applications |
|

Combining the broad monitoring feature set of PRTG with IP Fabric’s automated network assurance creates a new level of network visibility and reliability.