![]()
Comprehensive SQL monitoring software for detailed database insights
- Monitor Oracle SQL, MySQL, PostgreSQL, and MS SQL databases
- Reduce SQL server downtime and optimize performance
- See the execution time and more of your SQL queries at a glance
Our users give top ratings for monitoring with Paessler PRTG


Why choose PRTG SQL server monitoring
PRTG makes SQL server monitoring easy
Custom alerts and data visualization make it easy to monitor, identify, and prevent SQL server issues.
Monitor SQL server performance and more: 3 advantages of using PRTG
Before you can improve SQL server and database performance, you need to get detailed information about the current execution speed or the CPU usage of your SQL servers, for example. Our comprehensive SQL server performance monitoring tool Paessler PRTG has got you covered here.
Get a concise overview of your SQL database
Measure the time an SQL query needs for its entire request, including establishing the connection, executing the query, handling the transaction, and terminating the connection. You can also monitor and process your query's return values.
Monitor different kinds of SQL environments
With PRTG, you can easily monitor several SQL server instances. For quick integration, PRTG comes with preconfigured sensors for all major databases, such as Microsoft SQL and Oracle SQL, or MySQL and PostgreSQL.
Quickly identify the cause of database errors
Collect real-time data on various database server metrics such as CPU usage, memory utilization, disk space, or query execution time. PRTG immediately notifies you about any unusual behavior or performance bottlenecks that could be the cause for database errors.
What SQL server monitoring looks like in PRTG
Diagnose database issues by continuously monitoring your SQL servers. Show response times, performance, and database load in real time and visualize data in graphic maps & dashboards to identify problems more easily. Gain the visibility you need to troubleshoot database issues of any kind.
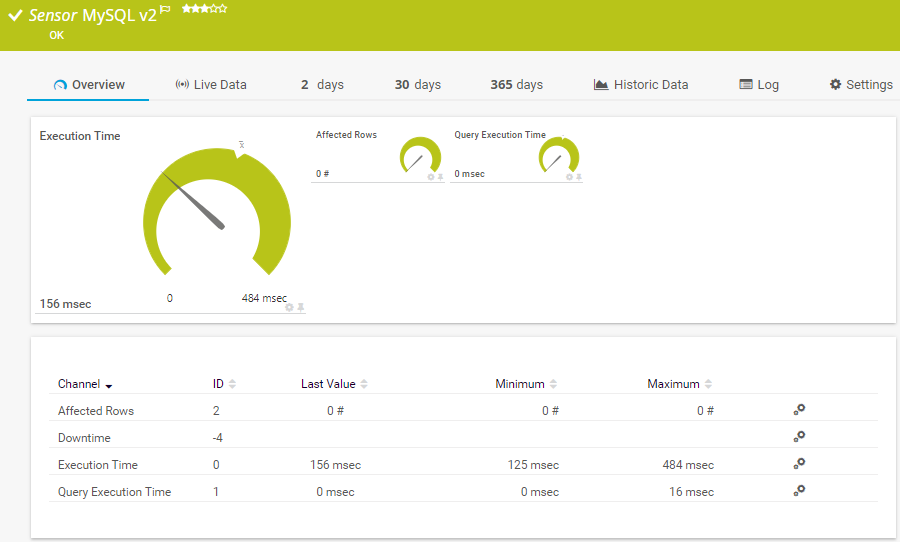
MySQL v2 sensor in PRTG
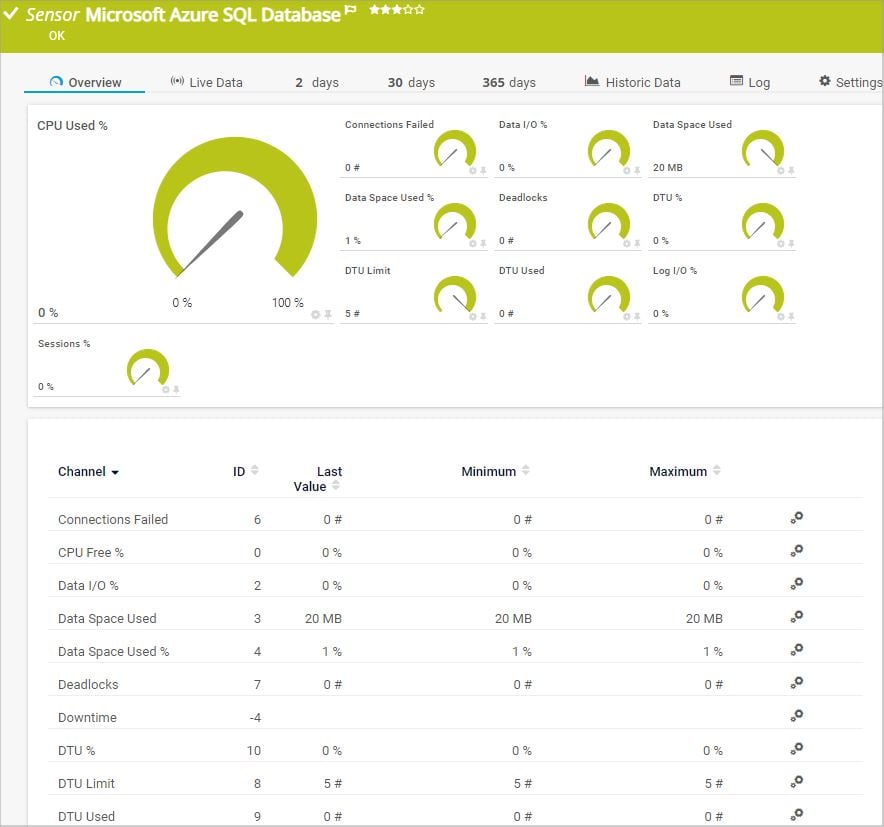
Microsoft Azure SQL Database sensor in PRTG
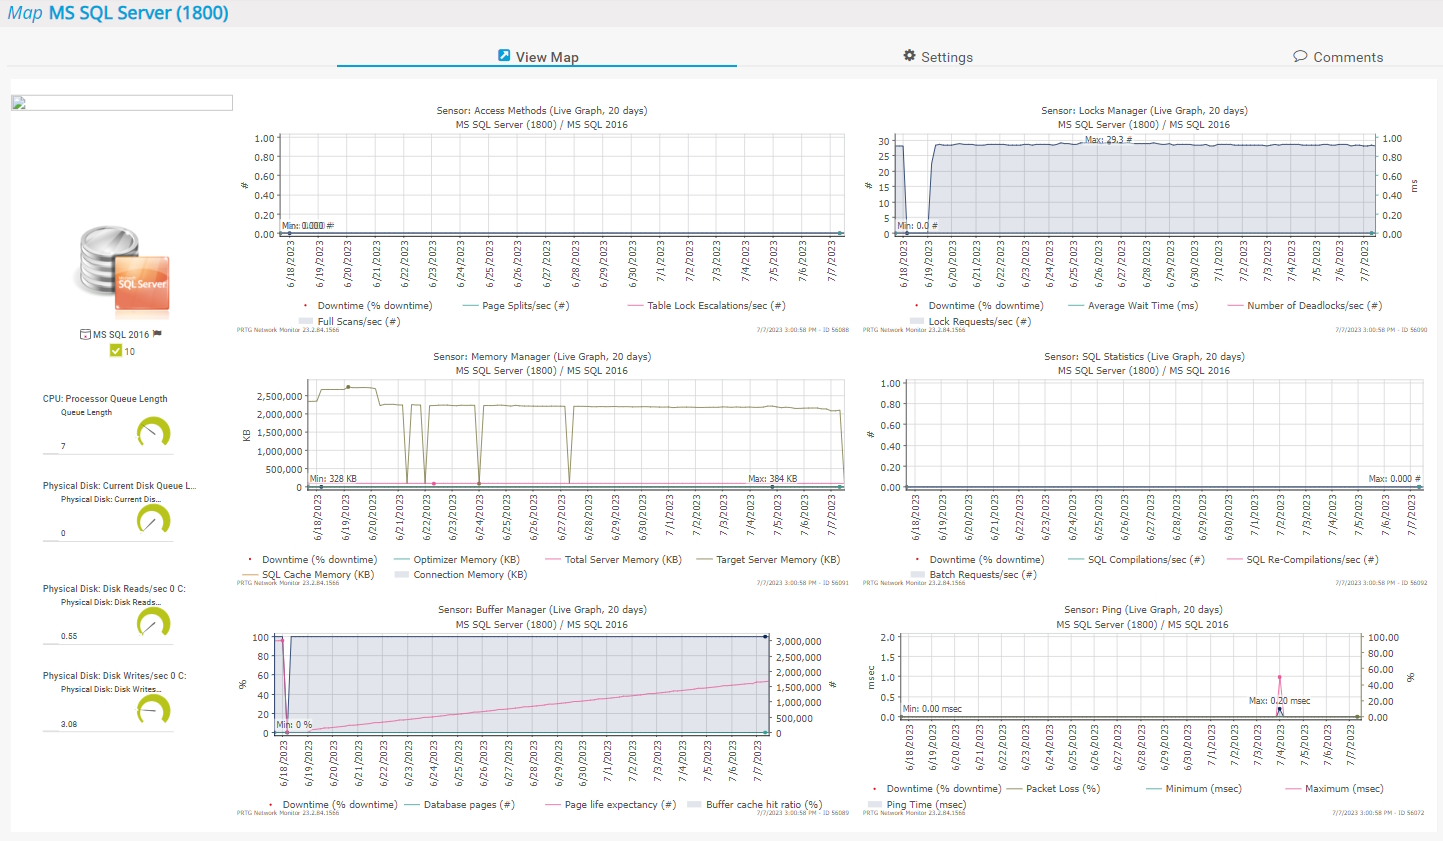
Custom PRTG dashboard for MS SQL monitoring
Start SQL server monitoring with PRTG and see how it can make your network more reliable and your job easier.
3 examples of how you can benefit from SQL server monitoring with PRTG
Ticket system: Be alerted before the system crashes
A company uses a ticket system to process orders. During peak hours, several orders are arriving at the same time. PRTG immediately sees that the ticket system is overloading and informs designated team members via customizable notifications. This way, they can quickly take action before the system crashes.
Online store: Know when you should stock up on supplies
Most online stores have a direct link to their warehouse management systems. As sales increase, a company’s stock decreases. If, for example, the number of goods falls below a specified threshold, PRTG automatically informs the responsible employees so they can order new goods. Even suppliers can be informed via the PRTG notification system.
Get informed about your website visitors and sales
How many visitors are currently on your website? How much revenue was generated in sales? How high are your current online advertising costs? PRTG helps you stay informed round the clock, for example with easy-to-understand dashboards that you can also show to your team or the management on a screen during a meeting.
SQL server monitoring: Use these PRTG sensors for monitoring the various database systems
![]() How PRTG defines sensors
How PRTG defines sensors
In PRTG, “sensors” are the basic monitoring elements. One sensor usually monitors one measured value in your network, e.g. the traffic of a switch port, the CPU load of a server, the free space of a disk drive. On average you need about 5-10 sensors per device or one sensor per switch port.
MySQL
MySQL is an open-source database management system that runs on almost all platforms. Keep a constant eye on performance with our MySQL monitoring tool. Monitor the reachability and response time of your databases.
Use the MySQL v2 sensor to monitor the execution time of the entire SQL request and the specified SQL query, as well as the number of rows addressed by the query.
Microsoft SQL Server
SQL Server is a data platform from Microsoft. It is a relational database management system and works as an intelligent database that increases the execution speed of database operations and optimizes the processing of queries.
Use the Microsoft SQL v2 sensor to monitor the execution time of the entire SQL request and the specified SQL query, as well as the number of rows addressed by the query.
Or deploy WMI Microsoft SQL Server sensors, for example the WMI Microsoft SQL Server 2019 sensor, that measure detailed performance metrics of a Microsoft SQL Server via WMI.
Microsoft Azure SQL Database
Azure SQL Database is a fully managed relational database management system for the cloud that is provided as part of Microsoft Azure services. It handles database management tasks such as patches, upgrades, or backups.
Use the Microsoft Azure SQL Database sensor to monitor data usage, CPU usage, the number of failed connections, I/O operations, DTUs and eDTUs, sessions, and more of a single database or an elastic pool.
PostgreSQL
PostgreSQL is a free, object-relational database management system. It is developed by an open-source community and complies as much as possible with the SQL standard. PostgreSQL also has its own specific extensions, which makes it popular among system administrators and developers.
Use the PostgreSQL sensor to monitor the execution time of the entire SQL request and the specified SQL query, as well as the number of rows addressed by the query.
Oracle SQL
Oracle provides one of the leading relational database management systems. Oracle SQL does not fully comply with the SQL standard, partly because its first versions were released before SQL was formalized by the American National Standards Institute.
Use the Oracle SQL v2 sensor to monitor the execution time of the entire SQL request and the specified SQL query, as well as the number of rows addressed by the query.
SAP SQL & other SQL database systems
If you want to monitor your SAP databases, you can use PRTG to obtain monitoring data by way of CCMS and SAP or directly from SAP. You’ll enjoy fully agentless monitoring that far surpasses the capacities of standard monitoring tools such as SAP Solution Manager.
Or do you use a different SQL-based database system? Our ADO SQL v2 sensor monitors any data source made available via OLE DB or ODBC. What’s more: you can also use the sensor to monitor your cloud databases.
“All-around winning “The real beauty of PRTG is the endless possibilities it offers” “Outstanding cloud IT experts agree: Paessler PRTG is a great solution for IT infrastructure monitoring

network monitor”

monitoring”
Easily find the source of the problem with our PRTG SQL server monitoring solution
Real-time alerts and custom notifications make it easy to solve issues with your SQL databases.
More than just an SQL monitoring tool: PRTG is the only network monitoring tool you need
With PRTG, you not only monitor all important SQL server performance metrics but also keep track of other performance data and the overall status of your network and devices.
Network bandwidth
How much traffic passes through your network? When and where do spikes in bandwidth usage occur? How does your traffic change over time? PRTG tells you all this and more. As a result, you can take all the necessary precautions to ensure that your network is running at optimal capacity.
Network protocols
PRTG uses a variety of network protocols for monitoring your entire network, such as SNMP, WMI, SSL, HTTP, FTP, SSH, or DHCP. By keeping track of your IT infrastructure using these protocols, you ensure the smooth functioning and optimal performance of your network.
PRTG is compatible with all major vendors, products, and systems
![]()
Your SQL server monitor at a glance – even on the go
Set up PRTG in minutes and use it on almost any mobile device.


PRTG makes SQL server monitoring easy
Custom alerts and data visualization make it easy to monitor, identify, and prevent SQL server issues.
Create innovative solutions with Paessler’s partners
Partnering with innovative vendors, Paessler unleashes synergies to create
new and additional benefits for joined customers.


With ScriptRunner, Paessler integrates a powerful event automation platform into PRTG Network Monitor.
ScriptRunner
Oliver Jähn, IT Manager at the University of Bonn![]()
“For us, PRTG Network Monitor is the most effective tool for monitoring our IT infrastructure in the long run.”
SQL server monitoring: FAQ
1. What is SQL server monitoring?
SQL server monitoring lets you keep a constant eye on the performance of your SQL databases. The process is continuous and automated, allowing you to immediately identify dips in performance and intervene at once.
2. How do I monitor the performance of my SQL server?
You can monitor SQL server performance with preconfigured SQL sensors in PRTG. Such a sensor automatically sends monitoring data to a central overview in PRTG. You should also monitor your server hardware (CPU, RAM, etc.).
3. How do I automate my SQL server monitoring?
PRTG is an automated monitoring tool that saves you lots of precious time. If something goes wrong in your network, PRTG notifies you at once. What’s more, you can also define your own threshold values and notification settings.
4. Which monitoring tools are available for my SQL server?
In addition to PRTG, there are other SQL server monitoring tools such as Nagios, SolarWinds, or WhatsUp Gold. Some tools monitor your entire network while others specialize in a single area such as SQL databases. The tools also differ in price and performance. The advantage of our all-in-one monitoring software PRTG: you get one central monitoring tool for your entire IT infrastructure. Find more monitoring tool comparisons here.
5. What is a sensor in PRTG?
In PRTG, “sensors” are the basic monitoring elements. One sensor usually monitors one measured value in your network, for example the traffic of a switch port, the CPU load of a server, or the free space on a disk drive.
On average, you need about 5-10 sensors per device or one sensor per switch port.
Bring your monitoring experience to the next level with our PRTG product extensions
Enhance the functionality of Paessler PRTG & benefit from an extended feature set for data export and advanced database monitoring.
Data extraction for easier monitoring data analysis
- Export raw monitoring data from PRTG & store it in your relational database – no programming skills needed
- Have all important data available in a single database
- Generate your own analyses & reporting using third-party tools
Database monitoring with extended database support
- Monitor the health & performance of databases that go beyond the standard PRTG set
- Use predefined SQL queries for easier setup of your database monitoring
- Manage and test database queries & share them in your team

PRTG: The multi-tool for sysadmins
Adapt PRTG individually and dynamically to your needs and rely on a strong API:- HTTP API: Access monitoring data and manipulate monitoring objects via HTTP requests
- Custom sensors: Create your own PRTG sensors for customized monitoring
- Custom notifications: Create your own notifications and send action triggers to external systems
- REST Custom sensor: Monitor almost everything that provides data in XML or JSON format
Easily find the source of the problem with our PRTG SQL server monitoring solution
Real-time alerts and custom notifications make it easy to solve issues with your SQL databases.
More than just a monitoring tool:
Reasons our customers love PRTG


Paessler PRTG is used by companies of all sizes. Sysadmins love PRTG because it makes their job a whole lot easier. Bandwidth, servers, virtual environments, websites, VoIP services – PRTG keeps an eye on your entire network. Everyone has different monitoring needs. That’s why we let you try PRTG for free.Still not convinced?
![]()
More than 500,000
sysadmins love PRTG![]()
Monitor your entire IT infrastructure
![]()
Try Paessler PRTG
for free
![]()
Start SQL server monitoring with PRTG and see how it can make your network more reliable and your job easier.
|
PRTG |
Network Monitoring Software - Version 24.2.94.1400 (April 10th, 2024) |
|
Hosting |
Download for Windows and cloud-based version PRTG Hosted Monitor available |
Languages |
English, German, Spanish, French, Portuguese, Dutch, Russian, Japanese, and Simplified Chinese |
Pricing |
Up to 100 sensors for free (Price List) |
Unified Monitoring |
Network devices, bandwidth, servers, applications, virtual environments, remote systems, IoT, and more |
Supported Vendors & Applications |
|
Combining the broad monitoring feature set of PRTG with IP Fabric’s automated network assurance creates a new level of network visibility and reliability.