![]()
PRTG: The all-in-one
web server monitoring solution

PRTG monitors the availability of your web servers
PRTG monitors CPU, memory, and web server performance
PRTG monitors your website and its load times
Monitoring sensors for Apache, NGINX, IIS, and more
Monitoring via HTTP, Ping, SNMP, and more
Web server monitoring with PRTG
What you’ll find on this page
- A central tool, compatible with all major web server manufacturers
- Availability and performance are crucial
- Monitor the web server: These are the parameters that matter on
- Web server monitoring tutorial: How PRTG can help you on a daily basis
- Web server monitoring tool: stationary or cloud-based
- Questions about web servers
- Keep a constant eye on your website
- How PRTG monitors your web server
- PRTG sensors for monitoring your website
- PRTG is your all-in-one web server monitoring tool
A central tool, compatible with all major web server manufacturers
PRTG is compatible with the major web server manufacturers. With preconfigured sensors,
you save time during set-up. In addition, we offer custom sensors, enabling you to customize
your monitoring. The big advantage of system administrators: You can monitor many different
manufacturers centrally with one tool.
Apache web server monitoring
The Apache HTTP server is one of the most used web servers. It is an open-source project. Our Monitoring Tool uses the Apache module "mod_status“ to read data. You can use several preconfigured sensors, for example, the HTTP Apache ModStatus PerfStats sensor and the HTTP Apache ModStatus Totals sensor.
Monitor IIS web servers
With the Internet Information Services (IIS), Microsoft offers the option of setting up web servers. IIS are integrated in Microsoft services as a module. PRTG offers you various possibilities of monitoring your IIS web server, for example, using the Performance Counter and WMI. Read more about IIS Monitoring.
NGINX web servers at a glance
NGINX web servers ("Engine X") are often used as an alternative to Apache web servers. They are considered powerful. However, the configuration of NGINX is different. Instructions: How to set up a custom sensor for NGINX.
Availability and performance are crucial
Your website is the face of your business. And if products and services are offered via your homepage, then your website becomes a decisive factor in your company’s success.
Along with an attractive design and intuitive user interface, performance is one of the most important factors for determining the effectiveness of your website. Long load times frustrate users and increase bounce rates – which can consequently lead to a drop in sales.
Website crashes, however, are even worse. The more dependent your company is on its website, the greater the costs of an eventual crash – even if the downtime only lasts for a few minutes.
Monitor the web server: These are the parameters that matter on
The web server hardware
CPU load, memory, working memory: With our monitoring tool, you have all the important hardware components that could lead to disruptions at a glance. If a hard drive is full, you will find out early enough to react directly.
SNMP Hardware Status sensor
Web server availability
Web servers must always be reachable. Nevertheless, they sometimes fail. With our web server monitoring solution, you will immediately receive a message if the server is not available. With our sensors that show accessibility, you can quickly detect the cause.
Ping v2 sensor
Web server performance
How many queries per second are processed? How many bytes are in a query? What is the proportion to the bandwidth? Our web server monitoring service shows you performance at a glance. If there are increased queries or load, you will receive a message.
Quickly see if your web servers are up and running – even while on the go
Set up PRTG in minutes and use it on almost any mobile device.


An introduction to web server monitoring with PRTG
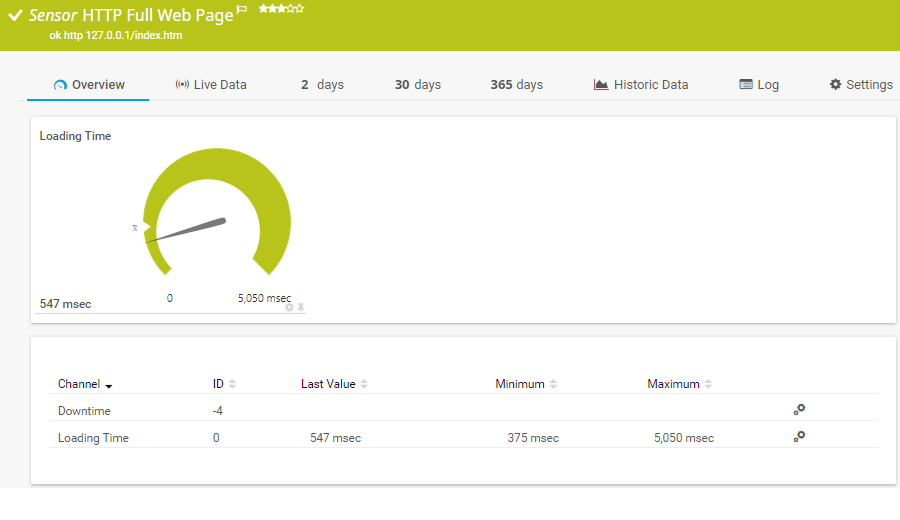
Overview of the PRTG HTTP Sensor

All your web servers at a glance
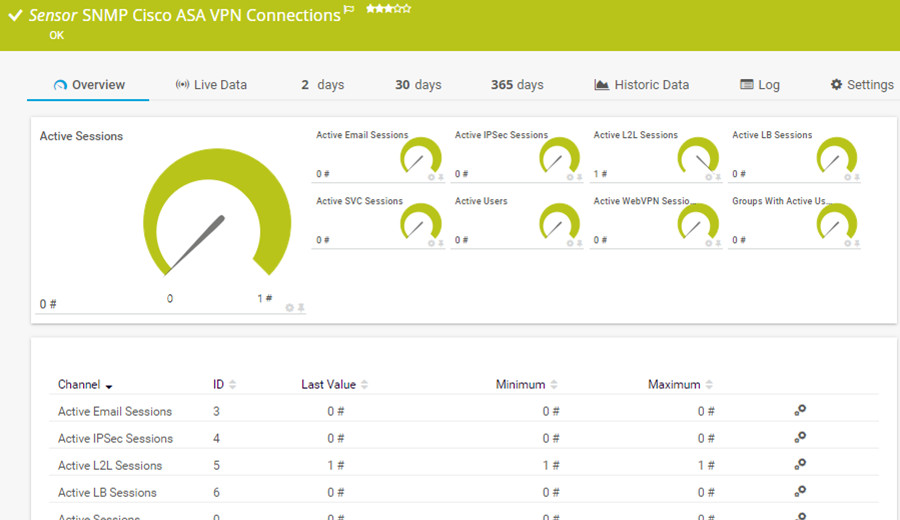
A quick overview of your VPNs
Web server monitoring tool: stationary or cloud-based
![]()
Classic solution
You install our tool on a stationary server at your premises. Advantages: You have your monitoring within your network. Using our flexible license model, you can just top up when you want to increase your monitoring.
![]()
Cloud solution
You can also use PRTG purely as a cloud-based software. Advantages: You can set up PRTG even faster and test for a few months, if needed. You do not need your own monitoring server. You benefit from the security standards, speed and reliability of Amazon Elastic Compute Cloud.
Questions about web servers
Web server test: How does your server respond to a heavy load?
Many system administrators want to perform a web server test or web server check. Such a test can show you how your web server reacts, for example, when hundreds or thousands of users send requests at the same time, i.e. when the load increases significantly in a short time. You can find a multitude of tools online for various test requirements.
How important is performance in general?
The website is the face of a company. Especially if products and services are offered on the website, it is a decisive factor of company success. Along with an attractive design and a good user interface, website performance, above all, also contributes to good online presence. Long loading times annoy users and often drive bounce rates up, which can reduce revenue. Failure of the whole website is even worse. The more your company relies on your website, the more costly a failure, even if it lasts only a few minutes.
What are the benchmarks for web server performance?
Web server benchmarking is often talked about as well. Usually this concerns the number of requests per second that can be processed. Other parameters are latency and bytes per second. PRTG sounds an alarm when, for example, the load time exceeds your individual requirements.
Keep a constant eye on your website
Promptly determine if your web server is overloaded
PRTG lets you keep a constant eye on all the most important values affecting your server and website. By monitoring load times, response times, transactions, and content, you’ll immediately be informed if your site is overextended, offline, or simply taking too long to load. PRTG will send you an email, SMS, or push notification so you can get to work at once.
Ensure the ultimate user experience
Your goal as a webmaster should be to provide your visitors with as enjoyable an experience as possible. Along with helpful and valuable content, load times play an extremely vital role. Web servers not only supply content, but also perform user authentication, security certificate maintenance, encryption, and the logging of activities.
Trusted by 500,000 users and recognized
by industry analysts as a leader

“Fantastic network and infrastructure monitoring solution that is easy to deploy and easier still to use. Simply the best available.”

“Software is absolutely perfect, Support is superior. Meets all needs and requirements, this is a must have solution if you are needing any form of monitoring.”

“The tool excels at its primary focus of being a unified infrastructure management and network monitoring service.”
How PRTG monitors your web server
Hardware
Behind every website and web service, there is a server. If memory is low or RAM and CPU are overloaded, then the services found on the corresponding server will not be running properly. Thanks to the PRTG Web Server Monitoring Tool, you can keep an eye on important hardware data such as memory, CPU usage, and the capacity of your hard drives.
Performance and traffic
PRTG monitors the key performance values of your web server by measuring (among other things) total traffic, available bandwidth, and the number of current sessions. It also displays the load times of both entire websites as well as individual page elements. Thanks to the Cloud HTTP v2 sensor, you can easily monitor load times from locations all over the world, and therefore offer your customers the best possible user experience, wherever they happen to be. All data can be filtered as desired and presented on easy-to-read PRTG dashboard.
![]() Bandwidth is measured as the amount of data that can be transferred from one point to another within a network in a specific amount of time. Typically, bandwidth is expressed as a bitrate and measured in bits per second (bps). It refers to the transmission capacity of a connection and is an important factor when determining the quality and speed of a network.
Bandwidth is measured as the amount of data that can be transferred from one point to another within a network in a specific amount of time. Typically, bandwidth is expressed as a bitrate and measured in bits per second (bps). It refers to the transmission capacity of a connection and is an important factor when determining the quality and speed of a network.
Read more
PRTG makes your job easier
Our monitoring software frees you to focus on other tasks by promptly notifying you of potential issues.
![]()
Save effort
PRTG gives you one central monitoring tool for your servers and entire network. Enjoy a quick overview of your whole infrastructure via our dashboard and app.
![]()
Save time
Getting started with PRTG is a breeze. Setting up or switching from another network monitoring tool is easy thanks to the auto-discovery and pre-configured device templates.
![]()
Save money
80% of our customers report substantial cost savings with network monitoring. Your costs of licenses will likely pay for themselves within weeks.
PRTG sensors for monitoring your website
![]() How PRTG defines sensors
How PRTG defines sensors
In PRTG, “sensors” are the basic monitoring elements. One sensor usually monitors one measured value in your network, e.g. the traffic of a switch port, the CPU load of a server, the free space of a disk drive. On average you need about 5-10 sensors per device or one sensor per switch port.
![]()
Predefined sensors
PRTG comes equipped with predefined sensors for the fully automatic monitoring of the various parameters of your website. For example, the HTTP v2 Sensor monitors the availability of your site, while the HTTP Full Web Page Sensor keeps an eye on the load times of an entire website, including all images. The HTTP Transaction Sensor can be used to monitor processes (such as an online order from A to Z). Finally, the HTTP Content Sensors checks the content of a website and the HTTP Data Advanced Sensor monitors the XML and JSON file values that are returned by a web server.
![]()
Sensors for Apache web servers
PRTG also offers two types of sensors for your Apache web server. These sensors are available by default, and provide a constant overview of the availability, requests, transferred data, uptime, and CPU load of your Apache server.
Find out more about these sensors and website monitoring here.

“I particularly like having breakfast at home and just surveying my domain, and understanding what's working and what isn't.”
Steve Coppin, Oxford University
PRTG is your all-in-one web server monitoring tool
![]()
A wide range of features
- Website monitoring via HTTP and Ping
- Load time monitoring for the entire website or individual elements
- Transaction and content monitoring
- Compatibility with all popular web servers (e.g. IIS, Apache)
- Website monitoring from remote locations
- Queries of XML and JSON files
![]()
Functions
- Documented APIs and easy query creation
- Notifications and comprehensive alarm functions
- Simple documentation with customized reports
- Accurate long-term evaluation thanks to complete monitoring data logs
![]()
Other benefits
- Easy to use
- Transparent licensing
- Outstanding price-performance ratio
Create innovative solutions with Paessler’s partners
Partnering with innovative vendors, Paessler unleashes synergies to create
new and additional benefits for joined customers.


With ScriptRunner, Paessler integrates a powerful event automation platform into PRTG Network Monitor.
ScriptRunner
“Easy to implement and configure with good technical support.”
R. v. S., ICT Manager at Heinen & Hopman Eng BV
Also of interest to you
Services: PRTG monitors a lot of network and computer services and technologies like Active Directory, FTP, VoIP, SSH, or VPN. Find out more about these topics on our specific topic pages.
NTP Monitoring: The NTP Sensor continuously compares the times of your network devices with the times of a precise NTP server. This allows all network log files to be compared with one another. Find out more about NTP Monitoring here.
Flow Monitoring: Get a holistic view about your network, keep an eye on your network traffic and what your bandwidth is being used for. PRTG supports all important Flow protocols like NetFlow, sFlow, jFlow, and IPFIX.

PRTG: The multi-tool for sysadmins
Adapt PRTG individually and dynamically to your needs and rely on a strong API:- HTTP API: Access monitoring data and manipulate monitoring objects via HTTP requests
- Custom sensors: Create your own PRTG sensors for customized monitoring
- Custom notifications: Create your own notifications and send action triggers to external systems
- REST Custom sensor: Monitor almost everything that provides data in XML or JSON format
We asked: would you recommend PRTG?
Over 95% of our customers say yes!
Paessler AG conducted trials in over 600 IT departments worldwide to tune its network monitoring software closer to the needs of sysadmins.
The result of the survey: over 95% of the participants would recommend PRTG – or already have.

Still not convinced?
![]()
More than 500,000 sysadmins love PRTG
Paessler PRTG is used by companies of all sizes. Sysadmins love PRTG because it makes their job a whole lot easier.
Still not convinced?
![]()
Monitor your entire IT infrastructure
Bandwidth, servers, virtual environments, websites, VoIP services – PRTG keeps an eye on your entire network.
![]()
Try Paessler PRTG for free
Everyone has different monitoring needs. That’s why we let you try PRTG for free. Start now with your trial.
|
PRTG |
Network Monitoring Software - Version 24.2.94.1400 (April 10th, 2024) |
|
Hosting |
Download for Windows and cloud-based version PRTG Hosted Monitor available |
Languages |
English, German, Spanish, French, Portuguese, Dutch, Russian, Japanese, and Simplified Chinese |
Pricing |
Up to 100 sensors for free (Price List) |
Unified Monitoring |
Network devices, bandwidth, servers, applications, virtual environments, remote systems, IoT, and more |
Supported Vendors & Applications |
|