Log files will tell you what went wrong when the system suddenly stops working. They will also help you monitor any system changes and can even help you enforce the security of your network.
Log files are such an essential element of your network administration information sources that there are tools produced specifically to help you manage them.
Here’s our list of the best log management tools:
- Datadog Log Collection & Management – EDITOR’S CHOICE A cloud-based log collector, organizer, and interface. This system also offers an archive manager and you can choose whether to bundle in a storage package or store to your own cloud account. This is a SaaS platform. Start a 14-day free trial.
- SolarWinds Security Event Manager (FREE TRIAL) Perfect for identifying, logging, and responding to suspicious events on your network in real-time. A great tool for helping you analyze and make sense of complex log data and ideal for preparing compliance reports. Start 30-day free trial.
- SolarWinds Papertrail (FREE PLAN) Cloud-based service has file content filtering capabilities and can extract records by date to help you with your event management tasks.
- Graylog (FREE PLAN) This log management package is available in four versions and two of them are free to use. Offered as a SaaS platform or as a virtual appliance.
- Loggly (FREE TRIAL) A cloud-hosted log analyzer that transfers data to remote servers for analysis. Available in free and paid versions.
- ManageEngine EventLog Analyzer (FREE TRIAL) This log manager can collect logs from incompatible sources, such as Syslog, Windows Events, and applications, and merges them into a standard format for searching and storing together.
- FirstWave opEvents (FREE TRIAL) A log manager that is an add-on to the Network Management Information System. Installs on Linux.
- ManageEngine Log360 (FREE TRIAL) A log manager and SIEM system that includes collection agents that install on each endpoint. Runs on Windows Server.
- Site24x7 Log Management (FREE TRIAL) This cloud-based system collects and consolidates log messages from any site and makes them available for analysis. Start a 30-day free trial.
- Paessler PRTG Network Monitor This monitoring system covers networks, servers, and applications; it includes a Windows Event Log sensor and a Syslog Receiver.
- Splunk Comprehensive log management solution for macOS, Linux, and Windows.
- Fluentd Cloud-based hub for log file information gathered by an agent on your system.
- Logstash Part of the free Elastic Stack, this is a log data gathering tool.
- Kibana This is the data viewing application of Elastic Stack; commands available with Kibana include basic file management that can split out any log file by date.
- XpoLog This utility can analyze data from Apache server logs, AWS, Windows and Linux event logs, and Microsoft IIS.
- Managelogs A free, open-source utility to manage Apache web server logs.
Once you find a log management tool that you like, you will grow to be dependent on it for a range of admin tasks, including Security Information and Event Management (SIEM) and real-time log monitoring of your network and its equipment. If your favorite tool goes out of production, you will need to find a replacement quickly to enable you to continue to manage event logs and sort through all of your log data.
The best log management tools for Windows, Linux, and Mac
Our methodology for selecting a log management tool
We reviewed the log management and log analysis software market and analyzed tools based on the following criteria:
- The inclusion of a log message collector, a server, and a consolidator
- The ability to create logfile names with meaningful structure and rotate them, opening new files periodically
- The creation and maintenance of a log file directory structure
- A data viewer that includes data analysis functions, such as filtering and sorting
- Data portability
- The offer of a free demo or trial for a no-cost assessment
- A good deal that offers valuable services at a reasonable price
1. Datadog Log Collection & Management (FREE TRIAL)
Datadog provides systems monitoring tools from the cloud. One of its services is a log server system. Being based on a remote server in the cloud, the Datadog Log Manager is not bound by the log standards of specific operating systems. So, it is able to collect logs generated under the Syslog standard used on Linux and also Windows Event messages.
Key Features:
- Cross-Platform Compatibility: Supports log collection from both Syslog and Windows Events, facilitating a unified logging solution across different operating systems.
- Application Insights: Direct integration with applications to extract and centralize activity data, enhancing monitoring capabilities.
- Consolidation and Neutral Format: Logs are consolidated into a neutral format, making them easily searchable within Datadog’s ecosystem.
- Archiving with Accessibility: Offers log archiving and easy revival for compliance and auditing purposes, ensuring logs are both stored safely and retrievable.
- Cloud-Based Flexibility: Leveraging cloud infrastructure for log collection and management, enabling scalability and remote accessibility.
Why do we recommend it?
Datadog Log Collection & Management is a useful system to gather and centralize logs from around the system of an organization. As this is a cloud-based system, it is not bound into one specific network and it can collect and store log messages from any site and also individual remote devices. The tool can gather application logs as well as Sylog and Windows Events messages from operating systems.
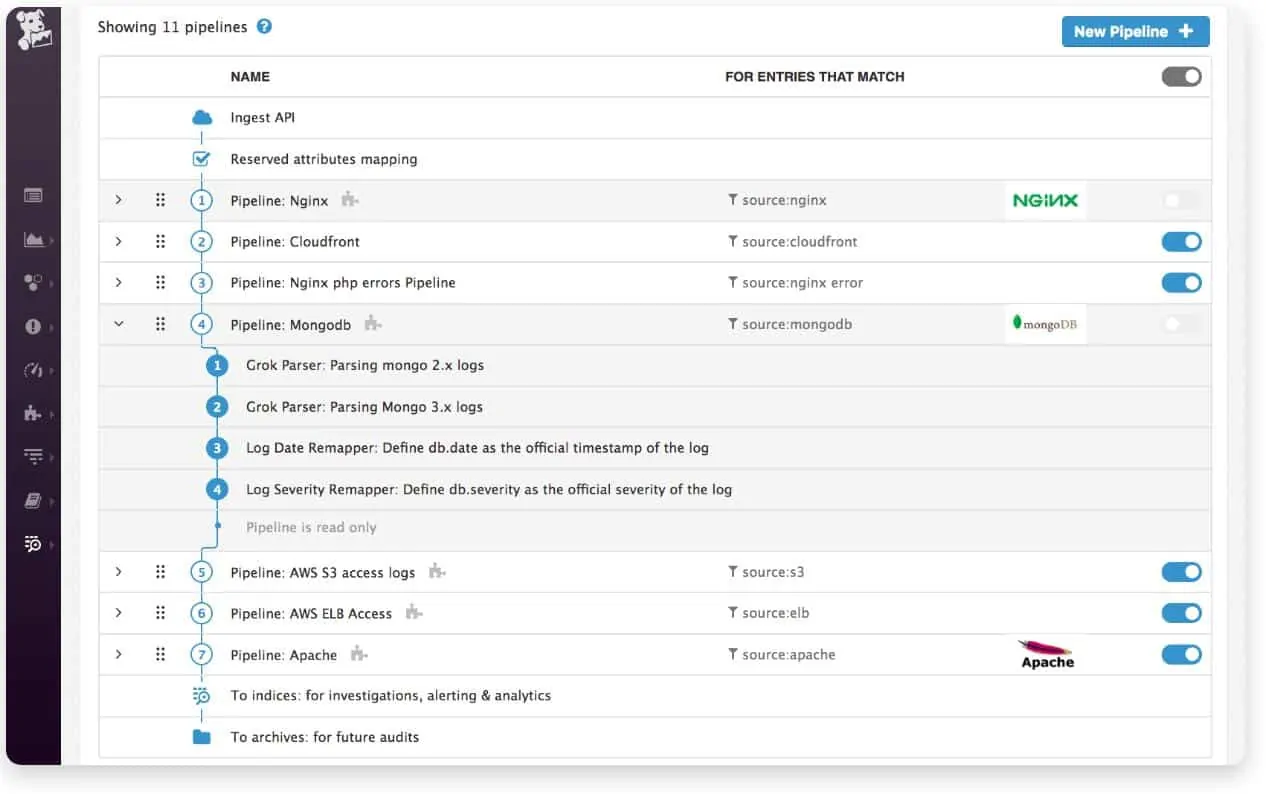
The Log Management system of Datadog collects log messages traveling around your network through an agent program. These records are uploaded to the Datadog server where they are consolidated into a neutral format. This makes them searchable with the Datadog system.
The SaaS dashboard of Datadog includes a log file viewer that has analysis facilities, such as search, sort, and group. The Datadog servers provide storage for live logs and also for archives. A Datadog utility makes archives accessible, bringing them back to current storage and making them accessible again.
The Datadog Log Management service is available as two subscription services. These are Ingest, which is the main log server, and Retain or Rehydrate, which is the archiving and log storage and archiving service.
The software for Datadog Log Management is essentially free. The company charges for the data throughput that the services handle. Datadog is able to collect and process log messages from many servers and it doesn’t matter where they are. The service can also collect logs from cloud servers.
Who is it recommended for?
This system is based in the cloud and collects log messages from anywhere. So, the Datadog Log Collection & Management system, while suitable for any business, is particularly interesting for companies that operate multiple sites. The log archiving function is very useful for businesses that want to save the cost of storage space.
Pros:
- Versatile Log Collection: The cloud-based nature allows for seamless log collection across various sites and from remote devices.
- Comprehensive Integration: Interfaces efficiently with applications, providing in-depth insights into application performance and issues.
- Advanced Search Tool: Includes a powerful data search tool, simplifying log analysis and troubleshooting.
- Effective Compliance Management: Manages archiving and revival processes adeptly, aiding in compliance auditing and data retention policies.
Cons:
- Self-Hosting Not Possible: The service is entirely cloud-based, limiting options for those preferring or requiring on-premises solutions.
Datadog offers 14-day free trials of both Ingest and Retain, or Rehydrate. The two services are subscribed to separately, but it is unlikely that you would choose only one of them. Datadog produces other infrastructure monitoring services and they all integrate with the Log Management system.
EDITOR'S CHOICE
Datadog Log Collection and Management is our top pick for a log management tool because it has a modular structure, letting you decide whether you just want a service to process log messages or also store and archive them. This package is able to collect and consolidate a range of log message formats through the activation and installation of on-site collectors. The Datadog system will consolidate these different message types, showing them in the dashboard as they arrive and calculating throughput statistics. The package will store logs to file and you can choose whether to use a Datadog storage space or save to your own servers or cloud accounts.
Download: Start 14-day FREE Trial
Official Site: https://www.datadoghq.com/free-datadog-trial/
OS: Cloud-based
2. SolarWinds Security Event Manager (FREE TRIAL)
Unlike Cronolog, the SolarWinds Security Event Manager isn’t free. However, you can get access to it on a 30-day free trial. This is a very comprehensive log management system, and it would be particularly useful for large organizations. It will enable your real-time log monitoring and help you locate each event log quickly.
Key Features:
- Real-Time Monitoring: Offers live log monitoring, crucial for immediate threat detection and response.
- Comprehensive Compliance: Automates compliance management for standards like HIPAA and GDPR, streamlining audit processes.
- Enhanced Security: Secures log files against tampering, ensuring data integrity and supporting cybersecurity efforts.
- Cross-Platform Support: Manages logs from both Syslog and Windows Events, accommodating diverse IT environments.
Why do we recommend it?
SolarWinds Security Event Manager is a full SIEM service. SIEM systems search through log files, so they are reliant on the efficient collection of log messages and their standardization for consolidated storage and searching. SolarWinds doesn’t risk the user having a sub-standard log manager, so that function is included in the Security Event Manager package.
This software runs on the Windows Server operating system, but it is not limited to managing logged events that only arise on Windows. The manager is a cross-platform utility that will deal with all of your system logging tasks, no matter which operating system they come from.
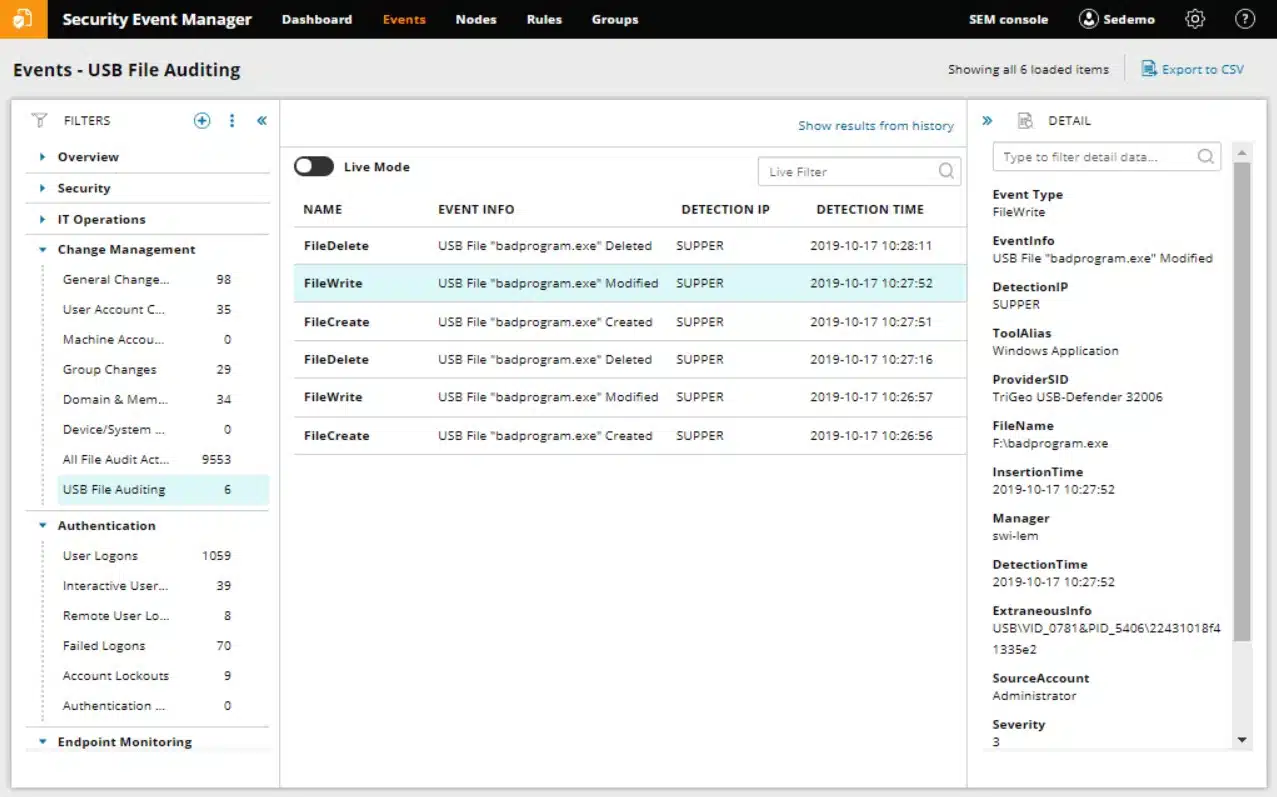
An amazing feature of this log manager is that it will verify the information in your log files by separately tracking real-time data. This is a great security feature in these days of advanced persistent threats when hackers regularly changelog files to cover their tracks. This is an example of how the SolarWinds Security Event Manager extends beyond the historical need to check what happened when things go wrong.
Today, log file management has become a function of system security and data integrity routines. Thanks to the EU’s new GDPR requirements, data protection has become a vitally important system administration priority. The need to patch data leaks quickly makes log files a primary source of information. Extra features of this tool include USB memory stick management and event analysis functions.
This log manager is also a good choice for sites that require standards compliance. The Log and Event Manager automatically generates HIPAA, PCI DSS, SOX, ISO, NCUA, FISMA, FERPA, GLBA, NERC CIP, GPG13, DISA STIG reports demonstrating compliance or highlight gaps for remedial action.
Security-sensitive sites need a lot more from their log management tools than Cronolog could offer. So, if you are looking for a replacement utility and you also need SIEM features, think about what your company needs now from a log management system, not what you could get away with back when Cronolog was first written.
Who is it recommended for?
The SolarWinds system can handle very large volumes of log data, so it is perhaps a little over-engineered for use by small businesses. The tool is going to be of particular interest to system managers that don’t want to rely on cloud-based systems because the SEM operates on premises. Although this software is only available for Windows Server, it can collect log messages from other operating systems and also from other sites across the internet.
Pros:
- Versatile Platform Support: Operates effectively across different operating systems, enhancing its utility for varied IT landscapes.
- Robust SIEM Capabilities: A full SIEM system integrated for advanced security and compliance management, providing a holistic view of security posture.
- Compliance Focused: Tailored for compliance with major standards, making it ideal for organizations under strict regulatory requirements.
- Log File Protection: Implements measures to protect log files from unauthorized alterations, preserving the authenticity of log data.
Cons:
- Limited to On-Premises: Lacks a cloud-based or SaaS version, potentially limiting flexibility for some organizations.
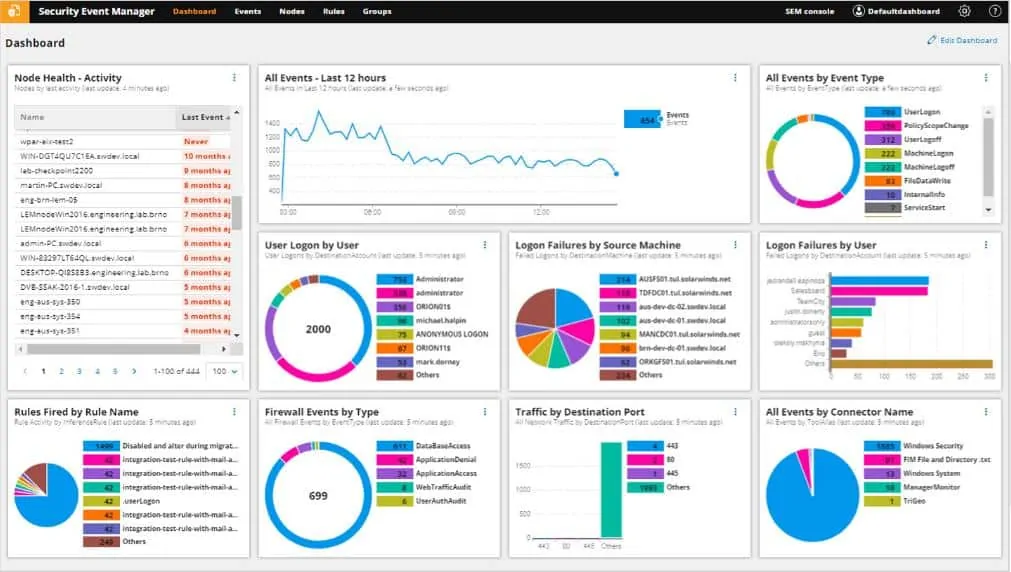
SolarWinds Security Event Manager is great for analyzing complex data logs straight out-of-the-box. With a commanding dashboard, you can identify, analyze, and respond to suspicious events on your network in real-time. This log manager is also great for arranging log data into reports for compliance and auditing purposes.
Start 30-day Free Trial: solarwinds.com/security-event-manager
OS: Windows 10 and later, Windows Server 2012 and later, Cloud-based: Hypervisor, AWS and MS Azure
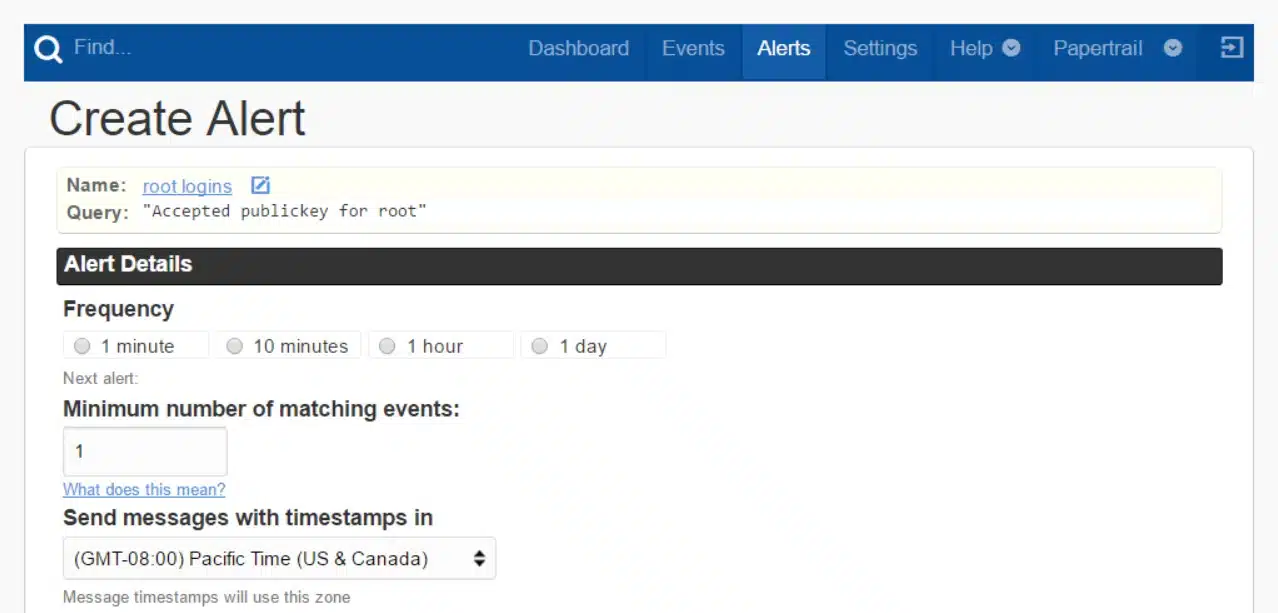
3. Papertrail (FREE PLAN)
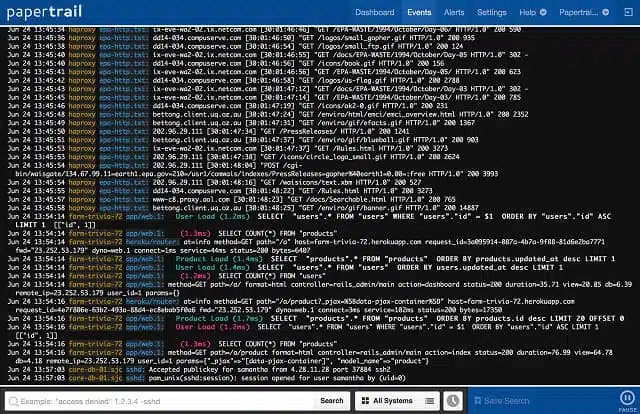
Papertrail is a log management system produced by SolarWinds, a leading network software producer. The main purpose behind Papertrail is to centralize all log file data in one place, so it is a log aggregator. That makes it markedly different from Coronolog, a logfile parser. That said, Papertrail’s file content filtering capabilities can extract records by date to help you with your event management tasks.
Key Features:
- Cross-Platform Collection: Gathers logs from both Linux and Windows, facilitating a comprehensive logging strategy.
- Log Consolidation: Centralizes logs for easier management and analysis, simplifying the monitoring process.
- Free Plan Availability: Offers a free plan to accommodate small businesses or entry-level needs.
Why do we recommend it?
Papertrail is another SolarWinds product except that this service is cloud-based, which is unusual for that provider. The Papertrial system is a pure log server. You need to set up your log systems on each device to send log messages to the Papertrail server. The server then converts all log messages into a common format that enables them to be searched. A data viewer in the package displays log messages as they arrive and provides search and analysis tools. The system also files log messages.
You can use Papertrail to examine a range of log files, including Windows events, Ruby on Rails program messages, router and firewall notifications, and Apache server log files. The log management service is cloud-based, so you don’t need to worry about whether it will run on your operating system. You access the dashboard through your web browser.
Who is it recommended for?
There is a free plan for Papertrail. Although this has capacity limits, it makes sophisticated =log management functions available to very small businesses. The data retention period with that plan is not really long enough for tasks such as compliance reporting. However, it is possible to set up a synching or forwarding system to move those files elsewhere. So, this tool is good for all types of businesses but it is particularly interesting for small businesses.
Pros:
- Cloud-Based Simplicity: Offers a straightforward, cloud-based solution for log management, ensuring ease of access and use.
- Effective Log Retention: Manages log retention and archiving efficiently, aiding in compliance and historical analysis.
- Budget-Friendly: The availability of a free plan and throughput pricing model makes it accessible for businesses of all sizes.
Cons:
- Software Purchase Unavailable: The service operates on a subscription model without the option to purchase outright, which may not suit all budgeting preferences.
The price for the service varies depending on the search volume that you put through it. There is a free plan that gives you a data throughput allowance of 100 MB per month. That is not very much, but if you limit your service coverage to just Apache logs, you might be able to get away with it. The cheapest paid plan gives you a data allowance of 1 GB per month for $7. The paid plans work on a subscription basis and you pay a monthly fee.
Each plan lets you view a period of data and allows you to archive data for a different length of time. For example, the free log management service lets you operate on data from the last 48 hours and you can archive data for seven days. This would be enough to emulate Cronolog, because for that, you only need to look at one day’s worth of data at a time.
4. Graylog (FREE PLAN)
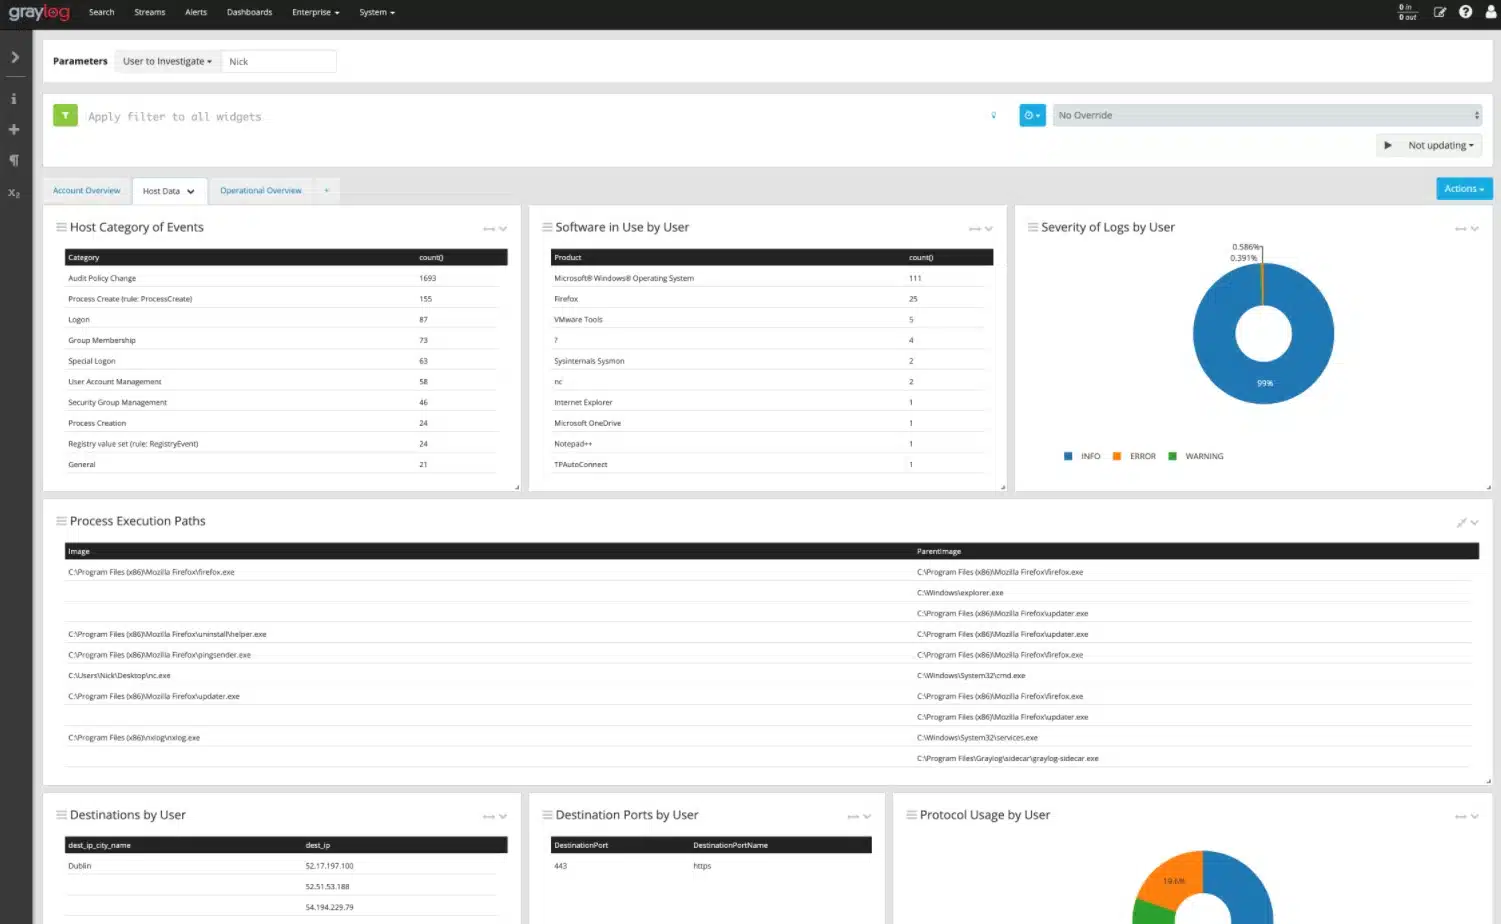
Graylog is a log management tool that can be adapted to system performance monitoring and security systems, such as a SIEM service. The package is offered as a cloud-based service and there are also versions that can be installed on-premises as a virtual appliance. The tool includes agent programs to collect log messages and it is able to merge formats, including Windows Events and Syslog.
Key Features:
- Diverse Log Sources: Supports a wide range of log sources including Windows Events, Syslog, and application logs for comprehensive coverage.
- Deployment Flexibility: Available as both SaaS and on-premises, offering choices to fit various IT infrastructure needs.
- Community Support: Benefits from a vibrant community and free versions, fostering an environment of shared knowledge and resources.
Why do we recommend it?
Graylog has a good reputation for log management due to its long service history in the field. The tool was originally free, which accounts for its large historic user base. Now that the tool is being charged for, the Graylog team need to work a little harder to gain a market. The system includes a query language that developers can use to create a SIEM system on top of the Graylog service or users can choose to buy a pre-written SIEM package from Graylog. Without the development of queries, the Graylog system is able to display throughput statistics about incoming log messages. The tool will display records as they arrive and file them. Log files can be read into the data viewer for analysis.
The Graylog package was originally an open-source, free system. However, the organization now offers a paid tool. The free version is still there and it is now called Graylog Open, which installs on Linux or on a VM. You get access to community forums with the free system but no professional support.
The new commercial Graylog is offered in three editions and one of those is free to use. That is the Graylog Small Business service, which is a software package for installation over a VM, as is the Enterprise edition. The third package is Graylog Cloud, which is a SaaS platform.
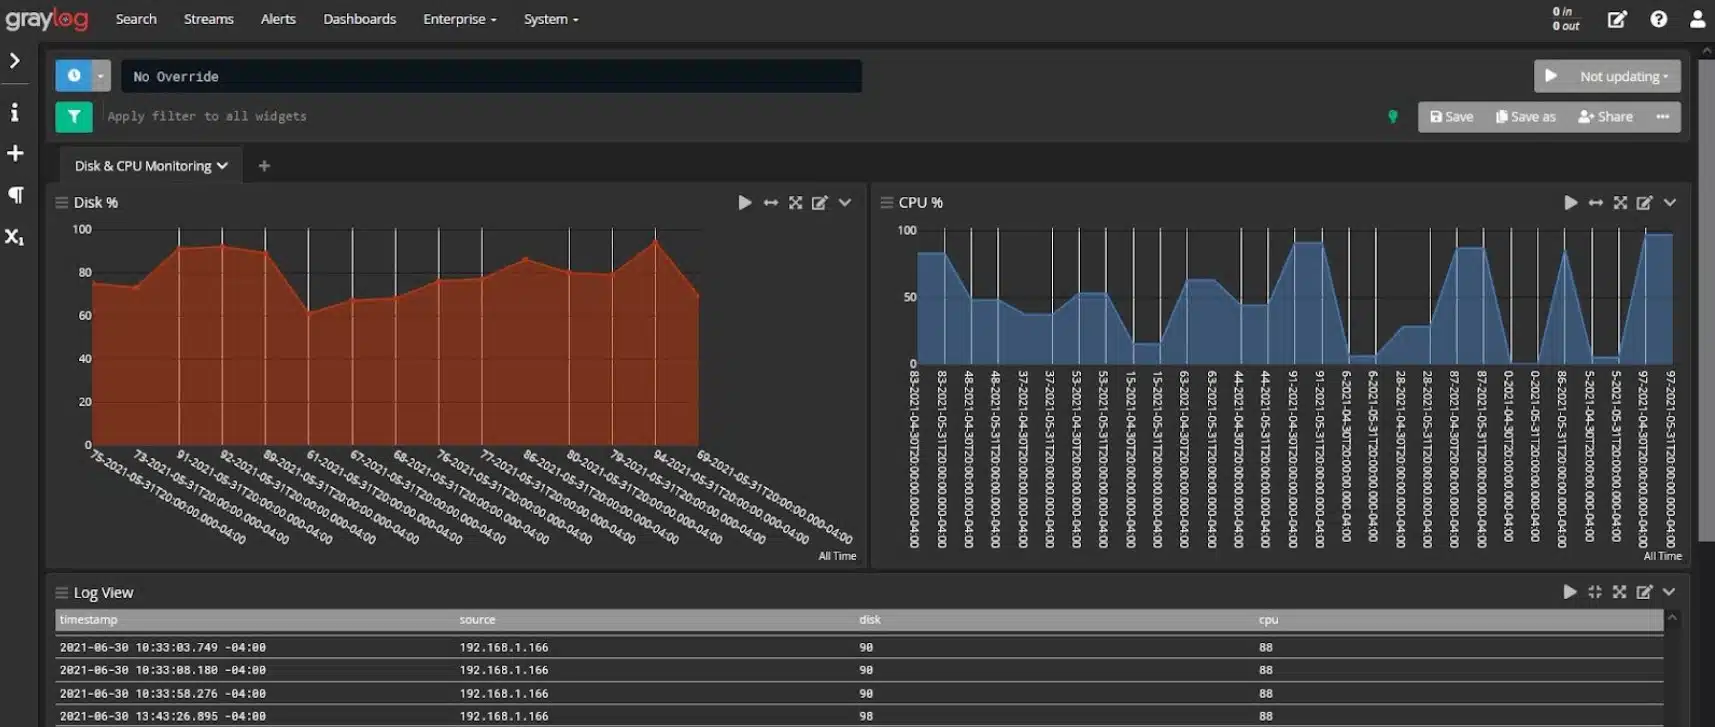
As well as collecting operating system messages from Windows Events and Syslog, this tool is able to gather application logs. All formats are consolidated into a common format and log arrival statistics are shown live in the Graylog dashboard. The system manages log files, creating a meaningful directory structure and rotating log files daily. The system also shows live tail messages in the data viewer of the console.
The usage of the log message contents is up to you. It is possible to analyze data from the messages by recalling stored files or working on the live tail data as it comes in. The viewer includes analytical features, such as sort, group, and filter.
Although the system can be used to show live performance data, you have to set those screens up yourself. Most of the work is done for you with a library of templates and widgets. Connect a display format to a data source, which would be a saved query.
The Security Monitor package in the Graylog system includes detailed pre-written templates that offer a range of detection scenarios. These can be implemented with Security Orchestration, Automation, and Response (SOAR) to interface with network security systems, such as a firewall or access rights manager to reap detailed activity information and then to suspend accounts or block communication with specific IP addresses if suspicious activity is detected.
Who is it recommended for?
This tool is available in many formats and there s a free version. The free system is an on-premises package and can perform log management without the user needing to develop any applications. The paid version is more sophisticated and comes with a lot of pre-written data analysis and screens. You can get the paid versions for on-premises installation or as a SaaS package.
Pros:
- Wide Range of Options: Offers various deployment models, including a free version, catering to businesses of different sizes and needs.
- Log Format Consolidation: Efficiently consolidates logs of different formats, simplifying log management and analysis processes.
- Integrated Data Viewer: Comes with a built-in data viewer, enhancing the ease of log analysis and monitoring.
Cons:
- Setup Complexity: The initial setup and configuration can be complex, requiring a significant time investment to fully leverage its capabilities.
You can assess Graylog in a number of ways. You have the option to download Graylog Open to try out the log management capabilities of Graylog. There is also the possibility of using the free Graylog Small Business for trialing the system because this has all of the functions of Graylog Enterprise but it is limited to processing up to 2 GB of data per day. You can also get a demo of Graylog Cloud.
5. Loggly (FREE TRIAL)
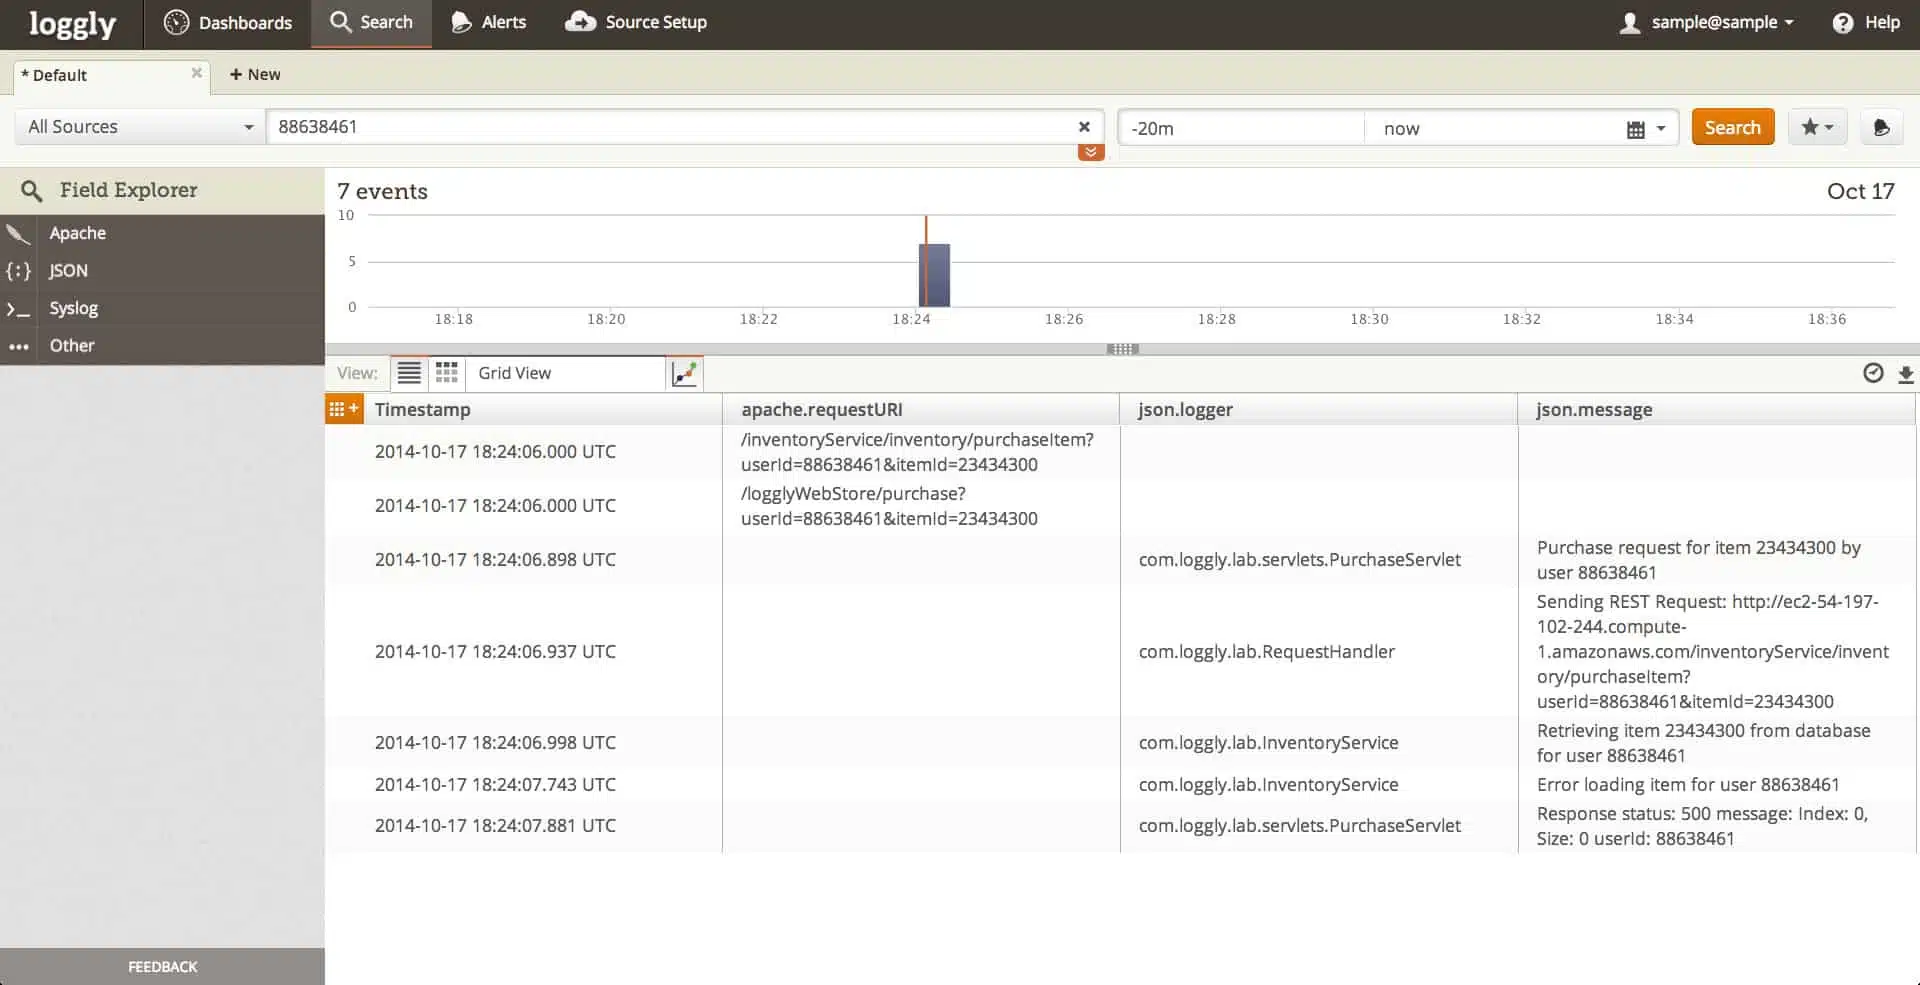
Loggly is a log consolidator that is based in the cloud. This hosted log management tool also offers log analysis facilities. A big advantage of this cloud-based approach is that you don’t need to maintain any log management software in order to use the utility. Your on-premises system needs to be coordinated to the Loggly service so that it will upload your standard log files periodically to the online server.
Key Features:
- Cloud-based Agility: Utilizes cloud infrastructure for log management, offering scalability and ease of access.
- Multi-site Capabilities: Capable of handling logs from various locations, enhancing its utility for distributed systems.
- Free Plan Access: Availability of a free plan makes it accessible for smaller operations or for evaluation purposes.
Why do we recommend it?
Loggly is another product of SolarWinds. The reason that this company seems to have three tools that perform the same task is that it developed the Security Event Manager and then bought the companies that created Papertrail and Loggly. The Loggly and Papertrail systems are very similar except that Loggly includes an on-premises agent that uploads log messages to the cloud log server. Once messages are on the cloud, the Loggly and Papertrail log management systems are very similar. The Security Event Manager is quite different because it is an on-premises package and its main feature is its SIEM system.
As a consolidator, Loggly reformats the uploaded log file records into a standard format. This allows the analyzer to process records from several different sources and enables you to monitor events across your system, regardless of the operating system or methodology that generated those event records. The sources of log file messages aren’t limited to your on-premises servers. It is also able to process records generated by online servers, such as AWS and it can include messages created by applications such as Docker and Logstash.
A possible point of vulnerability in this operating model lies in the transfer of data. However, you no doubt already use a protected file transfer system, such as FTPS. The TLS protection embedded in that standard will protect your data during uploads. TLS also covers data transfers from the Loggly server to your browser, through the HTTPS protocol.
Who is it recommended for?
Loggly is easier to use than Papertrail and there is a free edition, called Lite. Both the free Loggly and the free Papertrail offer a 7-day retention period. The main difference between the two is that the Papertrail system makes data available for searching for 48 hours, while the free Loggly system has a limit of processing 200 MB per day. So, small businesses need to judge which of these systems provides them with the log processing capacity that they need. For the paid plans, the Papertrail system is considerably cheaper.
Pros:
- Secure Data Transfers: Ensures the security of log data during transfer with robust encryption, protecting sensitive information.
- Unified Log Management: Consolidates logs from diverse sources into a single, searchable repository, simplifying analysis and monitoring.
- Cloud Storage Inclusion: Comes with included cloud storage, providing a turnkey solution for log retention and analysis.
Cons:
- Limited Long-term Storage: The included storage may not meet long-term archival needs, potentially necessitating additional storage solutions.
The Loggly service is offered in three service plans. The entry-level package is free to use. This is called Loggly Lite. Each plan has a data processing limit and you might find that the limits on the free service do not give you enough space for your log data. You are allowed to upload 200 MB of log data per day with Loggly Lite and the system will retain each record for seven days.
The Standard package of Loggly gives you an upload allowance of 1 GB per day and stores each record for 30 days. You also get multiple user account access with the paid packages. With the Standard package, you can have three user accounts. The higher-paid package has no limit to the number of users you can set up on your account. That plan, which is called Loggly Enterprise, is a bespoke package with prices depending on the amount of upload capacity and the storage period that you require.
Loggly is a subscription service, which you can pay annually or monthly. You can get a 14-day free trial of the Standard plan. If you decide not to continue with this plan at the end of the trial period, your account will be switched automatically to the free Loggly Lite plan.
6. ManageEngine EventLog Analyzer (FREE TRIAL)
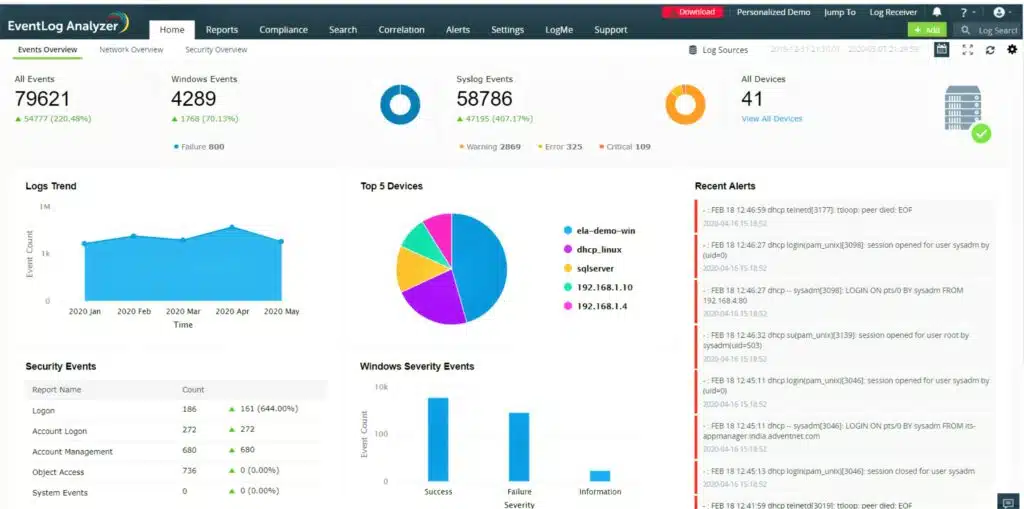
The ManageEngine EventLog Analyzer is more than a log file server. It is an intrusion detection system that looks for threats to the network.
Key Features:
- Comprehensive Log Collection: Gathers and consolidates logs from various sources, ensuring a holistic view of network activity.
- Advanced Search Capabilities: Features pre-written searches and robust data analysis tools, streamlining log investigation.
- Compliance Focused: Offers compliance auditing capabilities, aiding organizations in meeting regulatory requirements.
Why do we recommend it?
ManageEngine EventLog Analyzer is a very close competitor to SolarWinds Security Event Manager. Like the SolarWinds system, this tool is a self-hosted package that provides both the collector and the server elements of a log management tool. The difference between these tools comes down to whether you prefer SolarWinds software or the systems of ManageEngine.
Just about every piece of equipment and software in your business generates log messages periodically and in response to exceptional events. The EventLog Analyzer catches these messages as they move around the network and stores them to file.
The main source of messages is the Windows Event Log system and Syslog messages that arrive from Linux systems. The EventLog Analyzer also picks up log messages from Apache Web Server, database systems, firewalls, network equipment and security software.
Once log messages are stored in files, they need to be archived periodically. The files have to be organized in a logical manner, which makes the events of specific dates easy to access. The EventLog Analyzer handles all of that logfile management work. As a source of disclosure on unauthorized activity, log files are often targeted by hackers to remove traces of their intrusion. The EventLog Manager monitors changes to logs and blocks unauthorized access.
Log data is a rich source of information on the status of your system equipment. The analysis module of the EventLog Analyzer uses log information to audit user access to critical resources. This is particularly important in the hunt for intruders. Intrusion might not just be the unauthorized access by outsiders, but it could also be inappropriate data access by staff.
The EventLog Analyzer also audits the activities of applications, checking on the operations of Web servers, DHCP servers, databases, and other essential services in your system. The information culled from these monitoring activities is important for performance statuses as well as for security.
EventLog Analyzer centralizes the collection and storage of all of the log messages from every asset in your system. The service consolidates logs, which means that it converts all of the different log message formats into one standard layout. This enables the logs to be treated as one single data pool for analysis in the package’s data viewer. The tool will also store all logs together so that they are available for compliance auditing
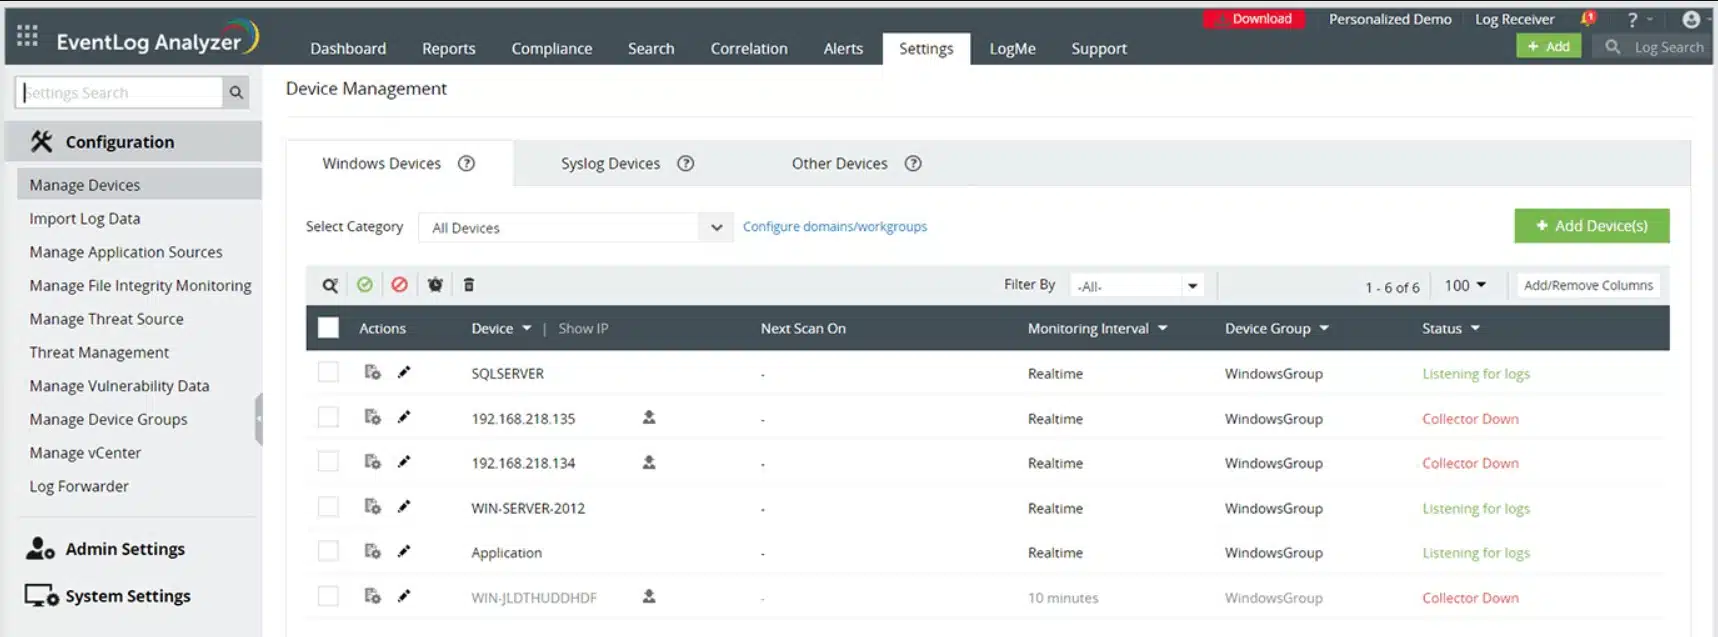
Who is it recommended for?
ManageEngine provides more hosting options for the EventLog Manager than SolarWinds has for its Security Event Manager. This tool can be installed on Windows Server and Linux. There is also an option to get the system as a SaaS package. When the EventLog Analyzer is run in the cloud, it installs agents on monitored systems to collect log messages. There is a free version of EventLog Analyzer for small businesses that is limited to collecting logs from five sources, which is only suitable for very small businesses. The full, single-site version of EventLog Analyzer is considerably cheaper than the Security Event Manager.
Pros:
- Flexible Deployment: Available for both on-premises and cloud installations, offering versatility to meet specific IT requirements.
- Intrusion Detection: Incorporates an intrusion detection system, enhancing network security through proactive monitoring.
- Comprehensive Reporting: Generates detailed reports for compliance with standards like PCI DSS and HIPAA, simplifying audit processes.
Cons:
- Additional Cost for Multi-Site: Collecting logs from multiple sites may incur extra costs, potentially affecting budget planning.
The ManageEngine EventLog Analyzer installs on Windows, Windows Server and RHEL, Mandrake, SUSE, Fedora, and CentOS Linux. This is a paid product, but there is also a free edition, which gathers logs from up to five sources. You can get a 30-day free trial.
7. FirstWave opEvents (FREE TRIAL)
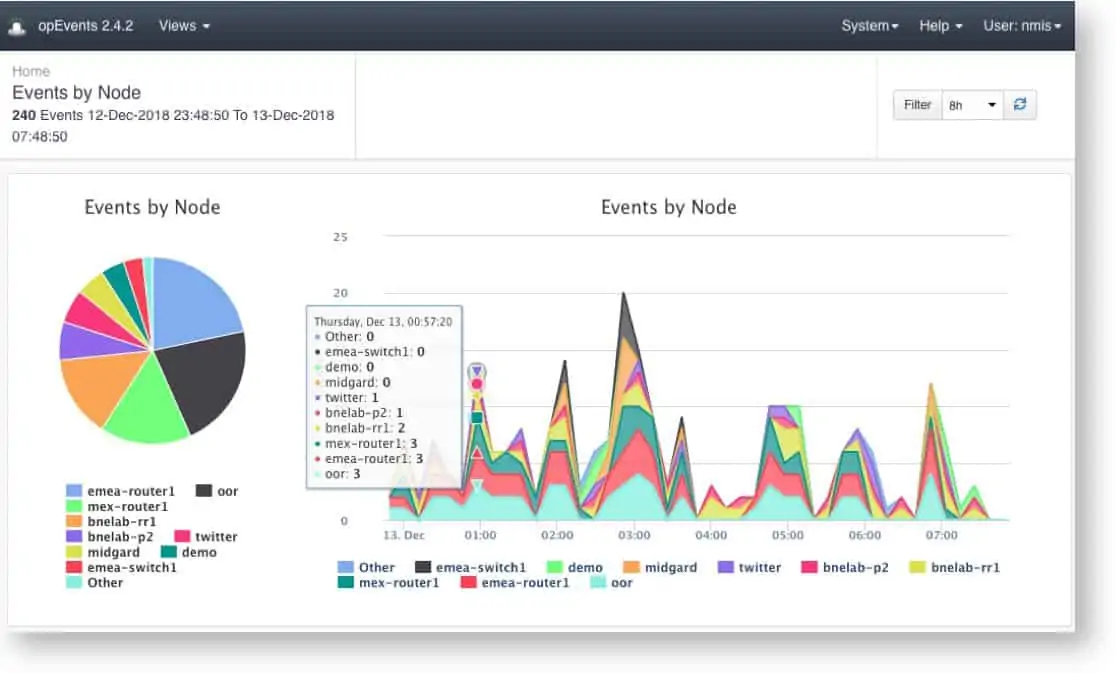
FirstWave opEvents is a log file manager that is able to collect and consolidate log messages from a Range of sources, including Syslog and Windows Events. This is an add-on module to NMIS, the Network Management Information System.
Key Features:
- Integrated Monitoring: Acts as an add-on to a network monitoring system, providing enriched event management capabilities.
- Application Log Collection: Collects logs from applications in addition to Syslog and Windows Events, offering a broad coverage.
Why do we recommend it?
FirstWave opEvents is an add-on to a network monitoring package, called NMIS, rather than a standalone package. This system is free to use for small networks but it would be a waste to implement the NMIS network monitoring system as well as another network monitor, so you need to be committed to the NMIS system to use the opEvents log manager.
The opEvents system installs on-premises and its dashboard gives you the opportunity to identify log metrics, such as the reporting rate, and set alerts on unusual statistics. The tool will reorganize incoming log messages into a neutral format and then store them together in files with meaningful names, such as by data, source, or both. These files are regularly rotated and held in a directory structure that makes finding a relevant event easy.
The dashboard includes a data viewer that includes a sort and filter facility for data analysis. It is possible to identify log messages that pertain to a specific device and then analyze its performance based on reported status records.
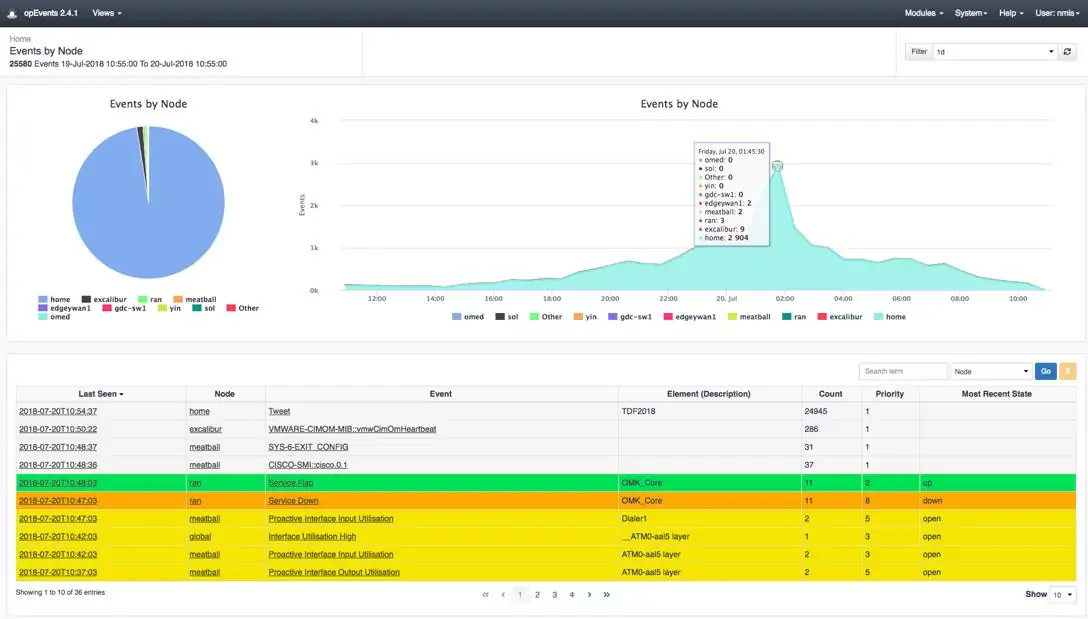
The screens of the opEvents dashboard are colorful and attractive. They combine log records with summarizing data graphics. The service allows you to set your own rules by building queries that look for specific events of combinations of actions on a specific device.
The data viewer can highlight conversations with particular endpoints and group together log records for specific applications. If you create a search for a specific indicator, you can then work through and open a series of log files and apply that same query to each of them.
The opEvents system supports manual event investigations, so it is specifically aimed at system technicians who know what signs to look for in the large volume of log data that gets generated by a typical system.
The opEvents system is not a standalone tool. It can only be accessed as part of the Network Management Information System (NMIS). So, you need to install that system first. The NMIS software is free and open-source but the opEvents system is a paid product.
Who is it recommended for?
Small businesses will really appreciate the free combination of the NMIS network monitor and the opEvents system. Both can be downloaded and installed in a unified package. The system runs on top of the widely-used virtualizations of VMware and Hyper-V and there is also a free alternative called VirtualBox. So, small businesses will love this package but larger organizations would need to assess whether they want to ditch their current network monitoring tool before considering the opEvents system.
Pros:
- On-premises Efficiency: Tailored for on-premises deployment, offering a robust solution for internal network management.
- Dynamic Data Viewer: Features a sophisticated data viewer for in-depth log analysis, enhancing diagnostic processes.
Cons:
- Lack of SaaS Option: Does not offer a cloud-based version, limiting its flexibility for organizations preferring cloud services.
The software for NMIS and opEvents installs on Linux. There is an FirstWave virtual machine to run on Windows and host the software if you don’t have any Linux servers on your site. The opEvents is free to use on a 20 node network. You can get a 30-day free trial of the full, unrestricted system.
8. ManageEngine Log360 (FREE TRIAL)
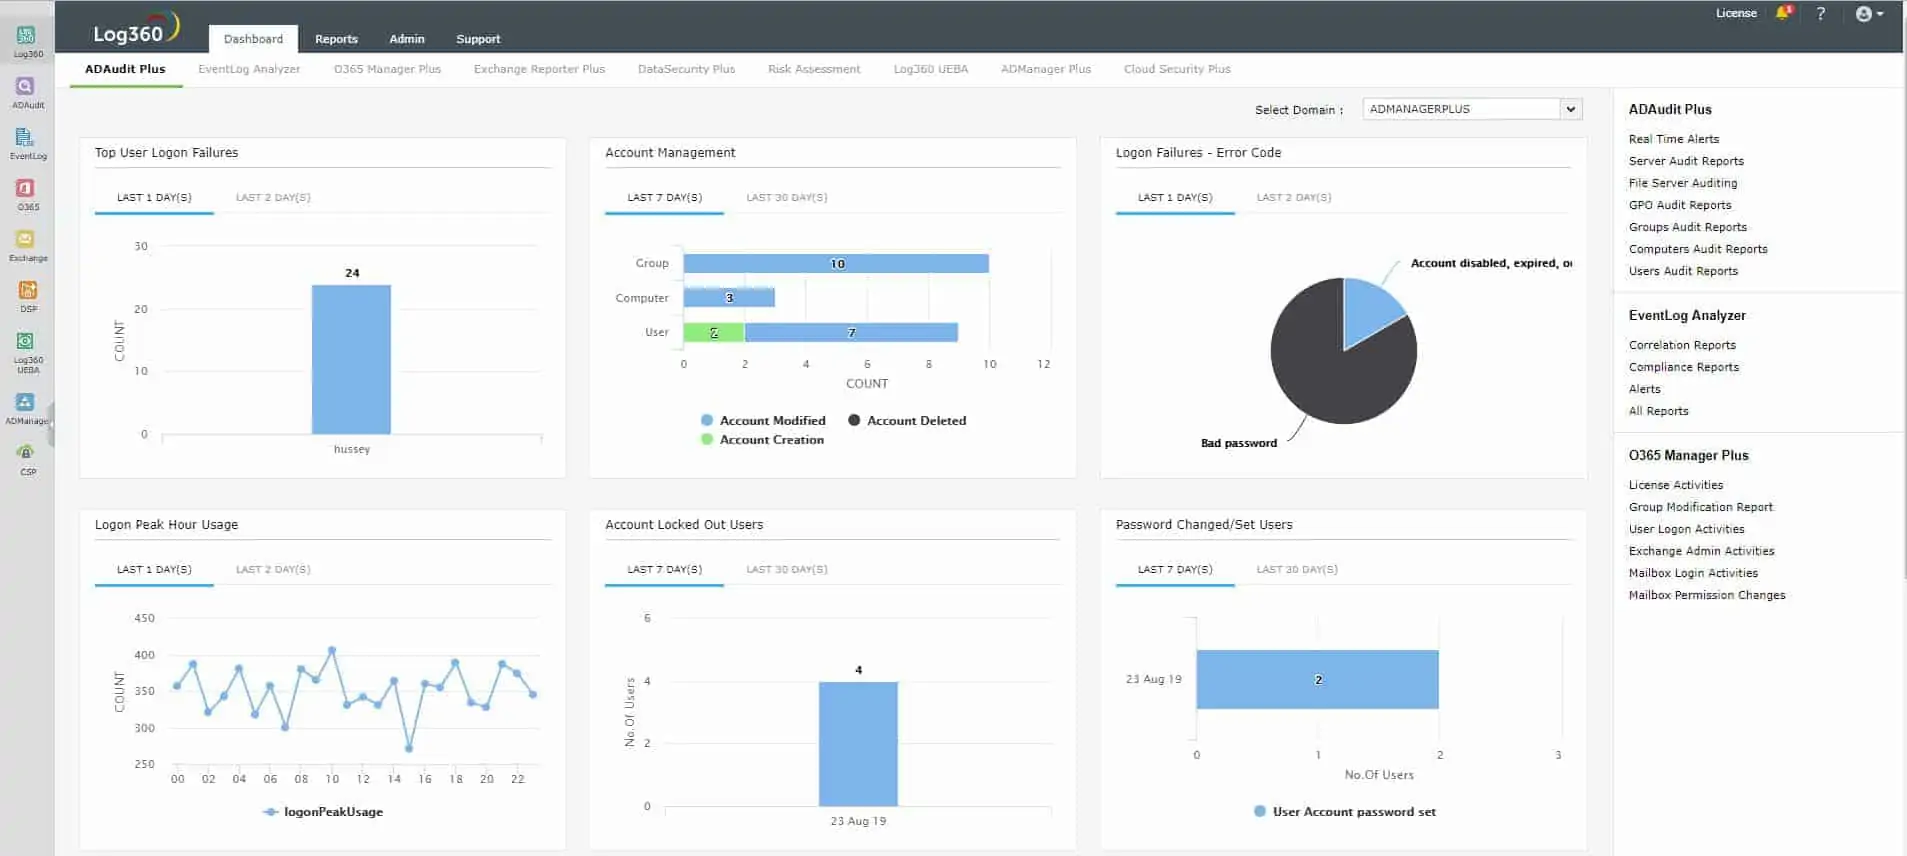
ManageEngine Log360 gathers log records to form a data source for a SIEM service. The tool has a central server and endpoint agents. The agent on each endpoint collects log messages from the operating system and interfaces to more than 700 software packages to extract activity information. The agent then sends those records to the log server.
Key Features:
- Extensive Tool Integration: Combines multiple ManageEngine tools for a comprehensive security and monitoring solution.
- User Activity Tracking: Monitors user activities closely, aiding in the detection and investigation of security incidents.
Why do we recommend it?
ManageEngine Log360 is a very large bundle of a number of ManageEngine products, which includes EventLog Analyzer. So, if you only need a log manager you would be overspending with this package. The Log360 system provides extensive user activity tracking, data protection, and compliance reporting, all of which are dependent on log generation, organization, and storage.
The server of the log manager “consolidates” arriving records by converting their layouts into a common format. The log mana ger files these records and also displays them in a data viewer in the dashboard. While records pass through the log manager, the SIEM system performs threat detection.
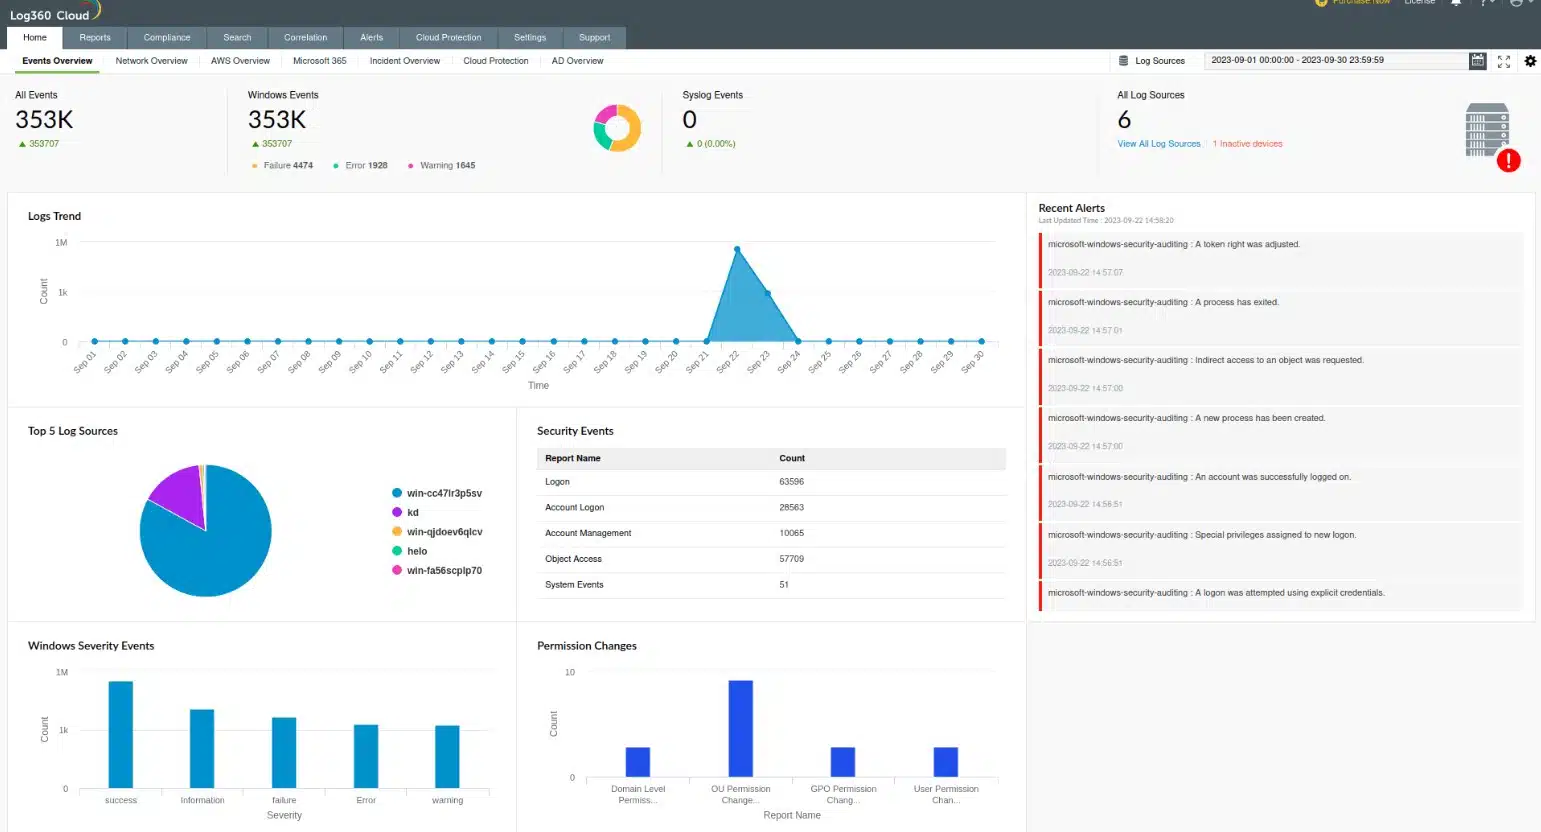
Features in the Log360 package include a threat detection feed to speed up threat hunting and compliance reporting for HIPAA, PCI DSS, FISMA, SOX, GDPR, and GLBA. The data viewer includes tools for manual data analysis.
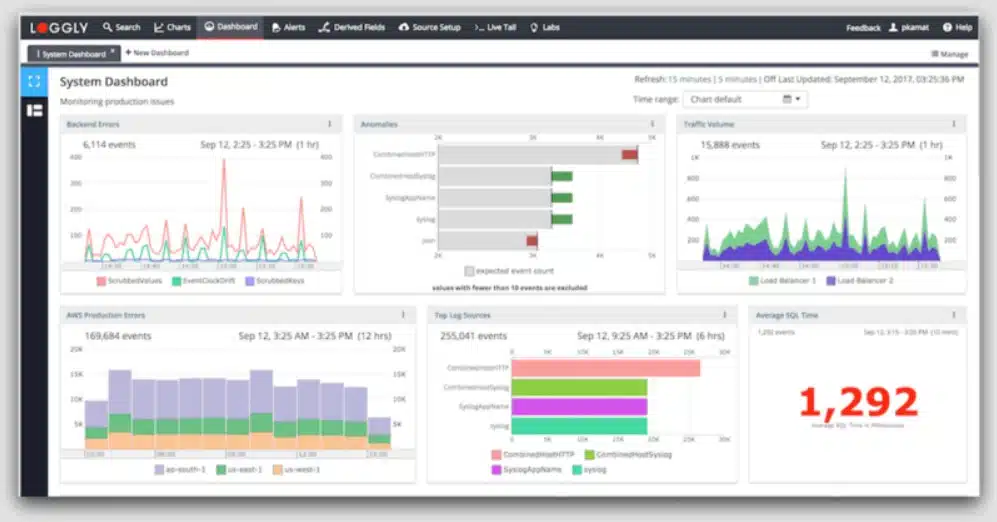
When the threat hunter discovers a suspicious event, it raises an alert. This is displayed in the system dashboard and you can also get alerts sent through your service desk system. The tool can work with ManageEngine ServiceDesk Plus, Jira, and Kayoko.
Who is it recommended for?
Although there are free versions of some of the components of Log360, there isn’t a free edition of the total package. Also, while the EventLog Analyzer module is available for Windows Server and Linux, and as a SaaS package, Log360 is only offered for installation on Windows Server. This is a very comprehensive package of data protection standards compliance tools that is suitable for use by large organizations.
Pros:
- Active Directory Protection: Offers specialized features for Active Directory security, enhancing overall network security posture.
- File Integrity Monitoring: Includes capabilities to monitor and alert on changes to critical files, safeguarding against unauthorized modifications.
Cons:
- Limited Deployment Options: Primarily available for installation on Windows Server, restricting its use in diverse IT environments.
The server for ManageEngine Log360 installs on Windows Server. You can get to know the tool with a 30-day free trial.
9. Site24x7 Log Management (FREE TRIAL)
Site24x7 Log Management is a unit on the Site24x7 cloud platform of system monitoring and management services. This package collects log messages from network devices, operating systems, and applications and consolidates them into a common format. The collated messages can be searched or filed together.
Key Features:
- Unified Log Handling: Gathers and standardizes log messages from various sources, facilitating centralized management.
- Analytical Tools Included: Comes equipped with tools for parsing and analyzing log data, enabling detailed investigation.
Why do we recommend it?
Site24x7 Log Management is included in all of the plans from the Site24x7 platform, so it provides an extra service alongside the network, server, and application monitoring units in the package. The service provides an opportunity to construct custom security services or to forward logs to a SIEM tool.
The dashboard for the Log Management service is based in the cloud and it can be accessed from anywhere through any standard Web browser. The console shows log message throughput statistics and segments these by source. This provides a quick view of system statuses because a sudden spike in log messages from one source could indicate a system error.
The package standardizes the format of each log message, which enables them to be stored or searched together – this process is known as “consolidation.” The dashboard shows data extracted from the records as they arrive, providing a sliding windows of statistics based on recent activity.
A data viewer within the console provides the opportunity to look at records as they arrive and it is also possible to search, sort, and filter them for analysis. The analytical formulas that you create can be set up to run continuously on all data and raise an alert if a problem is detected. This utility can form the basis of a customized SIEM but you can, instead, just forward all records to a third-party security scanning tool.
While it makes data available upon arrival, the Log Management system also files those records. These can be made available for compliance auditing and they can also be read back into the data viewer at a later date for analysis.
Who is it recommended for?
The Log Management unit of Site24x7 is included with all the plans on the platform, so, essentially, it is a free tool. The data processing volume is limited to 500 MB per month, which is only suitable for the smallest business. Larger companies can pay for extra capacity.
Pros:
- Comprehensive Monitoring Bundle: Included with Site24x7’s monitoring plans, offering added value without extra cost.
- Customizable Alerting: Allows for the creation of custom alerts based on log data, enhancing operational responsiveness.
Cons:
- Bundle-Only Availability: Not available as a standalone service, requiring subscription to Site24x7’s broader monitoring solutions.
Site24x7 runs on the cloud and provides a range of tools in plans. The Log Management service can’t be subscribed to individually but only as part of a bundle of services. You can examine any of the Site24x7 plans by accessing a 30-day free trial.
10. Paessler PRTG Network Monitor
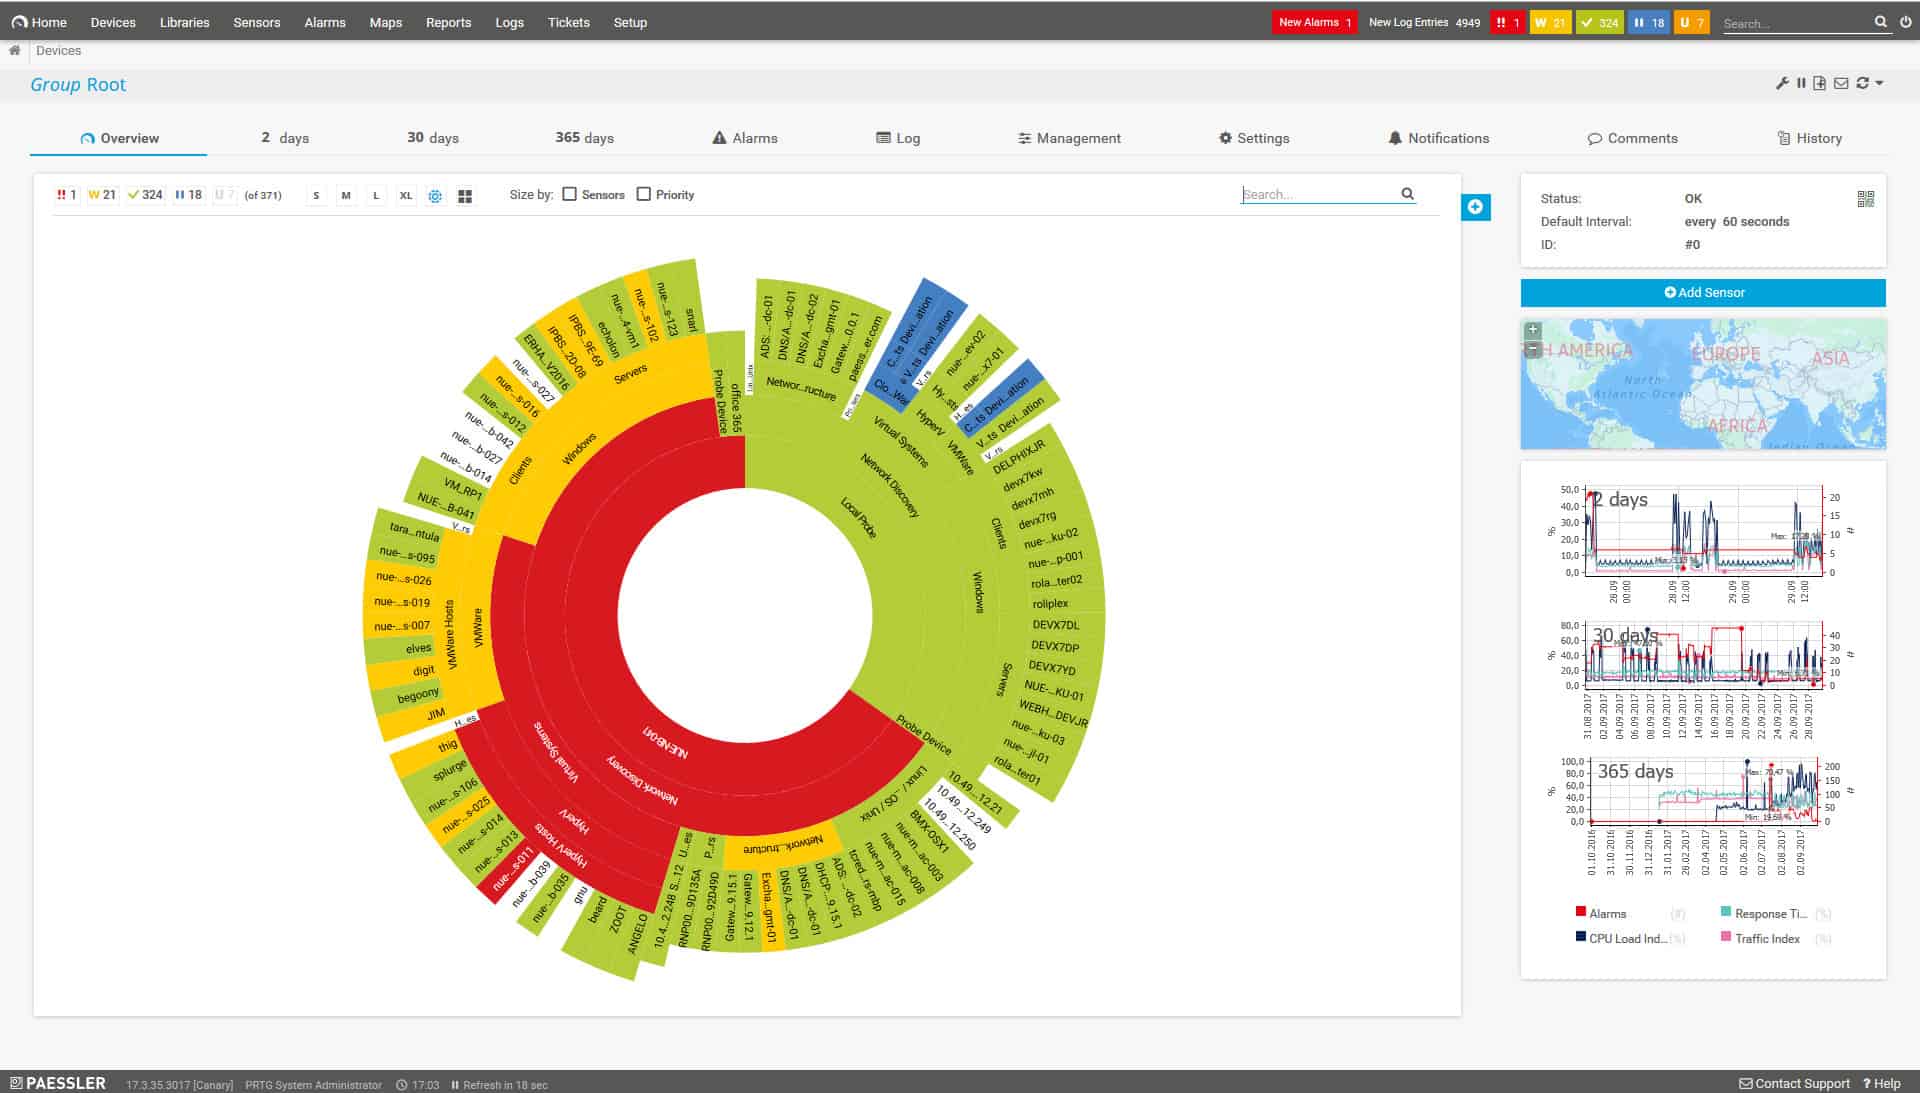
Paessler PRTG Network Monitor is a comprehensive monitoring tool for networks, servers, and applications. Log management is an integral part of systems administration and so Paessler made sure to include a log monitoring section in PRTG.
Key Features:
- Integrated Monitoring: Incorporates log monitoring with network, server, and application monitoring for a holistic view.
- Syslog and Windows Events: Collects critical log data, ensuring comprehensive coverage across IT infrastructure.
Why do we recommend it?
PRTG isn’t a log manager, rather it is a large package of system monitors that includes log collectors. The two collectors gather Windows Events and Sylog messages. You pay a fee for PRTG according to the number of sensors that you want and each instance of either of the log collectors counts as one of your allowance. However, if you forward all messages to one location and run a sensor there, you can avoid escalating costs.
Each monitoring interface in PRTG is called a sensor. Two sensors manage logs. These are the Windows Event Log sensor and the Syslog Receiver sensor.
PRTG Windows Event Log Sensor
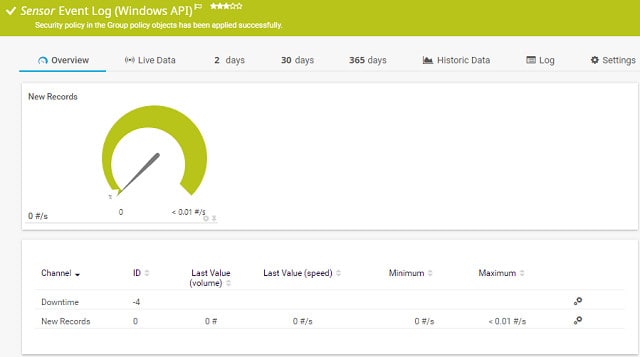
The Event Log Windows API sensor catches all of the log messages that a Windows system generates. This includes application alerts and operating system notifications. The sensor monitors the rate of log messages rather than the contents of each message. However, it does categorize those alarms by source or event type. The sensor will generate an alarm in the dashboard if the rate of event log messages escalates. Those notifications can be sent to you in the form of an email or an SMS message. You can customize alert notifications so that they are sent to different team members according to severity or source.
PRTG Syslog Receiver Sensor
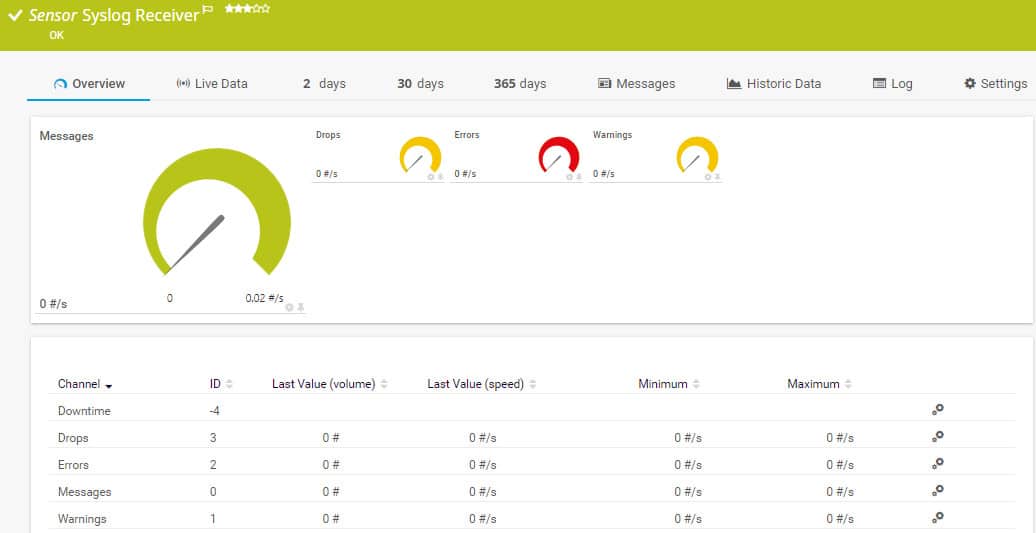
The Syslog Receiver sensor receives, monitors, and saves Syslog messages. This gives you a Syslog file management tool, but the sensor isn’t just a passive file creation function. The monitoring element of the receiver’s duties generates alarms if worrying conditions arise, such as an increase in the rate of file creation. You can set the conditions that trigger alerts, and you can decide to whom and how notifications are delivered.
Who is it recommended for?
PRTG is free to use for just 100 sensors. So, if you can pre-process logs and just use one Syslog collector and one Windows Event collector, you’ve got another 98 sensors spare for system monitoring. This could be an interesting proposition for small businesses, but then, you should compare that option to using NMIS and opEvents instead. For larger businesses, PRTG is one of the leading system monitoring packages available and it competes with the products of SolarWinds and Manage Engine. If you choose PRTG for system monitoring, it is worth using the log collectors.
Pros:
- Sensor-Based Approach: Offers flexible monitoring through customizable sensors, including log collection, to fit specific needs.
- Log Activity Insights: Identifies surges in log creation, aiding in the quick detection of potential issues or security breaches.
Cons:
- Limited Log Management: Focuses more on monitoring than on log consolidation or in-depth analysis, potentially requiring additional tools for those needs.
Paessler PRTG is free to monitor up to 100 sensors. If you want to use the tool to monitor your entire network, you will need a lot more sensors and that level of service is charged for.
11. Splunk
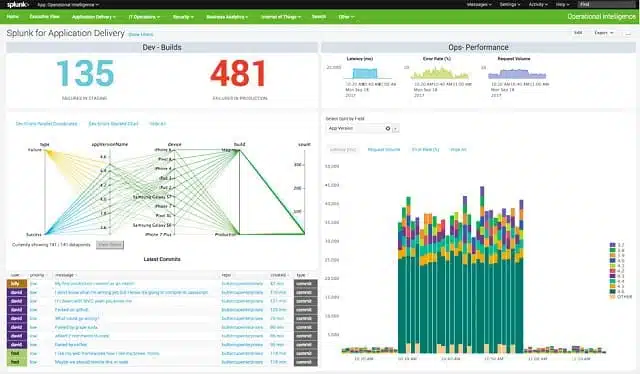
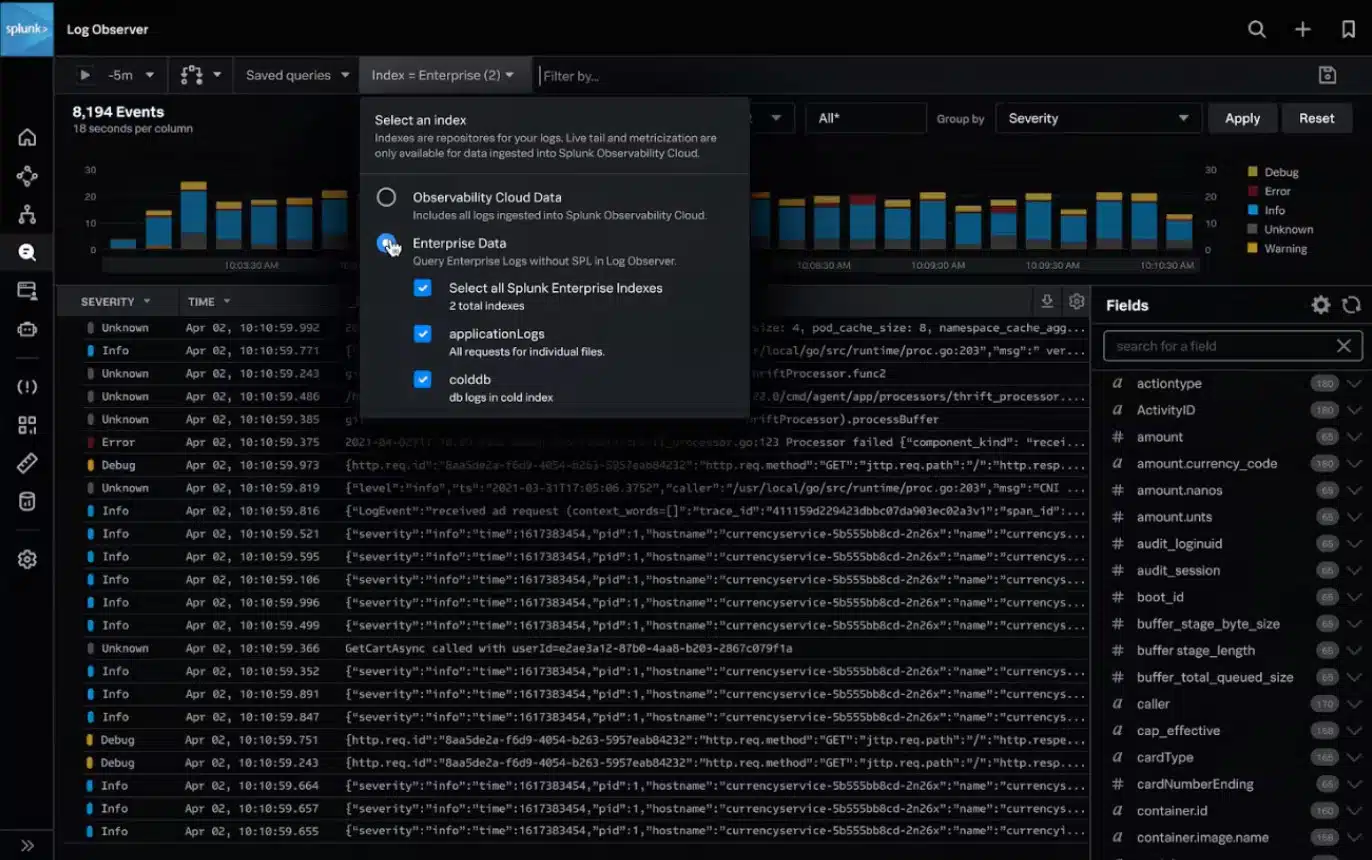
Splunk is a comprehensive log management solution for macOS, Linux, and Windows. The system is a well-known utility within the system administration community. Splunk, Inc produces three versions of its network data monitoring software. The top-of-the-line version is called Splunk Enterprise, which costs $173 per month. This is a network management system rather than just a log file organizer. Fortunately, Splunk is also available for free, making it into our list of Cronolog alternatives.
Key Features:
- Powerful Data Analysis: Renowned for its data search and analysis capabilities, making it a strong tool for log data insights.
- Flexible Log Input: Accepts logs and real-time data streams, offering versatility in data collection and analysis.
Why do we recommend it?
Splunk is an excellent data analyzer but it isn’t the best log manager on the list. It takes work to channel logs into Splunk because the system isn’t a collector. Access the free Splunk Forwarder to get log messages sent into the Splunk system and then set up file saving within the receiving server. However, you will still need to convert files from different sources and send all logs to the forwarder in the first place. However, the specialist packages added by Splunk, Inc. provide a range of services, such as a SIEM and a workflow automation system.
The free Splunk is restricted to input file analysis. You can feed in any of your standard logs or funnel real-time data through a file into the analyzer. The free utility can only have one user account, and its data throughput is limited to 500 MB per day. The system doesn’t explicitly deal with network alerts, but you could force that functionality by getting alerts written to a file and then bounced into Splunk.
Who is it recommended for?
Splunk is a good option if you go for one of the specialist packages that already has an application built into it, such as the SIEM option. The Free version is now limited to a trial period, so if you are a small business looking for a free log manager, there are better options on this list. Splunk excels at data analysis but it relies on other systems to collate the source files for that analysis. Therefore, if you are just looking for a log manager, this is not one of the best options on our list.
Pros:
- Extensive Integration: Can be integrated with a wide range of data sources and applications, enhancing its utility.
- Custom Application Development: Allows for the creation of custom search-based applications, including SIEM functionalities.
Cons:
- Collection Limitations: Not a dedicated log collector, requiring additional configuration for log management tasks.
A data sorting and filtering utility is built into Splunk, and you can write out to files from the analyzer. These features can emulate Cronolog by dividing log records by date and writing each group out to new files.
12. Fluentd
Like Cronolog, Fluentd runs on Linux systems — Debian, CentOS, and Ubuntu. It can also be installed on Mac OS, Amazon Linux, RHEL, and Windows. This cloud-based utility acts as a hub for log file information gathered by an agent on your system. The hosted log management tool can collect live data streams to create log files as well as monitor and manage existing files. One of the data sources that Fluentd is written to manage is the logging system of Apache.
Key Features:
- Flexible Deployment: Available for cloud or on-premises environments, offering adaptability to various IT setups.
- Extensive Plugin Library: Features a wide range of free plugins, enabling customization and extension of capabilities.
Why do we recommend it?
Fluentd is exactly the type of log collector and consolidator that you would need if you wanted to use Splunk for log analysis. This system is a pure log collector and manager that can be adapted to collect log messages from a very long list of sources. Crucially, Syslog and Windows Events are on that list.
Results from log record analysis can be made to trigger alerts, but these have to be processed by Nagios, or a Nagios-based monitoring system.
Who is it recommended for?
Fluentd is free and keeps life simple. The basic package doesn’t really have any log sourcing capabilities until you select a plug-in and activate it. This means that the package can be tailored to collect only the types of log messages that your systems generate. This is a great tool that collects and files log messages. If you want log analysis, you will need to pair Fluentd with another tool.
Pros:
- High Customizability: The open-source nature and plugin ecosystem allow for tailored log management solutions.
- Wide Source Compatibility: Supports a vast array of log sources, including Syslog and Windows Events, for comprehensive collection.
Cons:
- Graphical Interface Absence: Lacks a built-in GUI, which may increase the complexity of use for some users.
Fluentd is an open-source project so that you can download the source code. This tool is free to use.
The Fluentd website is the source for the program, and it is also the location of community pages where you can get help and advice on running the tool from other users. The core package can be extended through plugins written by other community members. Those plugins are usually free of charge.
You can use many other free interfaces as a front end for Fluentd, such as Kibana. The Fluentd utility can also be integrated with tools that include Elasticsearch, MongoDB, and InfluxDB for analysis.
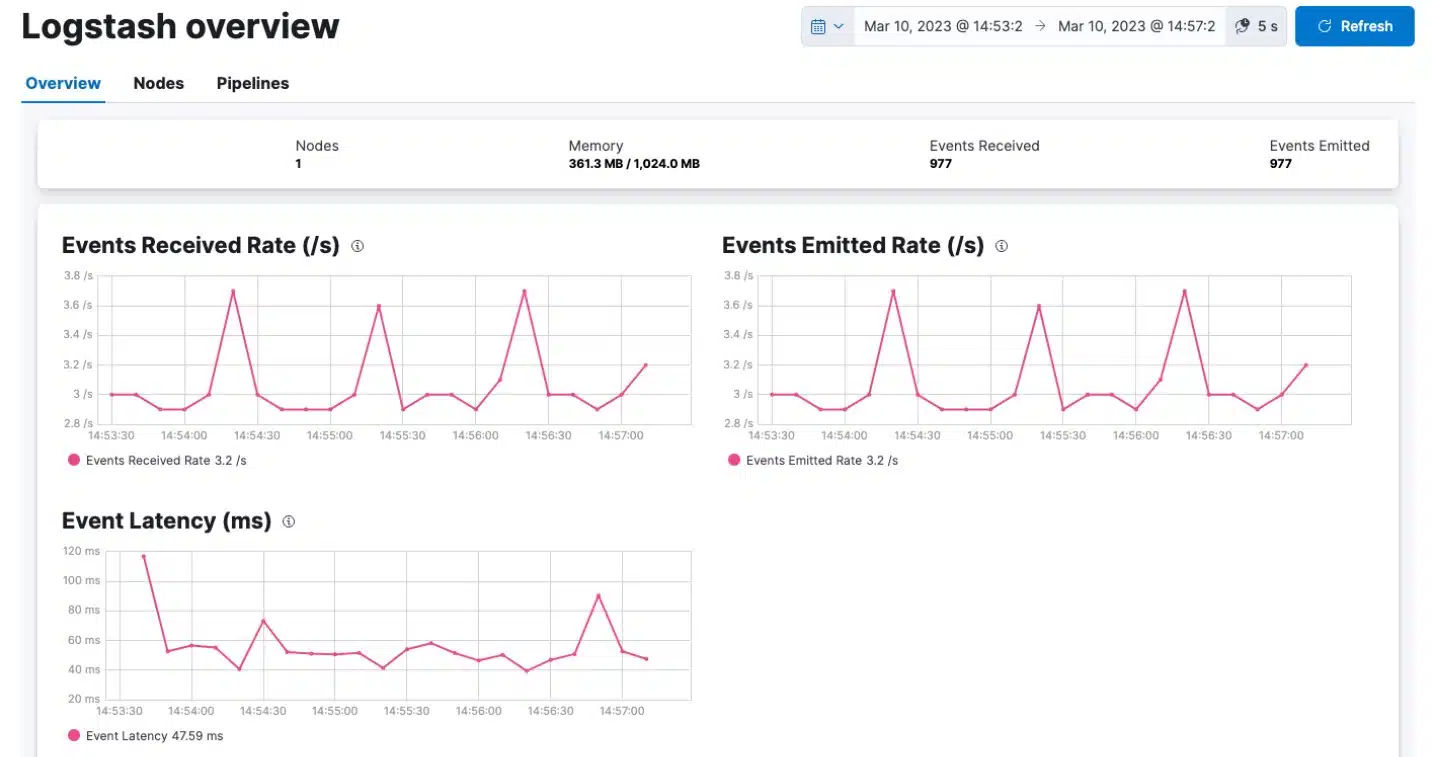
13. Logstash
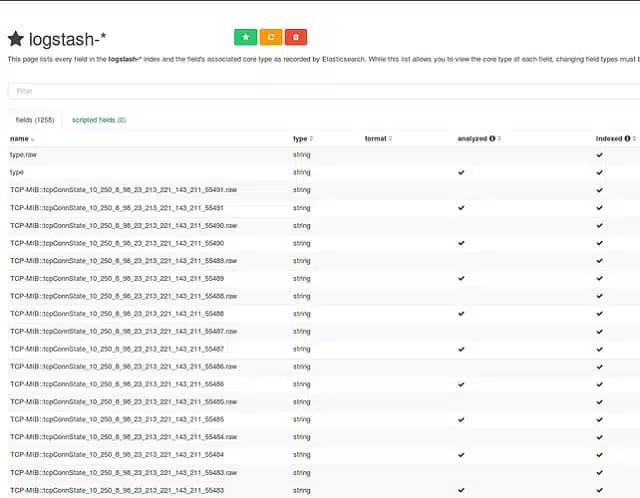
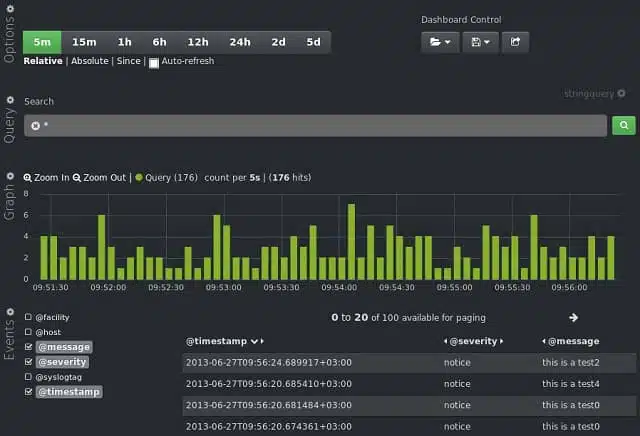
Logstash is a log creation facility produced by Elastic. This Dutch software organization has created a range of data exploration products that link together in the “Elastic Stack“. This suite of programs is open-source, and each product is available for free. The core element of the Elastic Suite is Elasticsearch. This is a searching and sorting utility that can process data from several files into unified results. Elasticsearch can be integrated into other tools and is available for use with many of the other utilities in this list.
Key Features:
- Part of ELK Stack: Integrates seamlessly with Elasticsearch and Kibana for a complete log management and analysis solution.
- Advanced Data Processing: Offers robust log collection, enrichment, and transformation capabilities.
Why do we recommend it?
Logstash is the log manager at the heart of the ELK stack. This tool is free for download or available on the cloud for a fee as part of the stack. Sematext provides an implementation of Logstash in its Sematext Logs offering. The Elastic Stack (ELK) is probably the most successful do-it-yourself data analysis package around and it includes Kibana (see below) as its data visualization front end. Logstash is a log server, so you will still need to organize a log client or point log-generating systems to transfer logs to Logstash in order to complete the log management process.
Logstash is the Elastic Stack’s data gathering tool. The functions of Logstash can be tailored to emulate Cronolog. The facility creates source files for analysis by other tools, such as Elasticsearch. The power of this tool is that it can collate data from several different sources. However, if you want to reorganize your Apache log files, there is no reason why you can’t limit the data search to just one source log file.
Who is it recommended for?
Logstash is free to use and has many cool features that let you create analysis reports on arriving log messages, you can split messages, convert their format, store them together, or file them to different locations according to conditional rules. If you want to fully analyze message contents, you will need Elasticsearch. This is a great free tool for those who like to create their own applications.
Pros:
- Highly Customizable: Flexible pipeline configuration enables tailored log processing workflows.
- Community Support: Benefits from a large community, providing plugins and configurations for diverse needs.
Cons:
- Expertise Required: Best suited for users with technical knowledge, given its configuration complexity.
The capabilities of Logstash include file parsing, so you can use this function to split up your log files by date. The output of Logstash can be formatted to suit a long list of utilities for analysis or display. It can also be written to a plain text file on disk, which is exactly what Cronolog used to do.
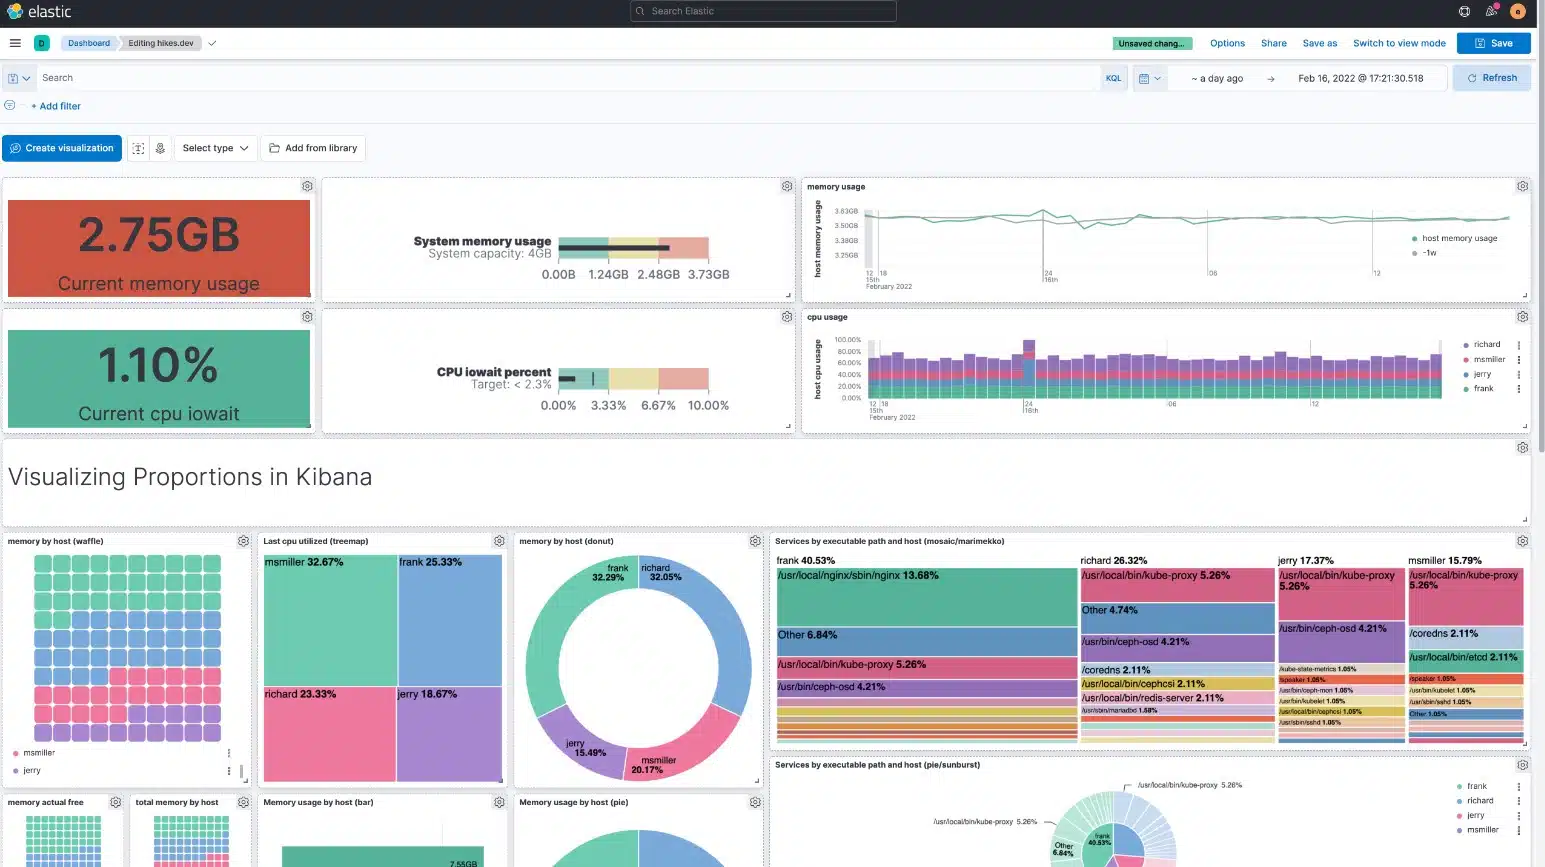
14. Kibana
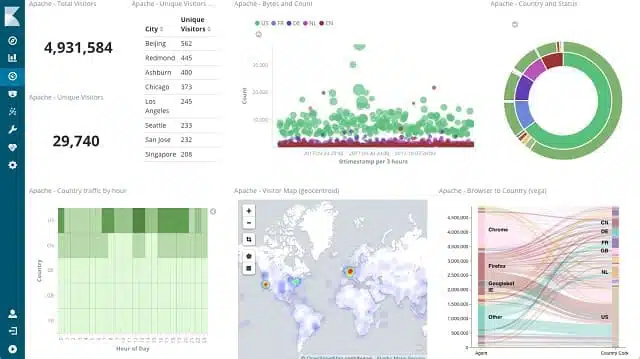
Elastic produces Kibana, which is an excellent free front end for any data gathering tool. Other useful tools in this list can funnel data to Kibana, so you don’t have to rely just on the other Elastic Stack programs to source data for this application.
Key Features:
- Data Visualization: Provides powerful tools for visualizing log data and analytics, enhancing data interpretation.
- ELK Stack Integration: Works seamlessly with Elasticsearch and Logstash for comprehensive log analysis.
Why do we recommend it?
Kibana isn’t specifically a log manager. Rather it is a data visualizing tool that can display any type of information, not just log-dependent data. Kibana is a free tool for self hosting or you can use it as [art of the ELK cloud-hosted SaaS package for a fee. Send Logstash statistics directly to Kibana or use Elastic Stack to mine logs for information and send that to the front end. This is a very flexible and widely-used tool.
The full capabilities of Kibana go way beyond the file parsing function of Cronolog. However, the full range of commands available with Kibana includes basic file management that can split out any log file by date. Kibana has a command language console that lets you create scripts and programs to process files. However, if you don’t have programming skills, the preset data manipulation facilities of the interface give you a lot of powerful data sorting and filtering utilities that will help you manage your log files.
Who is it recommended for?
Kibana isn’t an out-of-the-box solution and it doesn’t collect or file log messages. So, if you are just looking for a log server, this tool is not for you. Kibana is included here in this list because it works well as a front end for Logstash. You could use it to display data from other tools as well, so it is worth the effort of getting to know how to use Kibana.
Pros:
- Flexible Data Analysis: Offers extensive capabilities for exploring and visualizing data from various sources.
- Customizable Dashboards: Enables the creation of tailored dashboards to monitor and analyze log data effectively.
Cons:
- Limited Log Management: Primarily a visualization tool, requiring other tools like Logstash for log collection and management.
The interface includes time-based analysis tools including filters, so you can quickly isolate records in a log file that relate to a specific date. Raw data, graphs, and other visualizations can be written out to files or used to generate reports. Standard reports can be scheduled to run periodically, so creating a filter by date and setting it to run daily and output to a plain text file would give you exactly the same results that you used to get from Cronolog.
The benefit of using Kibana is that it can give much more assistance than Cronolog could. You can compare data from different sources and visualize the information from all of your system log files to analyze performance and forecast capacity requirements. To get a full data management facility, you should probably use Logstash to collate source data, Elasticsearch to sort data, and Kibana to display results. Kibana has plenty of data sourcing and manipulation facilities so that it could be used as a standalone data analysis tool.
15. XpoLog
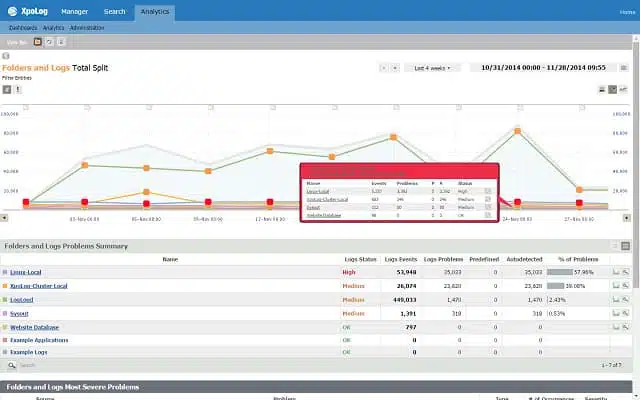 The two essential elements of Cronolog are that it could split up log files by date and that it could be run automatically. XpoLog includes both those functions. This is an excellent improvement on Cronolog, however, because XpoLog includes a lot of other functionality. It is a vast improvement on that discontinued log parsing tool.
Key Features:
- Versatile Deployment Options: Available as both cloud-based and on-premises solutions, offering flexibility for different IT environments.
- Advanced Log Analysis: Provides deep insights into log data with advanced analytics, helping identify issues and optimize performance.
Why do we recommend it?
XpoLog is part of a suite of log-based tools. This is the log manager and it is flanked by PortX, which is a log collector and forwarder, and LogX, which is a system monitor that uses log files for source data. The XpoLog system can be used on its own because it does have log gathering capabilities, but you will need to set your log generating systems to send to the XpoLog server. There are also some analytical features in the tool, which can report on issues such as log message throughput rates. The tool allows complicated direction of messages to different files or databases, which can even be implemented by splitting or interpreting a and sending it to multiple destinations.
XpoLog can analyze data from a range of sources, including Apache server logs, AWS, Windows and Linux event logs, and Microsoft IIS. The utility can be installed on Mac OS X 10.11, macOS 10.12 and 10.13, Windows Server 2008 R2, Windows Server 2012, Windows Server 2016, Windows 8, 8.1, and 10. The log management software can also be installed on Linux Kernel 2.6 and later. You can opt for a cloud-based version if you don’t want to install the software. You can access it through Chrome, Firefox, Internet Explorer, or Microsoft Edge.
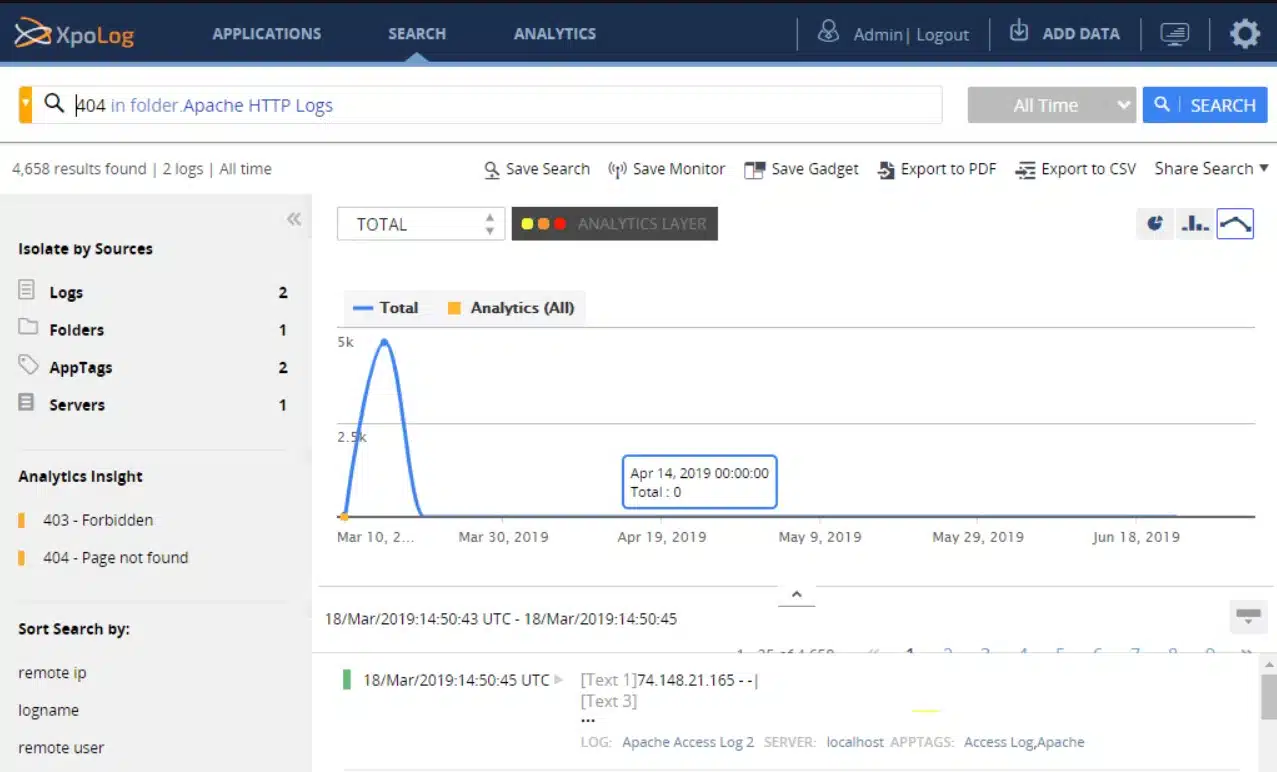
Apart from straightforward log file management, the XpoLog analysis engine detects unauthorized file access and helps optimize application and hardware usage. XpoLog gathers data from selected sources and will monitor those files that you include in its scope. Once data is centralized, XpoLog merges all data sources and creates its own database of records. Those records can be searched and filtered for analysis, and results can be written out to files. That functionality offers the same file parsing as Cronolog. Results can be written out to files or retained as archives for viewing through the XpoLog dashboard.
Who is it recommended for?
XpoLog is a cloud-based system that is packaged in a bundle with PortX and LogX. You can get the system for free forever to process 500 MB of data per day. There is a paid plan for the suite for higher data volumes. This is a good alternative to the Logstash/Elasticsearch system and it also competes with Sematext Logs. The suite doesn’t include a front end, but you could use Kibana for free in that role.
Pros:
- Comprehensive Log Management: Automates log collection, management, and analysis, streamlining operations and enhancing system visibility.
- Security and Compliance: Features file integrity monitoring for logs, aiding in compliance efforts and enhancing security posture.
- Free Version Availability: Offers a free tier for small-scale use, making advanced log management accessible to businesses of all sizes.
Cons:
- Annual Subscription Requirement: Paid plans require annual payment, which might be a constraint for businesses preferring monthly billing.
XpoLog is available for free. If you just want to split up your Apache log files, then the free version will be good enough. To deal with larger volumes of data and employ the system for analysis, then you might have to step up to one of the paid plans.
The free version allows you to process up to 1 GB of data per day, and the system will retain that data for five days. You could always write out the records to text files to get around that five day limit. The cheapest paid plan offers exactly the same data throughput limit and data retention period as the free service, so it is difficult to see why anyone would pay the $9 per month price tag for that package. More expensive plans give you an unlimited data retention period, with the cheapest unlimited option including an allowance of 1GB data throughput per day for $39 per month. You get progressively larger daily data throughput allowances at each price point. The top plan gives you a data throughput of 8GB per day and costs $534 per month. You have to pay for the service annually in advance, even though it has a monthly price. You can also buy a perpetual license.
16. Managelogs
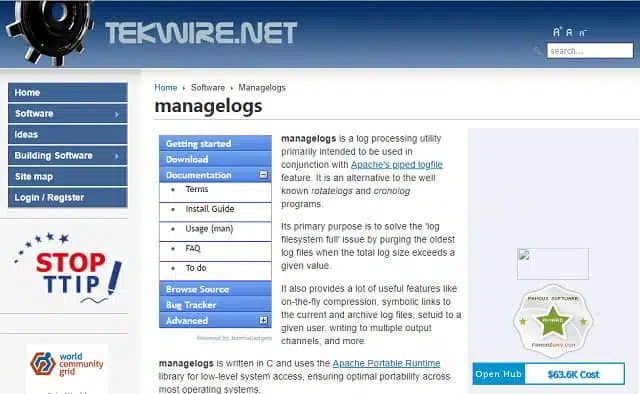
Probably the closest alternative to Cronolog, Managelogs is written in “C.” Not only is the utility free, but the source code is available for you to read through. The program is specifically designed to manage Apache web server logs.
Key Features:
- Apache Log Specialization: Tailored specifically for managing Apache Web Server logs, ensuring efficient log rotation and management.
- Lightweight and Efficient: A compact tool designed for simplicity and effectiveness in log file management.
Why do we recommend it?
Managelogs isn’t a general log manager; it is specifically written to deal with Apache Web Server logs. The benefit of this tool is that it will rotate logs by date. So, this isn’t a feature rich system but just good enough to get your Apache Web Server log messages filed by date.
Managelogs has different operating modes activated by the variables specified when launching the program. You can set the utility to archive log files by date, or you can specify a maximum file size, which will copy over the log file to a new name and then clear out the current log file so it can start again from scratch and build up new records.
Who is it recommended for?
Managelogs is suitable for network managers and Webmasters that don’t want to deal with any other logs and just want to get their Apache logs filed. This isn’t the only system on this list that can handle Apache Web Server logs and so, although it’s free to use, you wouldn’t need this tool if you opt for Logstash, Sematext Logs, or Fluentd.
Pros:
- Open-Source Flexibility: Users can modify the source code to fit their specific needs, offering unmatched customization.
- Effective Log File Rotation: Manages and rotates Apache logs with precision, preventing file size overflow and facilitating easier log analysis.
- Adaptability: Though primarily designed for Apache, its open-source nature allows adaptation for other log sources with programming effort.
Cons:
- Programming Knowledge Required: To extend or customize functionality, users need proficiency in C programming, limiting accessibility for non-technical users.
- Niche Application: Focused solely on Apache Web Server logs, which may necessitate additional tools for broader log management needs.
If you specify that logs should be split by date, Managelogs will ensure that files are consolidated across sessions, so stopping and restarting the server manager won’t wipe out existing records on an incomplete day.
DIY log archiving
You can write your own copy of Cronolog as a script for Unix or Unix-like operating systems such as Linux and Mac OS. Although there are plenty of clever things you can do with regular expressions and pattern matching to pick out records for a specific date, the easiest way to get log archives per day is to write a copy script and then schedule it to run at midnight. If the last instructions in the script remove the existing file, new records will accumulate in a separate file throughout the day, to be archived off again at midnight.
DATE=`date +%Y%m%d` MV=/usr/bin/mv LOGDIR=/opt/apache/logs LOGARCH=/www/logs FILES=”access_log error_log” CP=/usr/bin/cp for f in $FILES do $CP $LOGDIR/$f $LOGARCH/$f.$DATE.log $MV $LOGDIR/$f $LOGDIR/$f.$DATE.saved done cat /dev/null > /opt/apache/logs/access_log |
Replace Cronolog
Don’t get stressed that cronolog.org is no longer operating or that none of the download sites that used to deliver Cronolog no longer list it. Cronolog was not that great, and you could quite easily write your own version in just a couple of minutes.
Log management utilities are very useful and despite the limited capabilities of Cronolog, many systems administrators came to rely on its services. As you can see from this review, many other log management tools & analysis software, not only give you the ability to parse your log files by date, but also give you some amazing data visualization and analysis features. Our Editor’s choice is an excellent example of this – SolarWinds Security Event Manager.
Every one of the recommendations in our list of Cronolog replacements can be used or tried for free. All of these facilities give you better service than the do-it-yourself replication of Cronolog. Try out any of these tools and see which of them gives you the extra features needed to improve log and facilities management.
Log Management FAQs
What is log aggregation?
Log aggregation combines log files from different sources so that they can be unified for analysis. Different logging systems deploy individual file formats, so log aggregators need to convert log file contents into a unified format. Once all files have the same record layout, they can be submitted together to analytical tools for sorting, searching, filtering, and summarizing.
How do I collect application logs?
One of the main sources of application logs is the Windows Event system. These are very easy to collect in Windows environments.
- Get to the Control Panel.
- Select System and Security.
- In the System and Security folder look for Administrative Tools and click on the View event logs link.
- In the left tree menu of the Event Viewer, expand Windows Logs.
- Click on Application.
- In the Actions menu in the right-hand side panel, click on Save All Events As.
- In the popup file browser select a folder for the log file.
- Give the log file a name. It will be given the .evtx extension. Press Save.
- In the display Information popup, click OK.
What is centralized log management?
Log files and event messages get generated by most applications and operating systems but most people ignore them. You can get a lot of information about the operations of your IT infrastructure if you pay attention to these messages and if you want security standard accreditation, you need to have a comprehensive log management policy. Centralized log management requires you to collect all log files and store them in one place. Many businesses use cloud storage for this activity. Aggregating logs for analysis is also a good idea.
How do you manage logging in the enterprise?
A log management plan needs a strategy. You need to grade the log message sources in order of importance. Next, all log files need to be standardized and stored centrally. A log file analyzer will help you to get useful information from your logs. Look for a log managing package that will support all of these log management activities.
I suggest you to add Motadata log management in your list. https://www.motadata.com/product/log-management-and-flow-analytics/log-management/