Under the disruptive influence of cloud computing and containerized technology, networks have become increasingly opaque. Modern enterprises are using technology that is more complex and faster-pace. Yet for all these changes, NetFlow, a technology developed in the 1990s has remained a staple for network security and quality of service monitoring.
What is NetFlow?
NetFlow is a network protocol and Cisco IOS application that was developed by Cisco to collect and monitor traffic data generated by routers and switches (many routers have a NetFlow feature that automatically records NetFlow data). Devices compatible with NetFlow produce data that can be exported to a NetFlow collector/software agent.
After exporting NetFlow data, an administrator can use a NetFlow traffic analyzer to view visual representations of this flow data to gauge the performance of the network. For example, if there is an unusual spike in traffic then a NetFlow Analyzer will send you an alert.
Identifying abnormal levels of traffic is useful for diagnosing cyber attacks like DDoS attacks so the user can take steps to mitigate it ASAP. In other words, using NetFlow is a great way to monitor and troubleshoot your network.
Here is our list of the best NetFlow analyzers:
- SolarWinds NetFlow Traffic Analyzer EDITOR’S CHOICE This companion to the Network Performance Monitor collects traffic data from any network device using a range of protocols, including Cisco’s NetFlow. Runs on Windows Server. Get a 30-day free trial.
- ManageEngine NetFlow Analyzer (FREE TRIAL) A traffic data collector and analyzer that provides live information on link performance, spotting bottlenecks, and the speed of data transfers per protocol. Available for Windows Server, Linux, and AWS. Start a 30-day free trial.
- Site24x7 Network Monitoring (FREE TRIAL) This cloud platform provides packages of monitors that cover networks, servers, and applications and include NetFlow analysis. Start a 30-day free trial.
- Paessler PRTG Network Monitor (FREE TRIAL) A flexible package of network, server, and application monitoring tools that includes NetFlow collection and analysis. Runs on Windows Server. Start a 30-day free trial.
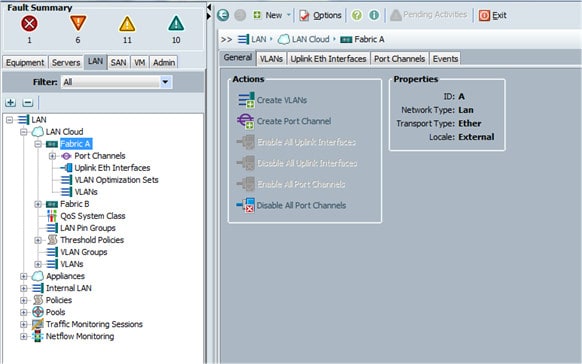
Configure and verify Cisco NetFlow with the Cisco UCS Manager GUI
While Cisco 7200, 7500, 7400, MGX, and AS5800 are all compatible with the NetFlow application, you will have to purchase a feature license to be able to use the NetFlow function.
Before enabling NetFlow you need to configure your router for IP routing, enable Cisco Express Forwarding, distributed Cisco Express Forwarding, or fast switching. In this example, we’re going to be configuring NetFlow through the Cisco UCS Manager graphical user interface (GUI).
Cisco UCS Manager is a system used to communicate with routers and switches across a network. It includes adapters like Cisco UCS VIC 1225, Cisco UCS VIC 1240, and Cisco UCS VIC 1280. To configure NetFlow with UCS Manager:
- Go to the LAN tab > NetFlow > General page and check the radio button. Define a Flow Record
- Now we need to define a flow record. To do this click the LAN tab > NetFlow Monitoring.
- Next, right-click on Flow Record Definitions > Create Flow Record Definition.
- Go to the Create Flow Record Definition dialog box and enter a Name and a Description. Now go to the Define Keys section and select one of the following: L2keys, IPv4keys, or Ipv6keys. These refer to Layer 2 Switched, IPv4, and IPv6.
- Go to the Select Measured Fields(non-keys) box and check the fields you want to include with the flow data. Options include; Counter Bytes Long, Counter Packets Long, Sys Uptime First, and Sys Uptime Last. Define a Flow Collector
- Once this is done it is time to define a Flow Collector. To do this go to the LAN tab > NetFlow Monitoring > Flow Collectors and click the Add button.
- Go to the Create Flow Collectors box and enter a Name and Description for the flow collector. Now enter the Collector IP, Port, Exporter Gateway IP, and VLAN. Define a Flow Exporter
- After this, we need to define a Flow Exporter. Go to the LAN tab > Network Monitoring > Flow Exporters > Create Flow Exporter. Enter a Name and a Description. Now fill out the rest of the form options: DSCP, Exporter Profile, Flow Collector, Template Data Timeout, Option Exporter Stats Timeout, and Option Interface Table Timeout. Define a Flow Monitor
- Now it’s time to define a Flow Monitor. To do this go to LAN > NetFlow Monitoring > Flow Monitors (icon)and press Create Flow Monitor. Enter a Name and a Description. Then enter a Flow Definition, Flow Exporter 1, Flow Exporter 2, and Timeout Policy. Define a Flow Monitor Session
- After defining a Flow Monitor we need to Define a Flow Monitor Session. We can do this by going to LAN > Network Monitoring > Flow Monitor Sessions. Press Create Flow Monitor Session, then enter a Name and Description. Under the Host Receive Direction Monitor, select the flow monitor you want to use from the list or press Create Flow Monitor if you want to create one.
- Under the Host Transmit Direction Monitor 1 parameter, select the flow monitor you want to use from the list or use the Create Flow Monitor option to create one. Fill out the Host Receive Direction Monitor 2 and Host Transmit Direction Monitor 2 parameters with any additional configurations. Assign a Flow Monitor Session to a vNIC
- Now we need to Assign a Flow Monitor Session to a vNIC. Click LAN > NetFlow Monitoring > Flow Monitor Sessions and select the Flow Monitor Session you want to configure. Set the Flow Exporter Profile default and then go to Properties and expand the vNICs option. Click the Add button and then select which vNIC you want to use with the flow monitor session.
- Save the changes and finish.
Configure and verify Cisco NetFlow through a Command-line interface
If you want to use the Command Line Interface (CLI) to configure NetFlow on an interface then this is another alternative to the GUI. The process to configure and verify NetFlow is relatively simple:
- To enable EXEC mode, enter the following command:
router > enable
- Now, enter Global Configuration Mode by entering the configure command:
router > configure terminal
- Select the interface you want to configure for NetFlow by typing the number:
router > interface ethernet 0/0
- Next, we need to Enable NetFlow ingress and egress on the interface. To do that enter these two commands:
router > ip flow ingress
router > ip flow egress
- If you want to enable NetFlow on another interface use the following command to return to Global Configuration Mode:
router > exit
- Then repeat the entire process until you have configured all the interfaces you need.
- To finish, use the End command to return to EXEC mode:
router > end
Verify that NetFlow is Up and Running
To ensure that NetFlow is operational you can use the show IP flow interface, show IP cache flow, and show IP cache verbose flow commands:
- Use the show IP flow interface command to view the NetFlow configuration for the interface:
router > show ip flow interface
- Use the show ip cache flow command to verify that NetFlow is working alongside a summary of statistics:
router > show ip cache flow
- Use the show ip cache verbose flow command to verify that NetFlow is working alongside a summary of statistics. It can be used to view Source Mask and AS, Destination Port Mask AS, ToS and TCP, Flow Rate, and more. To use the command enter the following:
router > show ip cache verbose flow
NetFlow Collectors and Analyzers
After you’ve finished configuring NetFlow the next stage is to choose a flow collection tool. Even after following the steps above you won’t be able to use NetFlow unless you have a software agent/NetFlow analyzer to collect the information generated by your devices. The good news is that these tools are widely available.
Our methodology for selecting NetFlow monitoring systems
We reviewed the market for network monitoring systems that analyze NetFlow data and assessed the options based on the following criteria:
- A package that can communicate with Cisco network devices to extract NetFlow data
- The ability to communicate with the network devices from other producers to extract data
- An interpreter that delivers live NetFlow data in charts and graphs
- A facility that stores NetFlow data for traffic analysis and network capacity planning
- Integration with network mapping and device status tracking tools
- A free trial or a demo that provides an opportunity to assess the system before buying
- Value for money from a network traffic analyzer that can operate in a multi-vendor environment
In this section we’re going to look at four platforms:
SolarWinds NetFlow Traffic Analyzer (FREE TRIAL)
SolarWinds NetFlow Traffic Analyzer is a NetFlow traffic analyzer and bandwidth monitoring tool that you can use to view NetFlow outputs. The tool allows you to view IPv4 and IPv6 flow data. It also has a GUI with performance dashboards where you can see NetFlow sources and an overview of the Top Bandwidth Hogs within the network.
Key Features:
- Companion to the Network Performance Monitor
- Collects traffic data
- Graphs and charts
- Bottleneck detection
- Traffic shaping
Why do we recommend it?
SolarWinds NetFlow Traffic Analyzer is able to collect NetFlow data and process it into traffic activity analysis. The tool offers a range of data display formats that include graphs and tables of data. The package isn’t limited to NetFlow because it can also communicate with sFlow J-Flow, IPFIX, and NetStream.
For example, you could look up the name of a switch in your network and view the Traffic In, Traffic Out, Last Received NetFlow, and Last Received CBQOS to see if traffic is normal.
The software has an alert system so you receive alerts when there is a fluctuation in traffic that you need to take note of. You can configure when alerts are generated with custom parameters. For example, you can set a Trigger Condition as when Application traffic exceeds the threshold and then set an Ingress Traffic parameter.
Who is it recommended for?
This software package runs on Windows Server and it will communicate with all network devices that have NetFlow capabilities enabled. You need to also have the Network Performance Monitor installed for this package to work. You can buy both modules together with the Network Bandwidth Analyzer Pack.
Pros:
- Excellent user interface, easy to navigate and remains uncluttered even when used on high-volume networks
- Supports multiple networking technologies such as Cisco Netflow, Juniper Networks J-Flow, and Huawei Netstream, making it a hardware-agnostic solution
- Pre-built templates allow you to pull insights from packet capture right away
- Built for the enterprise, offers SLA tracking and monitoring features
Cons:
- Built for enterprise companies that process a lot of data, not the best fit for small LANs or home users
The tool starts at a price of $1,168 (£901). There is also a 30-day free trial version.
EDITOR'S CHOICE
SolarWinds NetFlow Traffic Analyzer is our top pick for a NetFlow monitoring tool because it works together with the SolarWinds Network Performance Monitor to detect and map all network devices and then track their statuses and data throughput performance. This package provides opportunities to observe traffic segmented by a range of factors, such as application, source device, or destination, and promotes route analysis and capacity planning through graphical displays and forecasting. This tool is also able to communicate with the network devices provided by other suppliers, including Juniper Networks and Huawei to fully support a multi-vendor environment.
Download: Get a 30-day free trial
Official Site: https://www.solarwinds.com/netflow-traffic-analyzer/registration
OS: Windows Server
ManageEngine NetFlow Analyzer (FREE TRIAL)
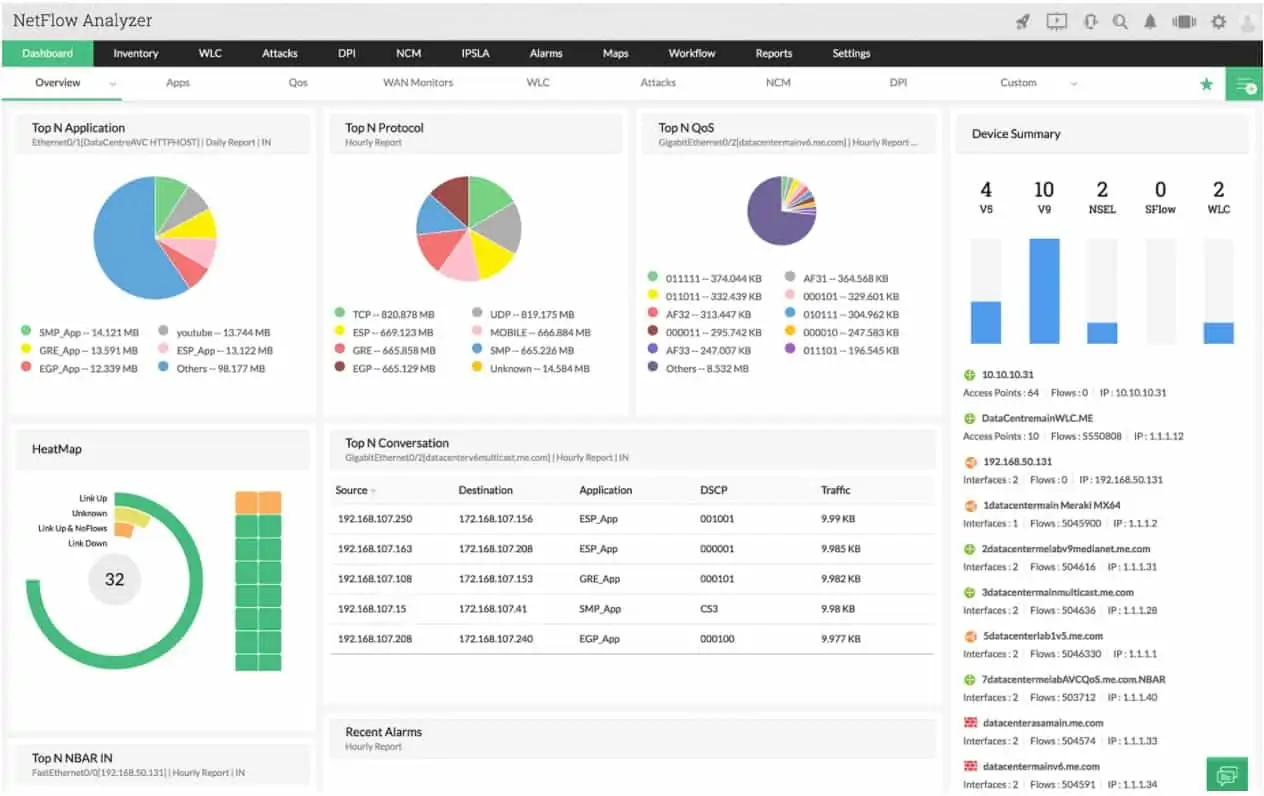
ManageEngine produces its NetFlow Analyzer as a complement to its main network monitoring system, which is called OpManager. If you buy both packages, they will slot together.
Key Features:
- Works with OpManager
- VoIP traffic prioritization
- Live traffic flows
- Trend analysis
Why do we recommend it?
ManageEngine NetFlow Analyzer is very similar to the SolarWinds NetFlow Traffic Analyzer. This package is also able to communicate with the J-Flow, sFlow, Appflow, NetStream, and IPFIX protocols. The tool will assist with the implementation of traffic shaping measures, such as queueing, and can produce IP SLA statistics.
The NetFlow Analyzer is able to query switches and routers built by Cisco Systems through the use of the NetFlow protocol. The tool can also communicate with Juniper Networks equipment by the use of J-Flow and with Huawei NetStream. The software is also able to communicate using sFlow, IP-FIX, and AppFlow.
Use this monitoring system to watch over traffic patterns on your network. You will also be able to implement QoS traffic shaping for interactive applications, such as VoIP. The package also has Cisco NBAR capabilities built into it for port recognition.
Who is it recommended for?
This is a standalone package. The tool is available in a Free edition, however, it will only monitor two interfaces. The Professional edition connects to 10 interfaces, making it suitable for small businesses. Plans go all the way up to a multi-site edition for very large companies.
Pros:
- Supports multiple protocols like NetFlow, great for monitoring Cisco equipment
- Both tools work well alongside each other to help view traffic patterns and bandwidth usage
- Easy-to-use interface automatically highlights bandwidth hogs and other network traffic outliers
- Can proactively monitor switch port status to identify failing ports and misconfigurations
Cons:
- Built for enterprise use, not designed for small home networks
ManageEngine NetFlow Analyzer is an on-premises package that will run on Windows Server and Linux. You can examine this package on a 30-day free trial.
Site24x7 Network Monitoring (FREE TRIAL)
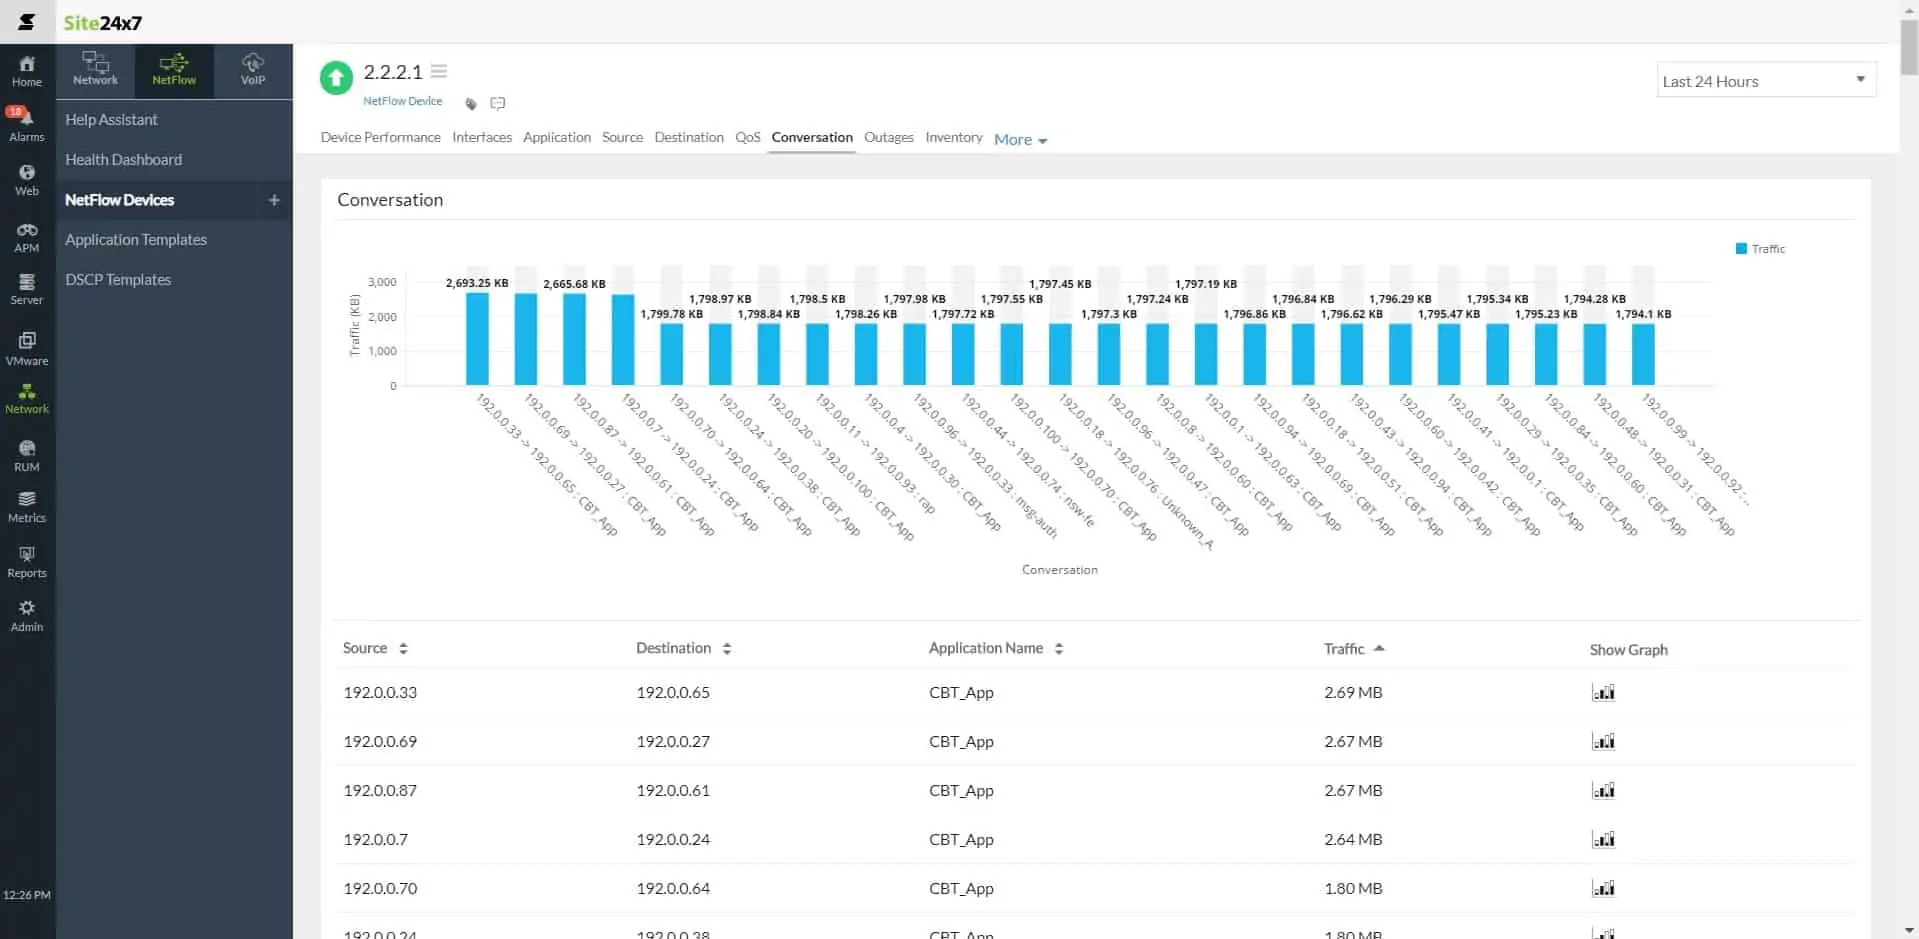
Site24x7 is a SaaS platform that offers a range of system monitoring and management packages. Network Monitoring is the Site24x7 service for traffic monitoring and management. The system can monitor network device statuses with SNMP and also track traffic patterns with NetFlow.
Key Features:
- Full stack monitoring
- NetFlow traffic shown on maps
- Protocol analysis
Why do we recommend it?
The cloud-based Site24x7 platform offers bundles of monitoring systems and its network observability services include network device monitoring, log collection, network configuration management, and traffic analysis. That traffic analyzer is able to gather statistics using NetFlow and also IPFIX, sFlow, J-Flow, Cflow, AppFlow, and NetStream.
The tool is able to work with multi-vendor networks because it can communicate with devices supplied by Juniper Networks, D-Link, Dell, HP, and Canon, as well as Cisco Systems. In fact, the monitoring tool can extract traffic data from devices produced by a list of 450 vendors.
Overall, the Site24x7 Network Monitoring service will watch over switches, routers, firewalls, VPNs, wireless systems, load balancers, WAN accelerators, storage servers and devices, UPS units, and printers.
Who is it recommended for?
The network monitoring tools in Site24x7 are bundled in with plans that cover your entire system. These plans are sized and priced to be accessible for small businesses and larger organizations pay a supplement for more capacity. So, the system is suitable for businesses of all sizes.
Pros:
- Flexible cloud-based monitoring option
- Offers a host of out-of-box monitoring options and dashboard templates for SQL server
- Allows administrators to view dependencies within the application stack, good for building SLAs and optimizing uptime
- Offers root cause analysis enhanced by AI to fix technical issues faster
- Can unify SQL monitoring across multi-cloud environments
Cons:
- Site24x7 is a feature-rich platform with options that extended beyond databases management, may require time to learn all options and features
As it is resident on the cloud, this monitoring system isn’t limited to watching over one network. It can monitor multiple networks and connections to cloud platforms wherever they are located. Site24x7 Network Monitoring is available on a 30-day free trial.
Paessler PRTG Network Monitor (FREE TRIAL)
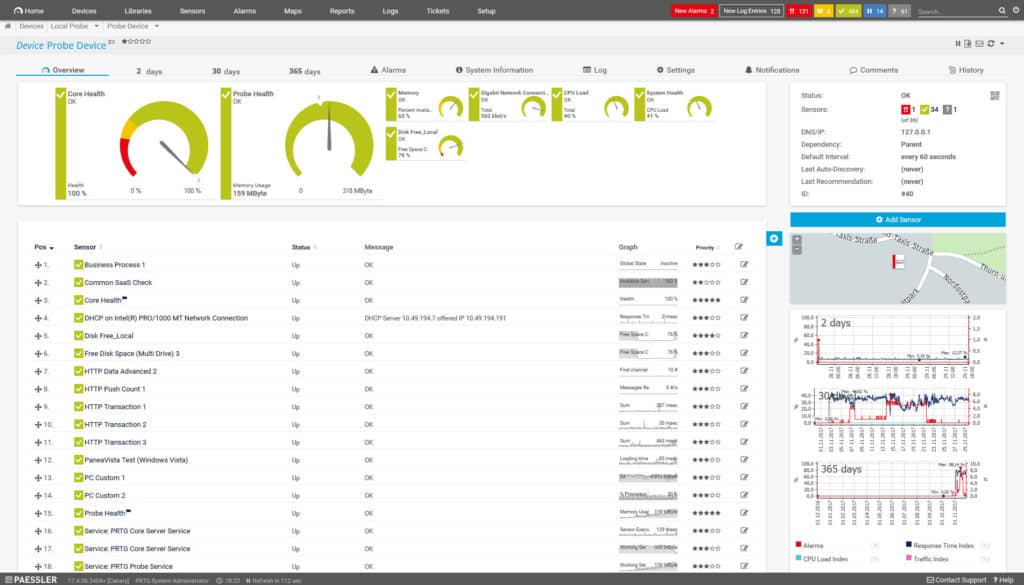
PRTG Network Monitor is a piece of network monitoring software that can monitor NetFlow traffic. It supports all NetFlow versions and provides a GUI to monitor devices. You can monitor NetFlow with sensors. There is a NetFlow V5 sensor and a NetFlow V9 sensor.
Key Features:
- Part of a large monitoring package
- Mapping and traffic flows
- Free version
Why do we recommend it?
Paessler PRTG Network Monitor is an adaptable package. The system includes a network discovery service that is driven by SNMP. The package has sensors that can communicate with network devices, using NetFlow, sFlow, J-Flow, and IPFIX. You can simultaneously monitor server and application performance as well with this package.
The sensors measure network traffic in kbit per second in a variety of formats (including, FTP/P2P, DHCP, DNS, Ident, ICMP, SNMP, IMAP, NetBIOS, SSH, Telnet, HTTP, HTTPS, UDP, TCP, and more). All traffic is presented in a graphical overview which shows a Top Talkers, Top Connections, and Top Protocols, alongside a time period of your choice.
Who is it recommended for?
Buyers of PRTG pay for an allowance of sensors and then chooses which of the many monitoring tools in the package to turn on. This means that no customer ends up paying for services that they don’t need. If you only turn on 100 sensors, you never have to pay for the package. This system is available as a SaaS platform or for installation on Windows Server.
Pros:
- Designed to be an infrastructure monitoring tool that supports multiple sensors types such as NetFlow, sFlow, and J-Flow
- Offers additional monitoring on the same platform, supporting infrastructure, network, and application performance monitoring
- Supports multiple channels and integrations for alerts
- Uses easy-to-read graphing for traffic visualization
Cons:
- Very detailed platform, takes time to learn and fully utilize all of the features available
The sensors can be configured to send you alerts via email and SMS if traffic reaches unusual levels. The price of the Paessler PRTG Network Monitor starts at $1,600 (£1,232) for 500 sensors and one server installation. There is also a 30-day free trial version.
Managing Performance and Security Events with NetFlow Monitoring
Once NetFlow is configured on your devices you’ll be able to monitor packets transmitted throughout your network. NetFlow monitoring is extremely useful as part of your network monitoring strategy because it allows you to view traffic and to identify cyber-attacks like DoS or DDoS.
If you plan to use a NetFlow monitoring to oversee your network then it is a good idea to download a NetFlow analyzer. It will provide you with a GUI to monitor traffic and make it easier to identify cyber-attacks. Monitoring traffic will help you to keep a watchful eye on performance and security events.
NetFlow FAQs
What is NetFlow used for?
NetFlow is a traffic data statistics gathering system that was created by Cisco Systems. The NetFlow protocol defines a record structure and a method of sampling and storage for traffic data within a network device. This data is available for access by a monitoring tool, which is then able to provide more analytical functions.
Is NetFlow TCP or UDP?
NetFlow is a UDP protocol and it uses port 2055. There are other UDP ports that can be used additionally for NetFlow access transactions and these are 9025, 9026, 9555, and 9995.
What is the difference between NetFlow and SNMP?
NetFlow is a traffic sampling system that also collates throughput data to show the activity on each active interface on a network device. The Simple Network Management Protocol also collates throughput information but its main concern is to maintain a list of device components and reports on whether they are operating satisfactorily.
