If your PCs perform poorly then your employees won’t be able to work effectively. However, it can be a tall task to monitor a network full of computers, which is why you need PC monitoring software.
A good PC monitoring tool can scan your network and check for hardware-related connectivity issues, damaged disks, and underperforming devices to assist you in taking a proactive approach and implementing any precautionary measures.
Here is our list of the best PC monitoring software:
- SolarWinds Network Performance Monitor EDITOR’S CHOICE Network monitor that can automatically discover SNMP devices. Includes an alerts system. Start with the 30-day free trial.
- SuperOps RMM (FREE TRIAL) This cloud-based SaaS package reaches out to monitored networks with an on-site agent and provides discovery and monitoring for PCs and other workstations as well as servers and networks. Access a 21-day free trial.
- ManageEngine Endpoint Central (FREE TRIAL) A management system for computers and mobile devices that includes software version tracking and security monitoring. Available as a SaaS platform or for download onto Windows Server. Start a 14-day free trial.
- Site24x7 Server Monitoring (FREE TRIAL) This package is able to monitor all endpoints, such as PCs, not just servers. It is delivered from the cloud. Start a 30-day free trial.
- Paessler PRTG Network Monitor (FREE TRIAL) Network monitoring software that can monitor Windows, Linux, and Mac computers. Includes an alert feature. Download the 30-day free trial.
- Zabbix Open-source network monitoring tool for Linux that monitors the status, temperature, CPU, memory utilization, and more computers.
- Scalefusion This cloud-based solution provides device management for desktops, including PCs. It can also manage smartphones, tablets, and laptops for all different OS types.
- HWMonitor Hardware monitoring solution for Windows that monitors the voltage and temperature of computers with sensor chips such as the ITE IT87 Series and Winbond ICs.
- Nagios XI Network monitoring platform that can monitor Windows and Linux computers. Includes a web-based user interface and alerts system.
- Open Hardware Monitor Open-source hardware monitor for Windows and Linux that can monitor temperature, fan speed, voltage, and more.
The Best PC Monitoring Software
Our methodology for selecting PC monitoring software
We reviewed the market for PC monitoring systems and analyzed the options based on the following criteria:
- A hardware monitor to check on physical device statuses
- Systems that will operate on board or across a network
- Monitors do device resource utilization
- Scanners to spot processor overload
- Options to monitor software performance and operating systems
- A free tool or a paid service that has a free trial period for assessment
- A paid tool that is worth the money or a free tool that is worth the time it takes to install
By taking into account these criteria and ensuring to include free options, we derived a number of useful PC monitors that we are happy to recommend.
1. SolarWinds Network Performance Monitor (FREE TRIAL)
Tested on: Windows Server
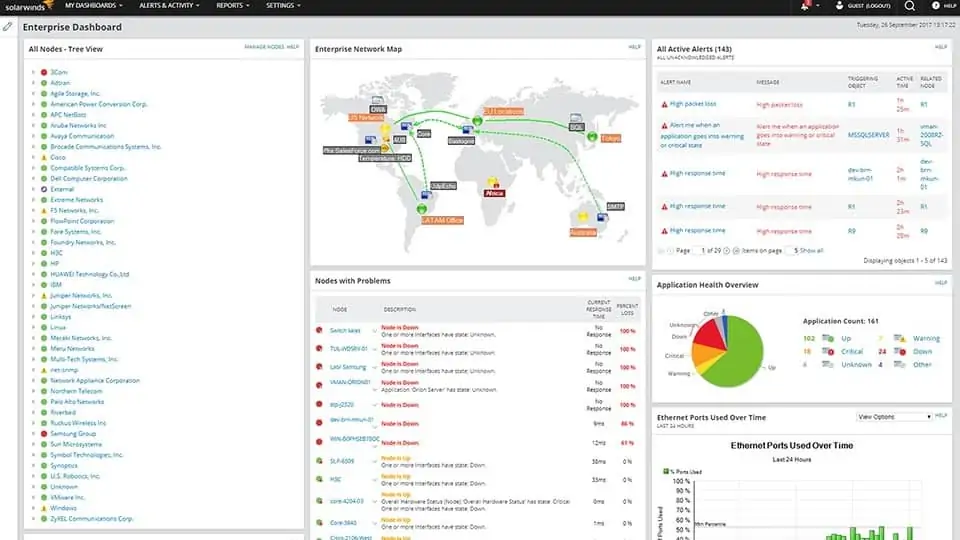
SolarWinds Network Performance Monitor (NPM), is a network monitoring tool that monitors the performance and availability of nodes throughout your network. The platform automatically discovers SNMP-enabled devices so that you can monitor them. Discovered devices can then be viewed as a map so you can see how your nodes connect to the network from a topological perspective.
Key Features:
- SNMP-Based Network Device Status Checks: Utilizes SNMP for monitoring network device status and performance.
- Constant Availability Monitoring: Provides constant availability monitoring of network devices to ensure optimal performance.
- Automatic Device Discovery: Features automatic device discovery, building network topology maps and inventory lists in real-time as devices enter the network.
- Alerts for System Errors: Generates alerts for system errors, enabling prompt identification and resolution of network issues.
- Network Capacity Management Controls: Offers network capacity management controls to monitor and manage network bandwidth and resources effectively.
Why do we recommend it?
SolarWinds Network Performance Monitor collects SNMP data from devices that are connected to the network. Windows has an SNMP agent built into it. So, if you activated that on all of your PCs, you can get hardware capacity and utilization data sent to the Network Performance Monitor console.
From the dashboard, you can monitor metrics such as CPU load, memory utilization, response time, and more. Performance data can be viewed through a range of visual elements including dials and graphs. The range of visualization options develops a clearer picture of what’s going on.
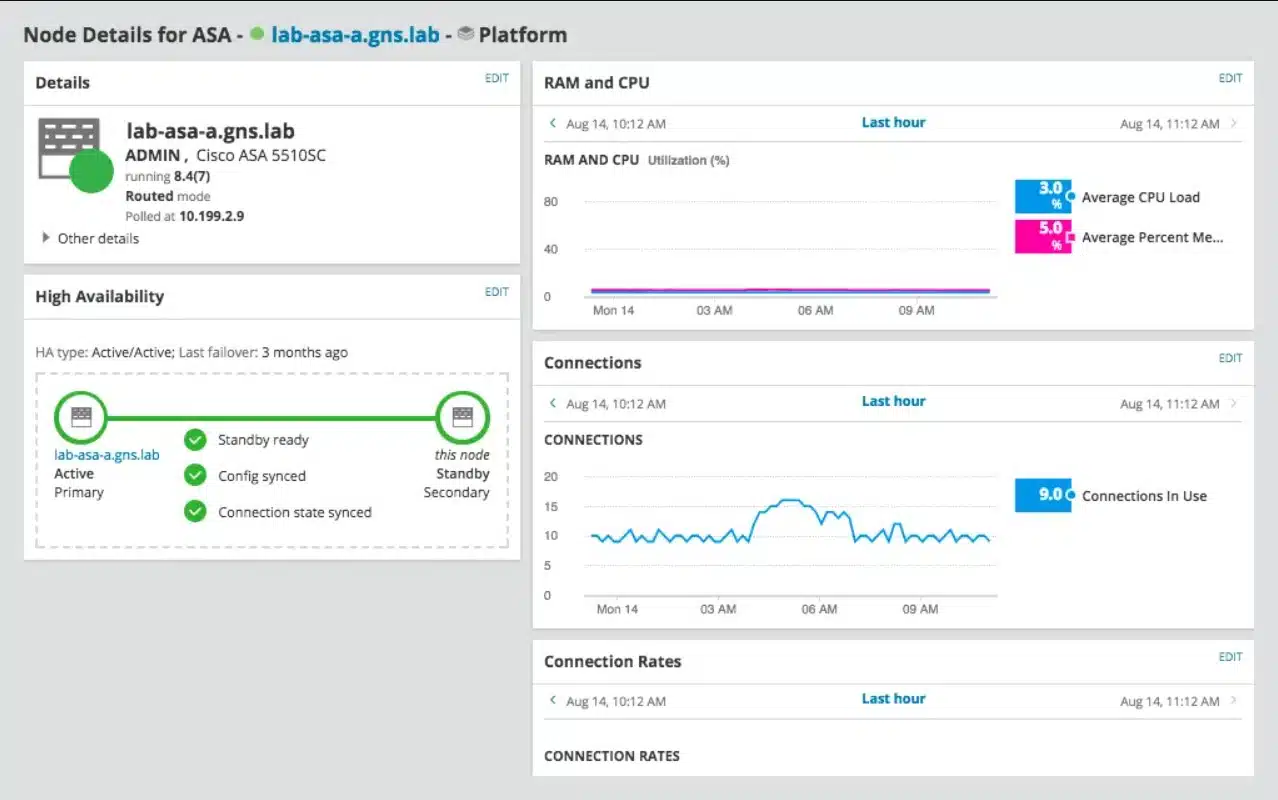
Email and SMS alerts notify you when performance conditions change. For example, if the CPU Utilization of a computer is too high then the program will tell you. These notifications also include additional information to help you kickstart the troubleshooting process. You can turn off non-critical alerts outside of working hours.
Who is it recommended for?
The SolarWinds system has a lot of capabilities beyond just checking on network devices. The ability to collect CPU, memory, and disk data from PCs with this tool is just one example of how the package can be expanded. This system is very large and probably more than small businesses would need.
Pros:
- Auto-Discovery with Real-Time Maps: Supports auto-discovery that dynamically builds network topology maps and inventory lists in real-time.
- Effective and User-Friendly Alerting Features: Boasts some of the best alerting features that balance effectiveness with ease of use, ensuring timely notifications for critical network events.
- Drag and Drop Widgets: Uses drag and drop widgets to customize the look and feel of the dashboard, allowing users to tailor the monitoring interface to their specific needs.
Cons:
- Feature-Rich Enterprise Tool: SolarWinds NPM is a feature-rich enterprise tool, and small LANs or operations may find it overwhelming due to the extensive functionality.
SolarWinds NPM is one of the top PC monitoring software tools on this list. It’s accessible to newbies and offers a complete hardware monitoring experience. The program starts at $2,995 (£2,268). You can download the 30-day free trial.
EDITOR'S CHOICE
SolarWinds Network Performance Monitor is our top pick for a PC monitoring software package because it is able to track the performance of all devices connected to a network, not just PCs. That means this tool gives real value for money because it is able to offer a network-wide monitoring service that includes a system hardware inventory that is constantly updated and it will also generate a network topology map. Watch over availability and response times with this system to ensure that your users always get the best service possible from the network.
Download: Download a 30-day free trial
Official Site: https://www.solarwinds.com/network-performance-monitor/registration
OS: Windows Server
2. SuperOps RMM (FREE TRIAL)
SuperOps RMM is a remote monitoring and management package. SuperOps also offers a professional services automation (PSA) software system, which makes this platform suitable for use by managed service providers (MSPs). The system is able to monitor endpoints running Windows or macOS.
Key Features:
- Device Discovery: Provides device discovery capabilities, enabling the identification and inclusion of devices within the network.
- Automated Monitoring: Implements automated monitoring of devices, allowing for continuous tracking of their performance and health.
- Alerts for System Problems: Generates alerts for system problems, ensuring timely notifications for critical issues within the monitored environment.
Why do we recommend it?
SuperOps RMM is an automated system that reduces the amount of time that technicians need to devote to supervising the hardware on a site, including its PCs. The tool can track systems on multiple sites simultaneously, which keeps the data for each location separate in subaccounts.
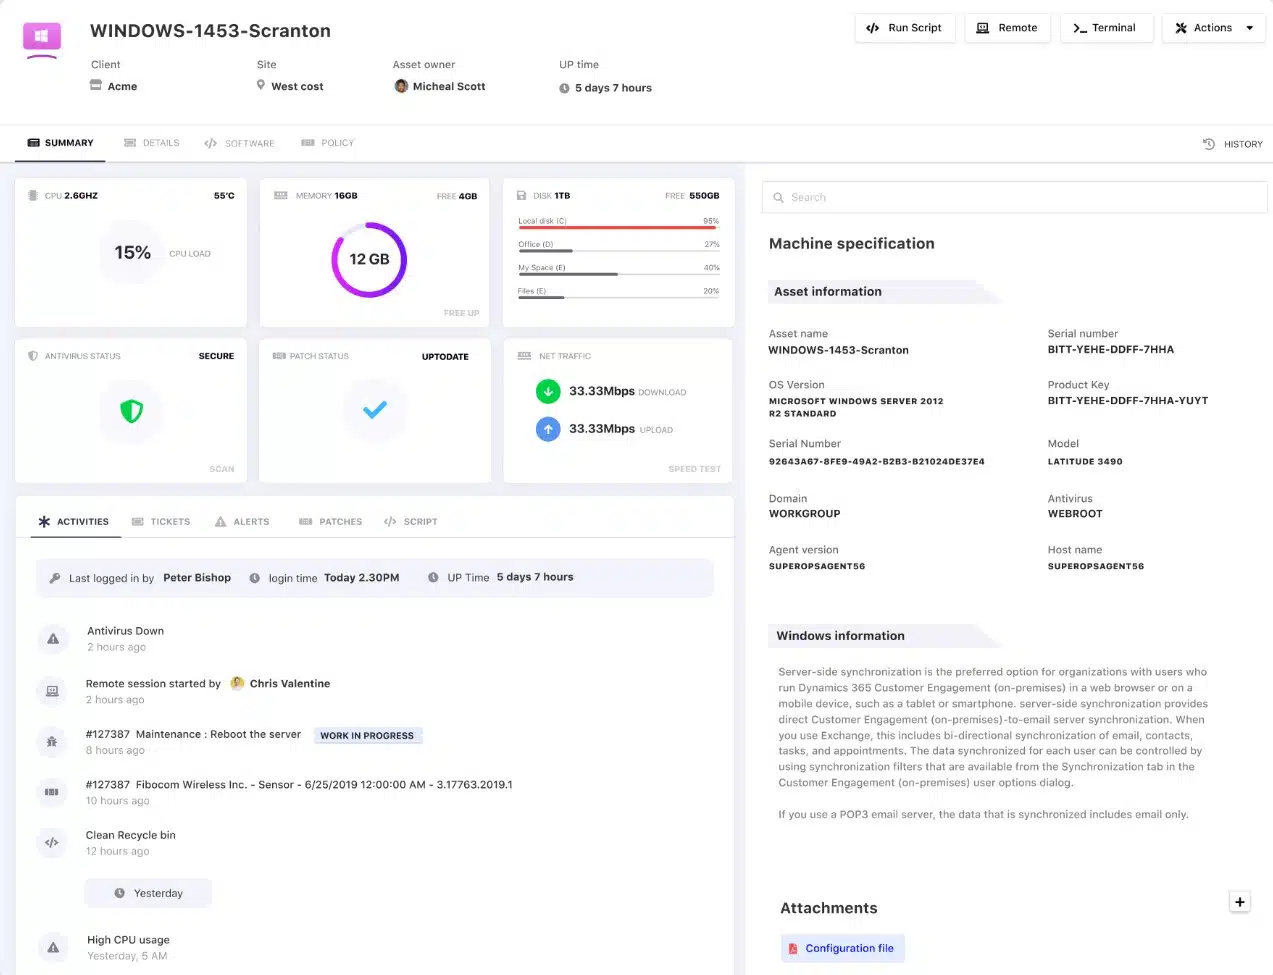
The SuperOps system installs an agent on a site that is to be monitored. This program scans the network and passes all of the information it discovers up to the SuperOps server. The RMM assembles this data into an asset inventory. The details of each device, including PCs, record hardware capacities.
The agent repeats its network scan continuously and each round results in data on the current status of each device. This is uploaded to the SuperOps server where it is displayed as live monitoring information. If a status approaches the full capacity of each device component, the SuperOps system raises an alert.
Examples of the type of event that could trip an alert are CPU full capacity being approached, disk space running short, or memory capacity being heavily used.
Who is it recommended for?
An RMM can be used by IT departments as well as managed service providers. Some SuperOps packages include PSA systems and these would only be of interest to MSPs because the PSA package includes services that are not needed by IT departments, such as contract management.
Pros:
- Monitors PCs and Macs: Supports the monitoring of both PCs and Macs, providing versatility in device compatibility.
- Automated Problem Alerting: Offers automated problem alerting, ensuring that system issues are promptly brought to the attention of administrators.
Cons:
- Doesn’t Monitor Devices Running Linux: Does not support the monitoring of devices running the Linux OS, potentially limiting its applicability in environments where Linux devices are prevalent.
SuperOps offers four plans. These are Standard (PSA Only), Standard (RMM Only), Pro (Unified Basic), and Super (Unified Advanced). These are subscription packages that are priced per technician per month. You can examine the SuperOps platform with a 21-day free trial.
3. ManageEngine Endpoint Central (FREE TRIAL)
ManageEngine Endpoint Central is an endpoint management system that watches over Windows PCs and also endpoints running macOS and Linux. It can also manage mobile devices running iOS or Android. Monitoring services in this package include a security monitoring system and software version tracking. The service also logs device warranties.
Key Features:
- Warranty Tracking: Tracks warranty information for devices, providing visibility into the status of warranties for timely renewals or replacements.
- Software Inventory: Manages software inventory on endpoints, allowing administrators to monitor installed applications and ensure compliance.
- Desktop and Mobile Management: Offers management capabilities for both desktop and mobile devices, providing a unified solution for diverse endpoint environments.
- Security Monitoring: Includes security monitoring features to detect and respond to potential security threats on managed endpoints.
Why do we recommend it?
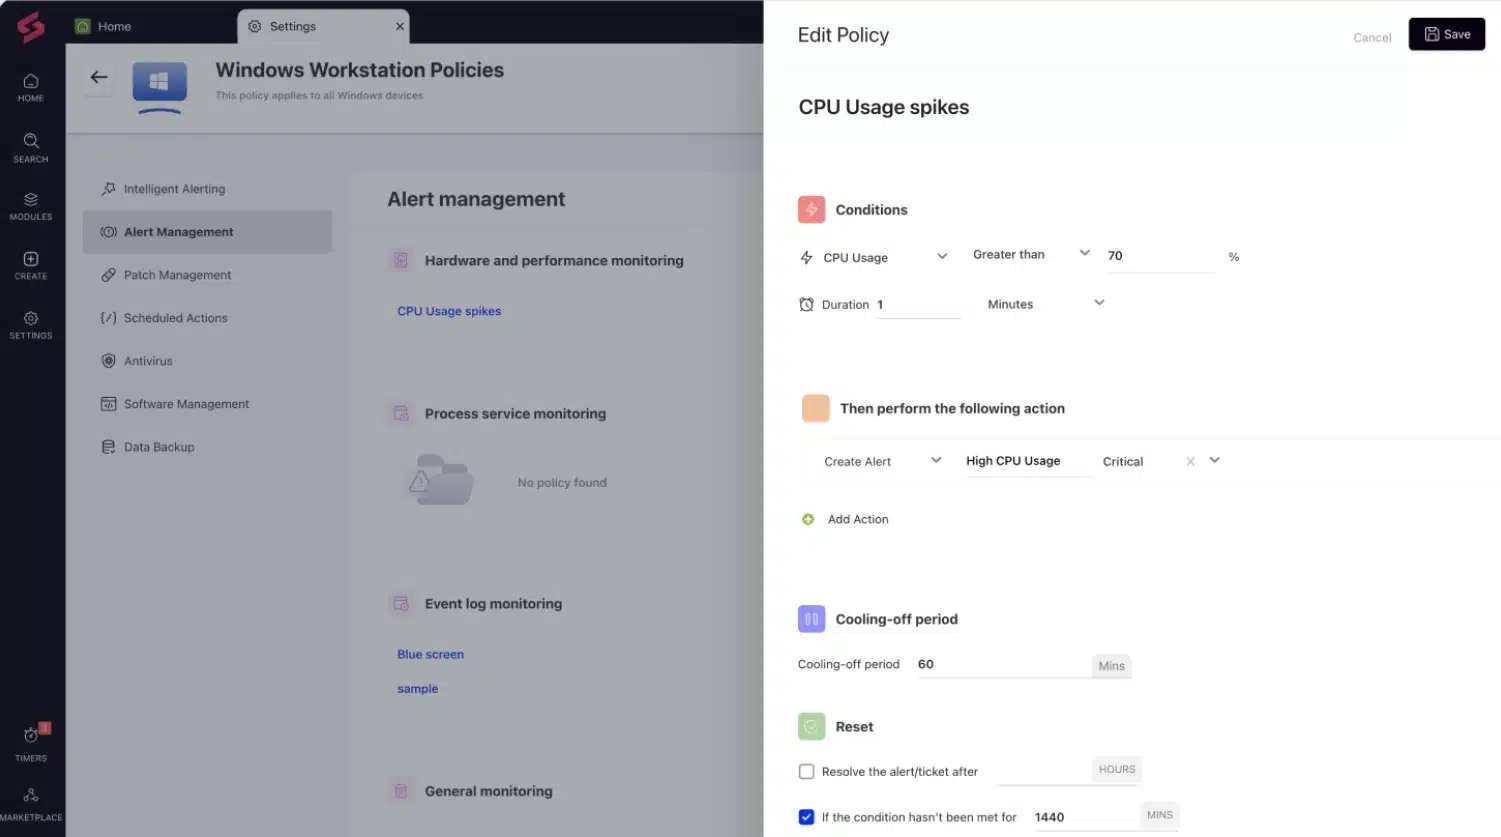
ManageEngine Endpoint Central is a monitoring package to watch over servers and workstations. This includes Windows PCs. The tool includes a series of performance and capacity utilization thresholds that will trigger alerts if they are crossed. The tool automates the monitoring of endpoints and enhances the productivity of IT department technicians.
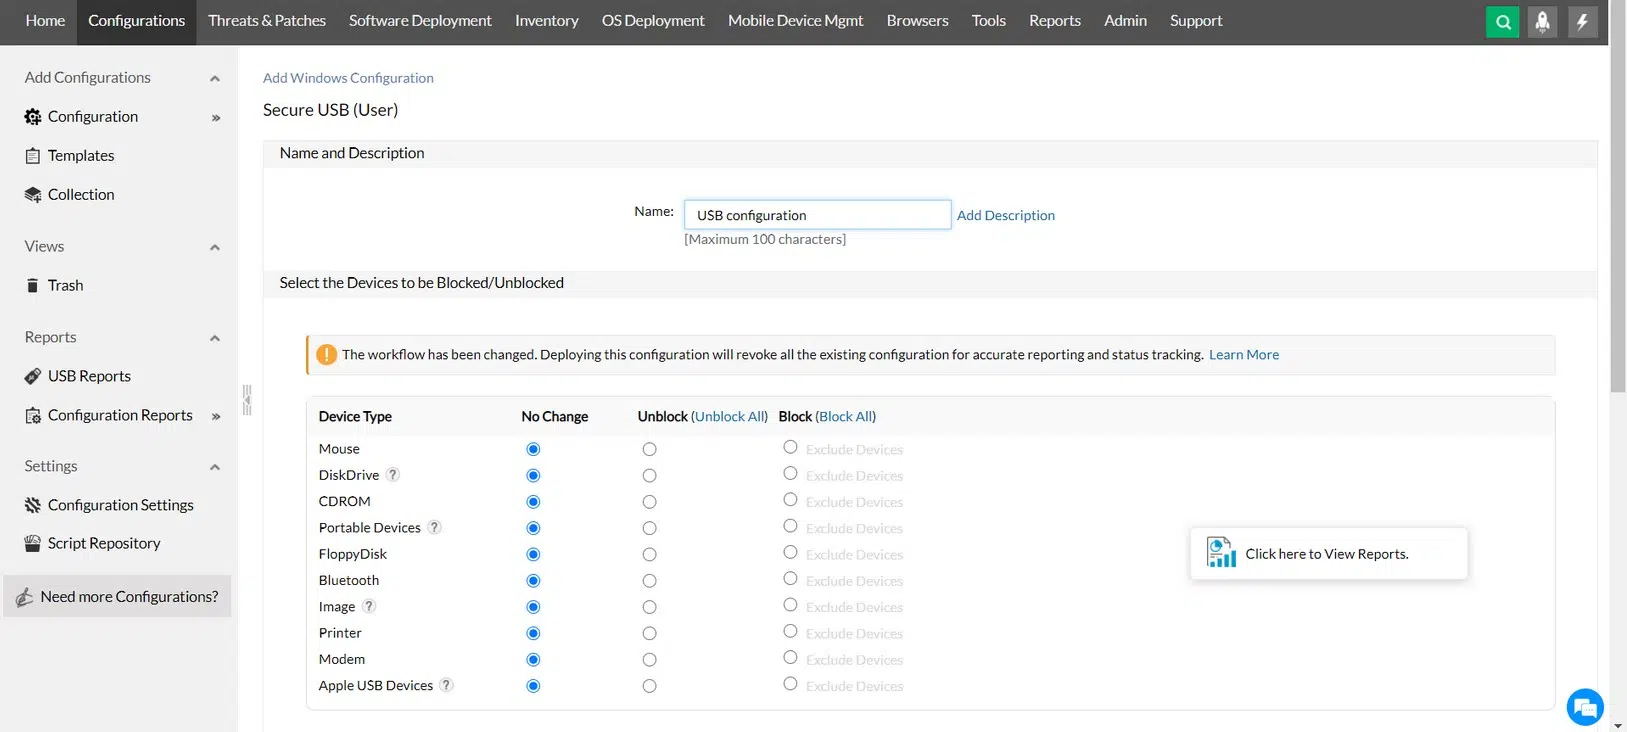
This package is very big on endpoint management functions, such as automated onboarding, configuration control, software control, and patch management. The main monitoring system in the bundle is a security system. This isn’t a core module but is offered as an add-on for all editions. The main features of this service work on software controls. It locks down configuration and blocks unauthorized applications from being installed. There is also a vulnerability scanner that links through to the patch manager.
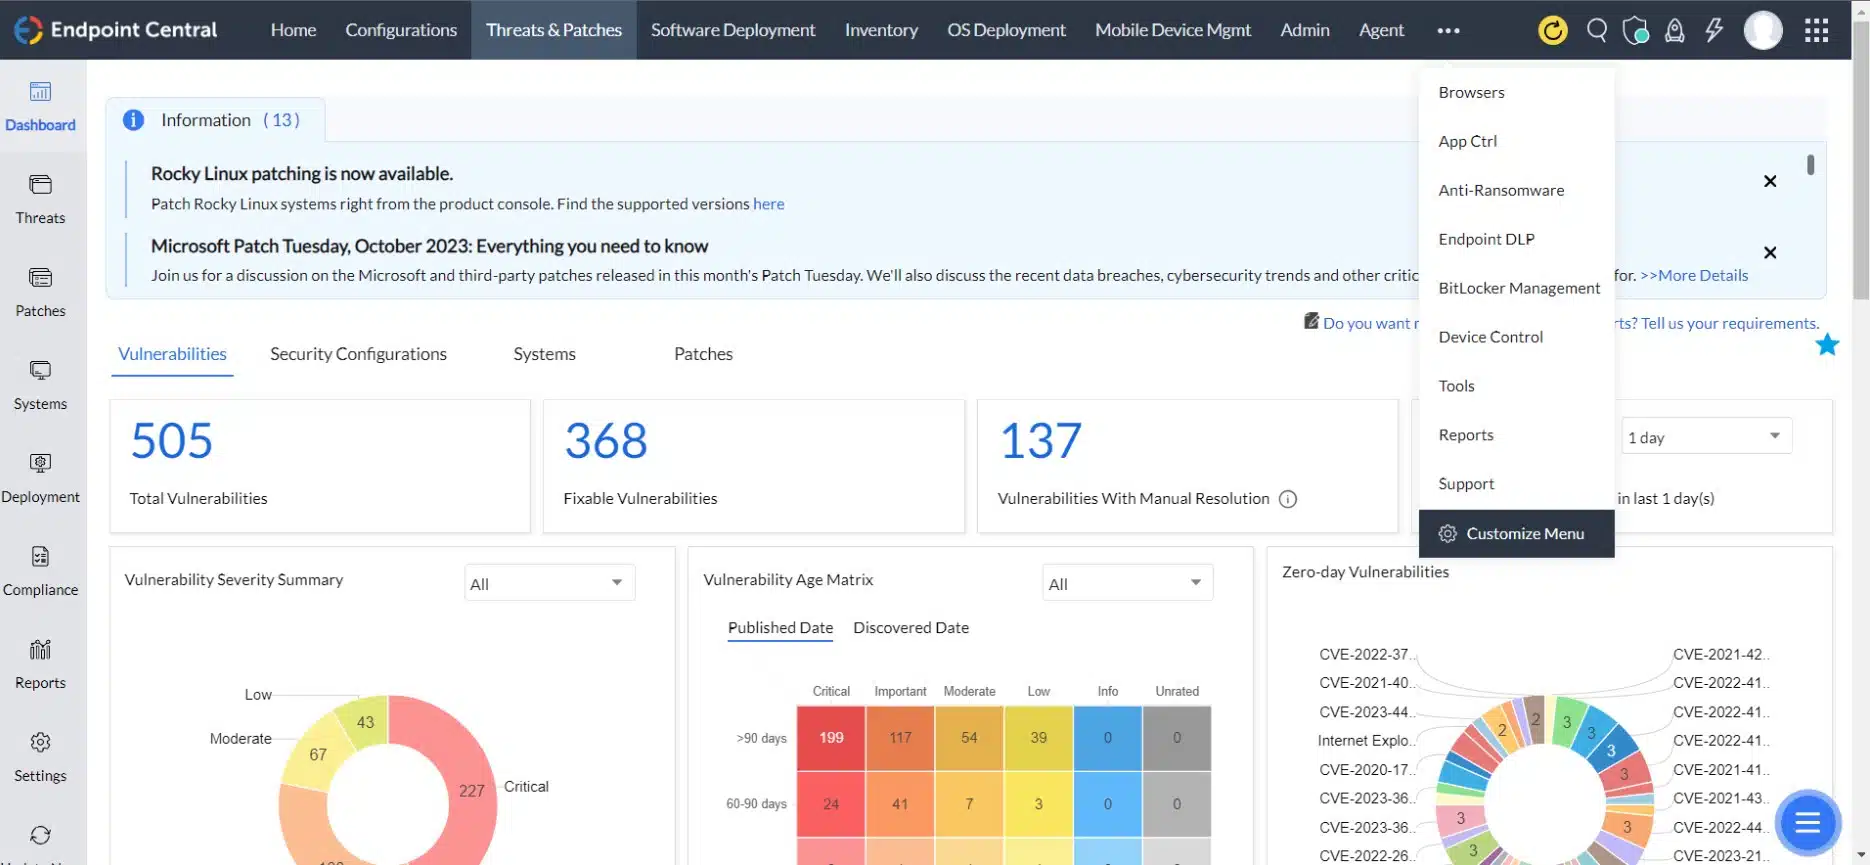
Other services in the endpoint security monitoring module include Web browser security and removable device controls. This is a partial DLP system that also provides file access logging for data privacy audits. A function in the package containerizes sensitive data so that it can only be accessed by trusted applications. This demands that application access is then tightly controlled through access management.
Who is it recommended for?
ManageEngine provides a Free edition of Endpoint Central that is able to manage 25 endpoints. This is a generous allowance and will be sufficient for many small businesses. The paid editions included the top plan that enables the management of mobile devices. There is also a version available for managed service providers (MSPs).
Pros:
- Attachable Device Controls: Provides attachable device controls, allowing administrators to manage and control peripheral devices connected to endpoints.
- Activity Logging: Maintains activity logs for endpoints, offering a historical record of user actions and system events for auditing and troubleshooting purposes.
Cons:
- No PC Performance Monitoring Module: Absence of a dedicated PC performance monitoring module, which may be a drawback for organizations seeking comprehensive performance monitoring capabilities for their endpoints.
ManageEngine Endpoint Central is available in four editions, including a free version that manages up to 25 endpoints. The top two editions offer WAN management capabilities. You can access the service in the cloud as a SaaS package or download the software onto Windows Server. Assess the Endpoint Central package with a 14-day free trial.
4. Site24x7 Server Monitoring (FREE TRIAL)
Site24x7 Server Monitoring could more accurately be called a host monitoring system because it will track the activities of all endpoints, including PCs. This system is provided in plans that also have network and application monitoring modules. These units fit together to implement full-stack observability.
Key Features:
- PC Resource Monitoring: Monitors key PC resources to provide insights into performance, usage, and availability.
- Hardware Statuses: Tracks the status and health of hardware components to identify potential issues or failures.
- Application Monitoring: Monitors the performance and availability of applications running on servers, ensuring optimal functionality.
Why do we recommend it?
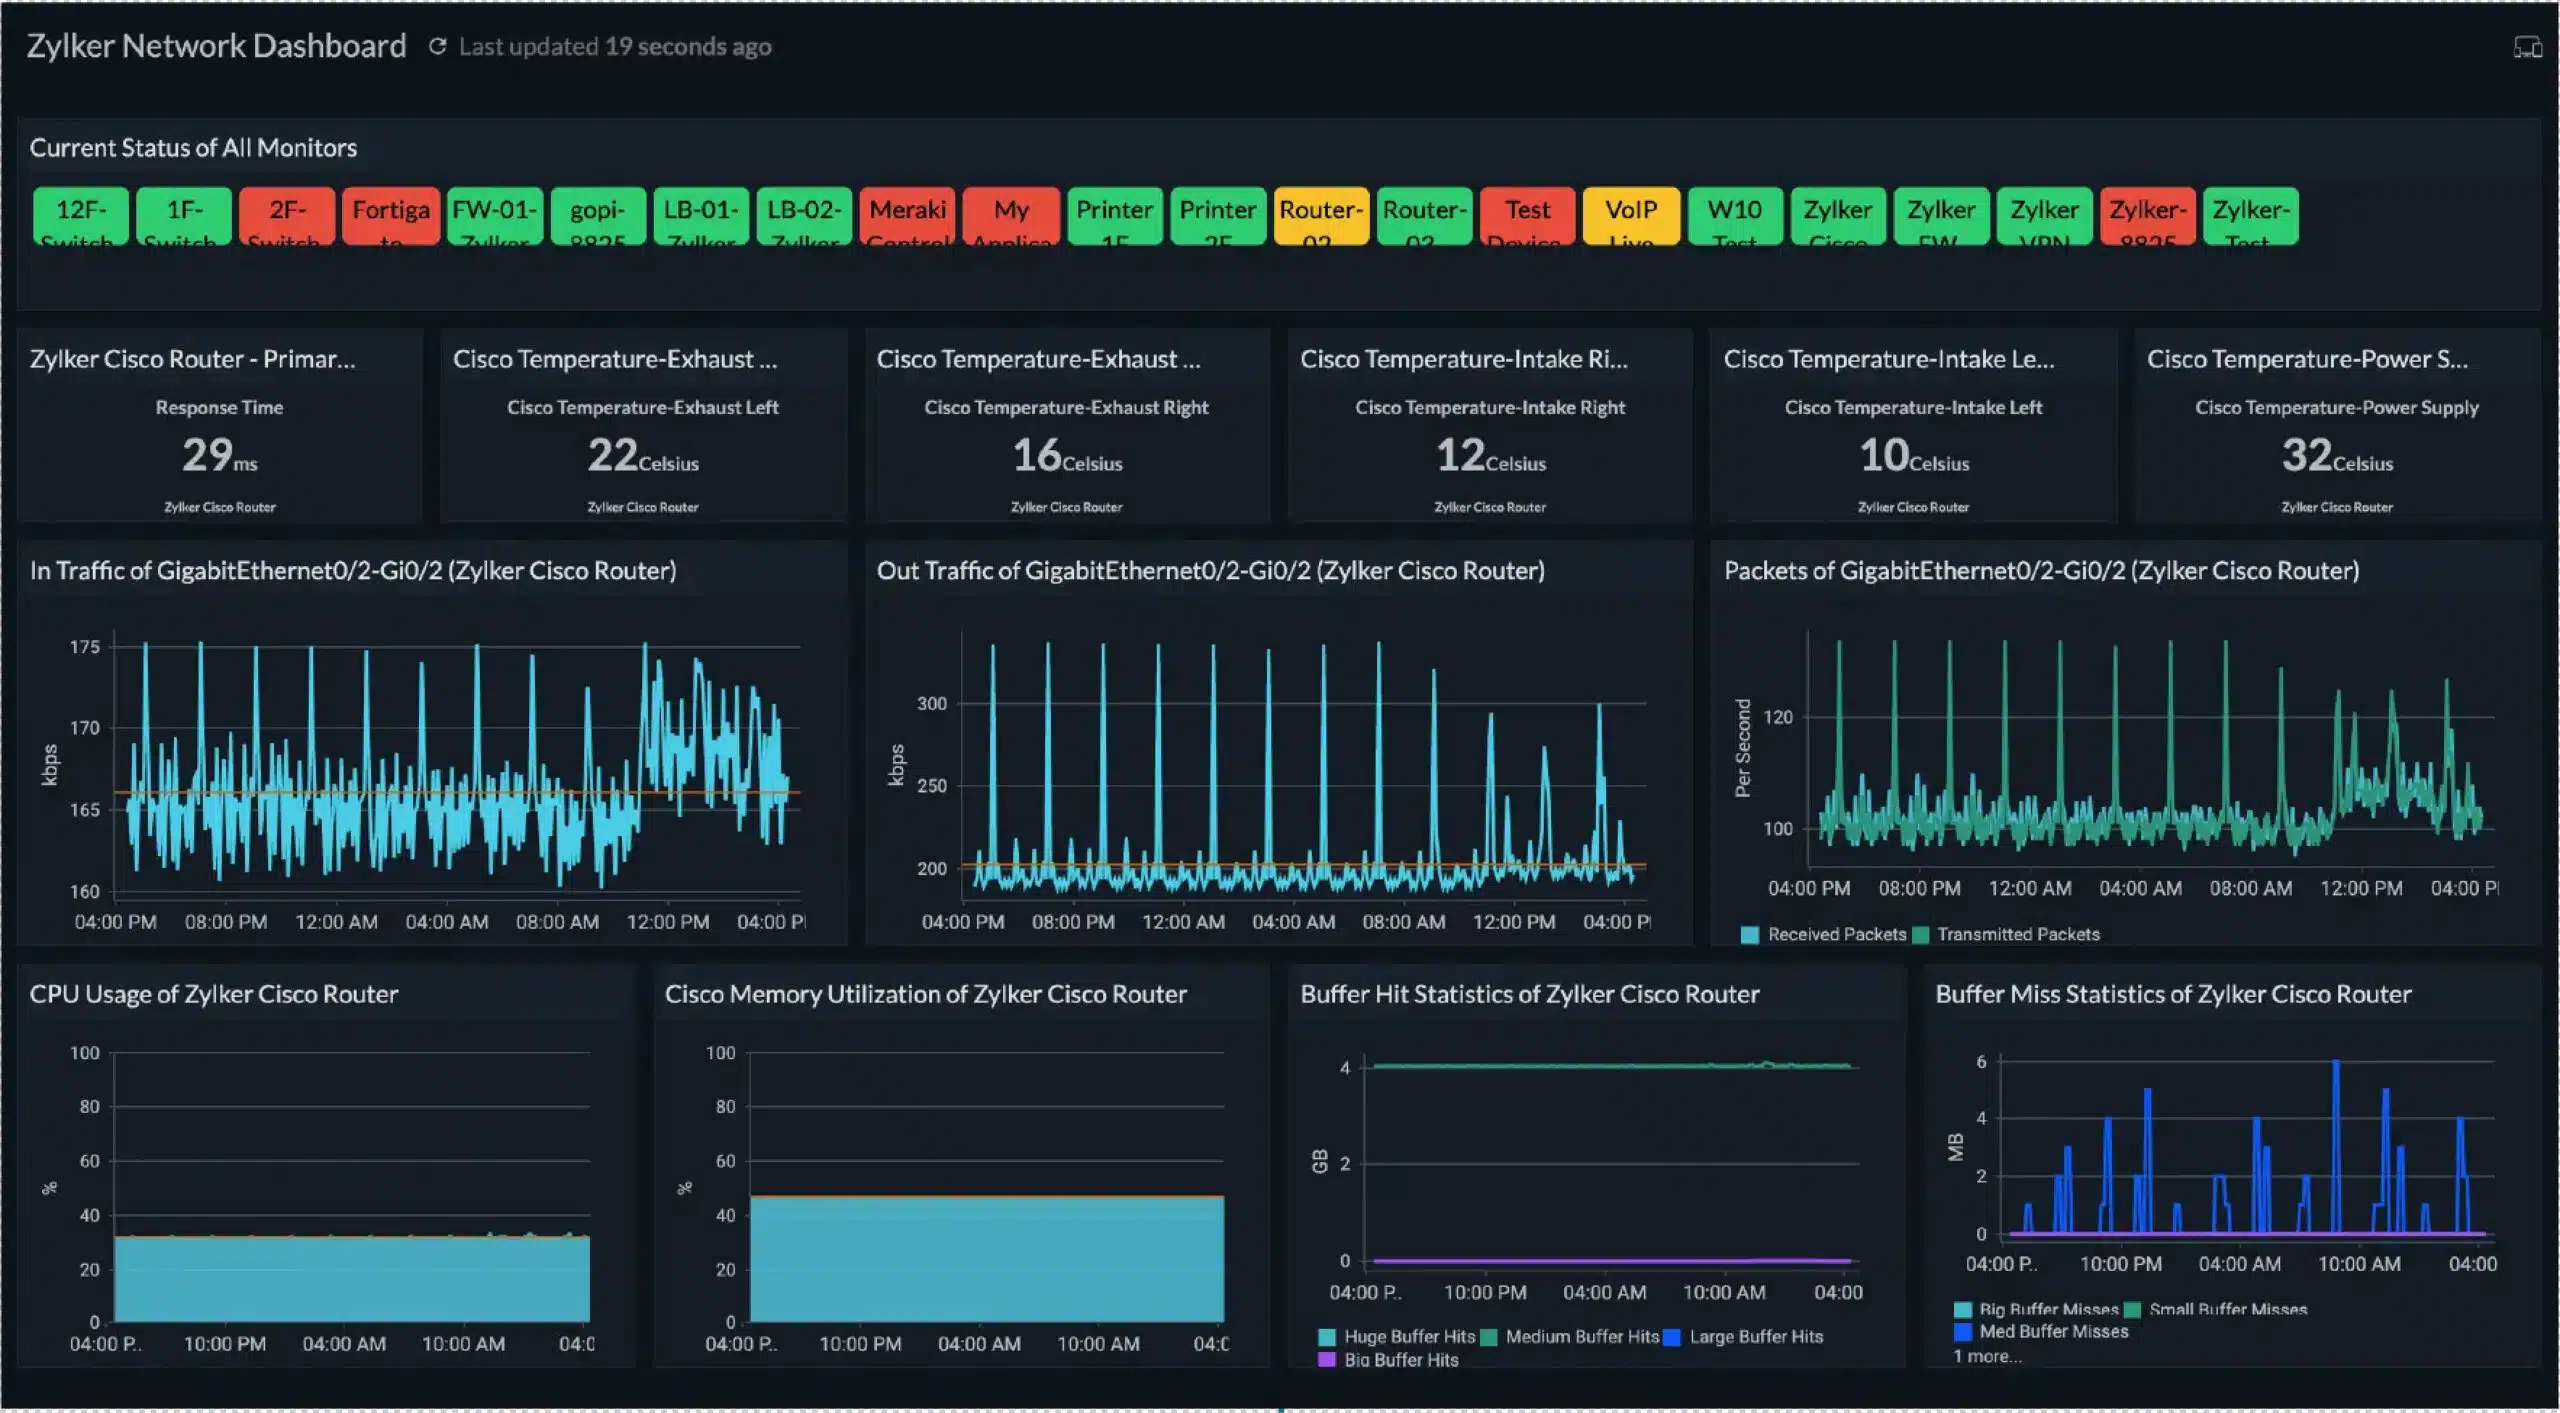
The Site24x7 Server Monitoring package implements resource tracking, noting the full capacity of each resource, such as CPU, memory, and disk space. The tool records the utilization of these resources with live tracking and will raise an alert if one of them approaches full capacity. The service will monitor servers as well as PCs and it can also monitor cloud platforms.
The dashboard for the Site24x7 shows an overview of performance for all endpoints and also offers a drill-down function to examine each PC or server. The console is based in the cloud and can be accessed through any standard browser. The data processing unit of the Site24x7 system is also a cloud-based unit and it gathers local data through an on-site agent.
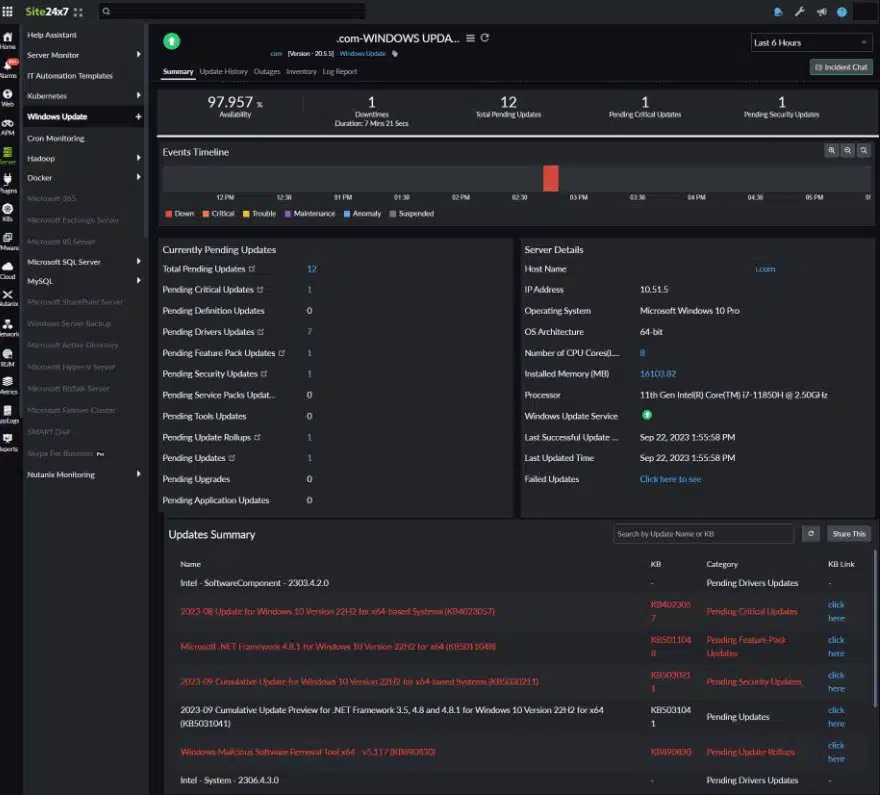
The Server Monitoring package includes a series of performance expectation thresholds that will trigger an alert if they are crossed. These can be customized and added to. Alerts appear in the Server Monitoring dashboard but they can also be forwarded to a technician through email, SMS, voice mail, or Slack message.
Who is it recommended for?
The Site24x7 Server Monitoring service is part of a cloud-based SaaS platform that is marketed to businesses in plans. Each plan includes monitoring systems for networks, applications, cloud platforms, virtual systems, and services as well, so any company that has both on site and cloud resources could use this tool. Plans are suitable for both small and large businesses and there is an MSP edition for managed service providers.
Pros:
- Utilization Tracking for Important PC Resources: Provides utilization tracking for crucial PC resources, allowing administrators to understand resource usage patterns.
- Alerts for Activity Approaching Capacity Limits: Generates alerts to notify administrators of approaching capacity limits, enabling proactive actions to prevent performance degradation or downtime.
Cons:
- Not Available as a Standalone Purchase: Not available as a standalone purchase, which may be a limitation for organizations seeking specific server monitoring without additional bundled services.
There are many plans available on the Site24x7 platform and all of them include the Server Monitoring unit. You can assess any Site24x7 plan with a 30-day free trial.
5. Paessler PRTG Network Monitor (FREE TRIAL)
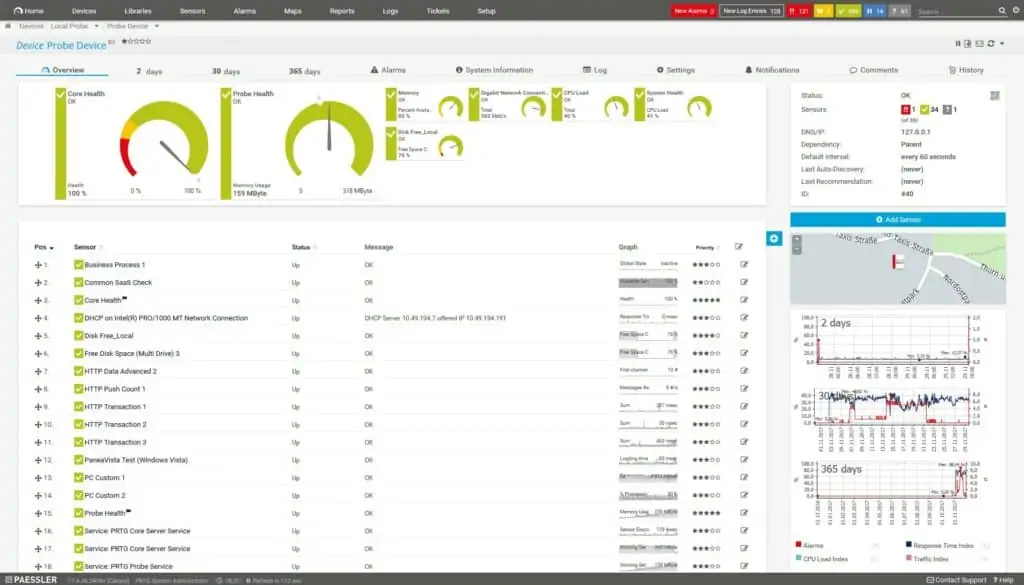
Paessler PRTG Network Monitor is a network monitoring platform that displays information from your computers including CPU utilization, temperature, memory usage, and bandwidth in real-time. The user can monitor Windows, Linux, and Mac computers through the dashboard and view performance data in the form of sensors.
Key Features:
- Customizable Package: PRTG offers a customizable package, allowing users to tailor the monitoring solution to their specific needs.
- Monitors Networks, Servers, and Applications: Provides comprehensive monitoring capabilities for networks, servers, and applications to ensure optimal performance.
- System Problem Alerts: Includes system problem alerts to notify administrators of issues that may impact network or server performance.
- Automatic Network Device Discovery: Features automatic network device discovery, simplifying the setup process and ensuring that all relevant devices are monitored.
Why do we recommend it?
Paessler PRTG Network Monitor is a bundle of monitoring tools that each buyer customizes by choosing which sensors to turn on. There are sensors for checking on CPU, memory, disk usage, CPU temperature, and I/O activity. These metrics all have thresholds placed on them that will trigger alerts when problems arise.
Sensors show you performance data for specific metrics with dials that highlight live and historical performance data. For example, if you want to monitor the CPU of SNMP- enabled computers you could use the SNMP CPU Load Sensor. The SNMP CPU Load Sensor displays the load of multiple CPUs on a table.
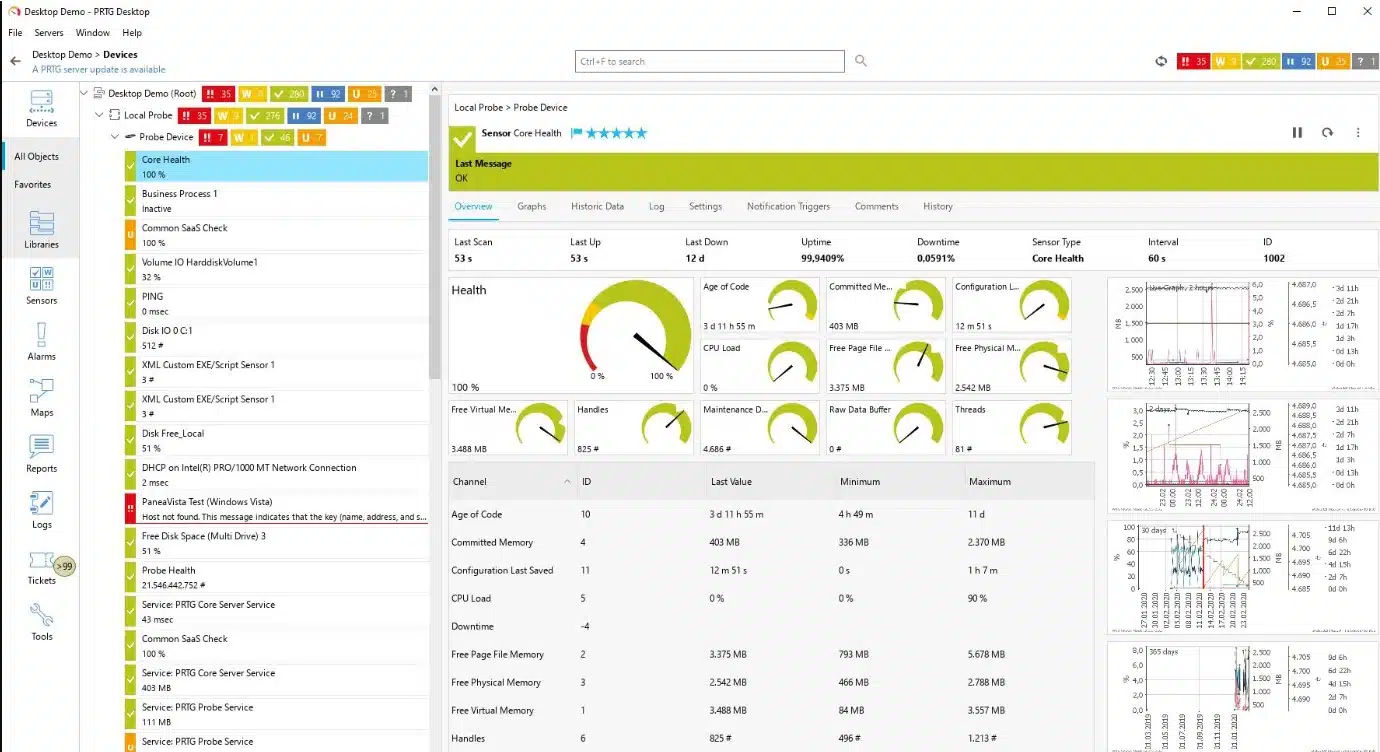
Sensors can also be configured with alerts. For instance, you can set an alert to receive a notification if CPU usage matches certain trigger conditions. The program will then send you an alert via email, SMS, slack message, push notification, SNMP trap and more.
Who is it recommended for?
You tailor PRTG to your needs and ignore those features that you don’t want – you won’t have to pay for them. There is a free version that gives you 100 sensors and you can turn on any that you want up to that number. PRTG is offered as software for Windows Server or a SaaS platform.
Pros:
- Intuitive Dashboard with Widgets: The dashboard is customizable through a series of widgets, providing an intuitive and user-friendly interface right out of the box.
- Supports Free Version for Small Networks: PRTG supports a completely free version for up to 100 sensors, making it suitable for both small and large networks.
- Flexible Pricing: Pricing is based on sensor utilization, offering flexibility and scalability for larger networks, as well as budget-conscious organizations.
Cons:
- Learning Curve: Requires time to fully learn and explore all the features and options available. The wealth of functionality may be overwhelming for users new to the platform.
PRTG Network Monitor is ideal for organizations looking for a premium hardware monitoring solution with competitive scalable pricing options. It’s available for free for less than 100 sensors. Paid versions start at $1,600 (£1,211). You can download the 30-day free trial.
Related: Best CPU Temp Monitors
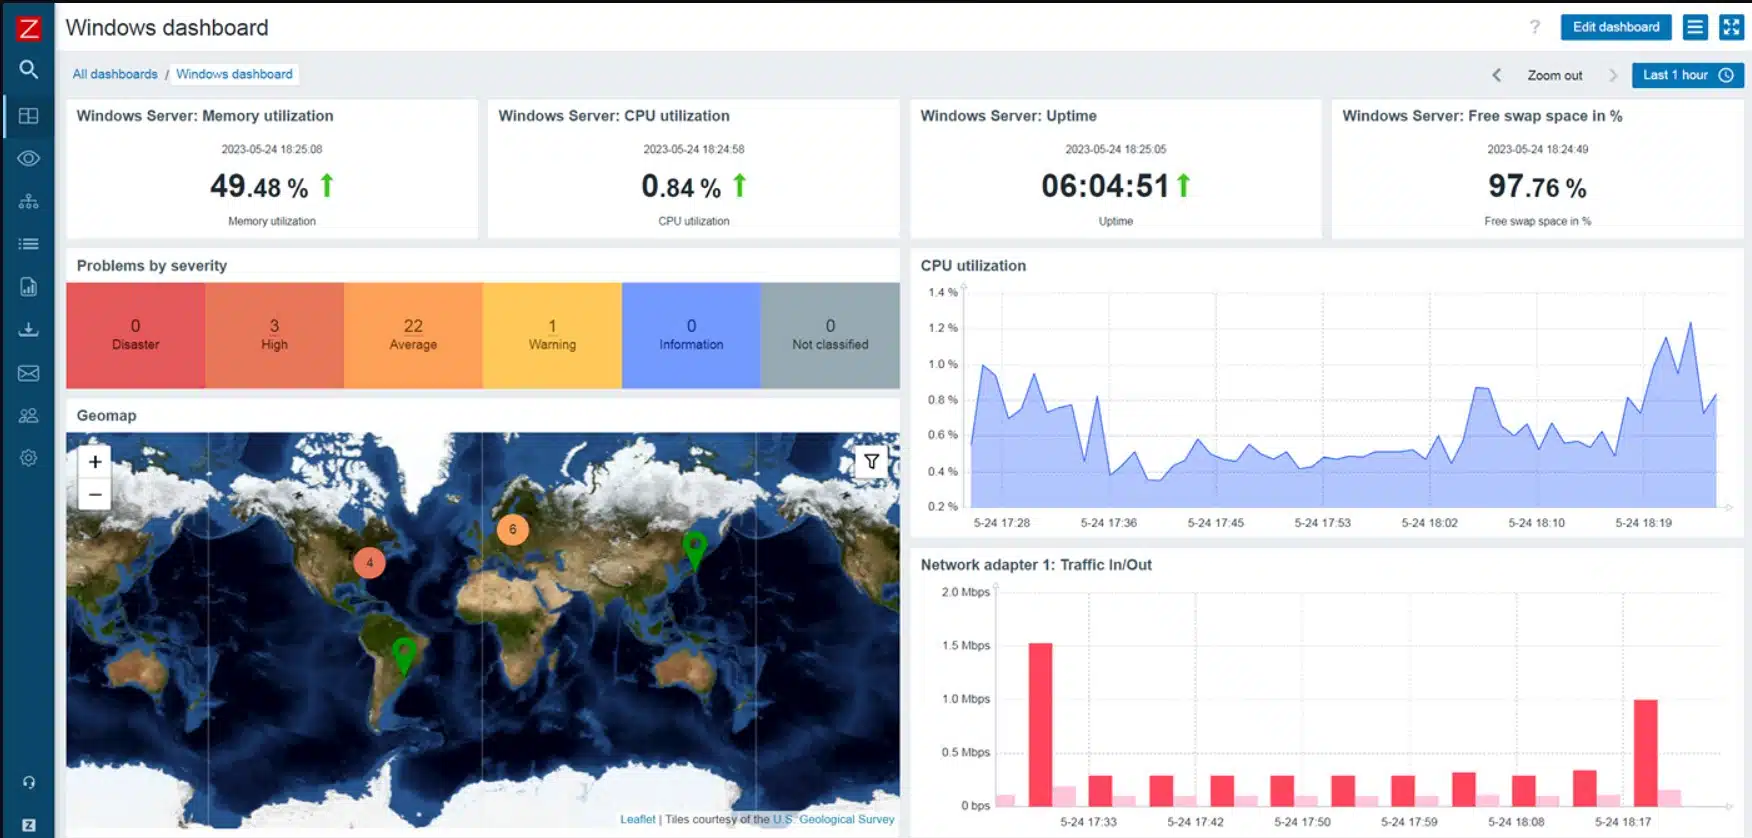
6. Zabbix
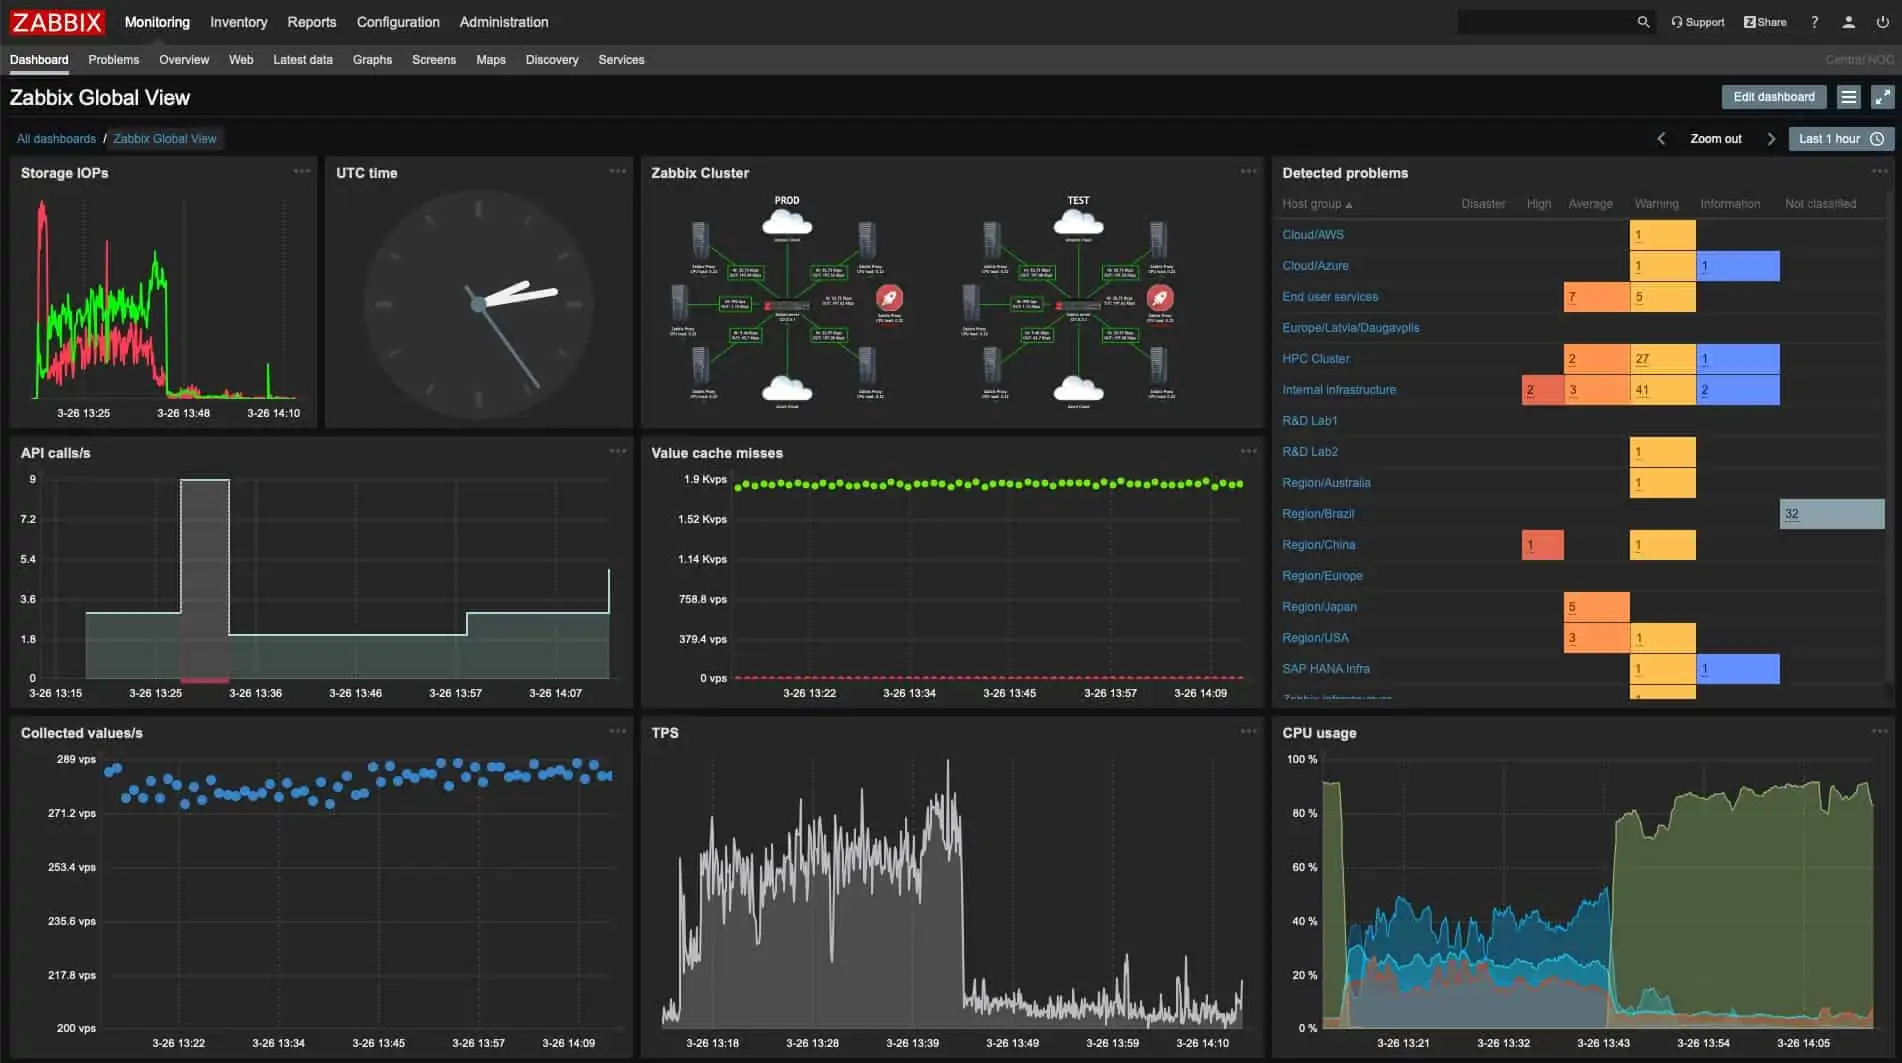
Zabbix is an open-source infrastructure monitor that can monitor a range of performance and health metrics. Zabbix shows the user device status, temperature, CPU, memory utilization, fan state, power supply, and more. Getting starting monitoring with the program is also very easy due to the autodiscovery feature, which automatically discovers devices throughout your network.
Key Features:
- Monitors Networks and Servers: Provides comprehensive monitoring capabilities for networks and servers to ensure optimal performance.
- Watches Server Hardware Statuses: Monitors server hardware statuses, enabling administrators to track the health and conditions of server components.
Why do we recommend it?
Zabbix is a free package and it can be expanded by templates, which means plug-ins. The tool discovers all devices connected to the network and starts monitoring processes. The monitor gathers CPU, memory, and disk capacity and utilization data for each network device and endpoint.
Similarly, device templates allow you to configure the platform to monitor devices more efficiently. There are templates for a range of high-profile vendors including Cisco, Intel, Netgear, Dell, Hewlett Packard Enterprise, and more. There are also plugins available from the Zabbix Share site with additional templates
Email, SMS, Jabber, eZ texting, and custom alert scripts allow you to receive notifications when performance conditions change. Alerts are customizable so that you can enter information such as Date and time, Hostname, Item value, Trigger value, Host profile, User macros, Escalation history, and more. Custom alert messages give you the information you need to be able to follow up effectively.
Who is it recommended for?
Zabbix is a software package for Linux. You can also install it on the AWS, Azure, Digital Ocean, GCP, and Red Hat OpenShift cloud platforms. The system will also run on Dicker. As a free tool, this is an easy choice for small businesses. Many large organizations successfully use Zabbix as well.
Pros:
- Open-Source Tool: Zabbix is an open-source and transparent tool, allowing users to access and modify the source code. This transparency fosters community collaboration and customization.
- Useful Templates for Quick Insights: Offers a variety of templates that can be easily applied for quick insights into common monitoring scenarios, streamlining the configuration process.
Cons:
- Lacks Modern Interface: Some users express the desire for an updated and modernized user interface and overall user experience to match contemporary design standards.
Zabbix is one of the top open-source tools on this list and is highly recommended for users that want a PC monitor that’s easy to configure and customize. Zabbix is available for Red Hat Enterprise Linux, CentOS, Oracle Linux, Ubuntu, Debian, SUSE Linux Enterprise Server, Raspbian, and more. You can download the tool for free.
See also: Best Hardware Monitoring Tools
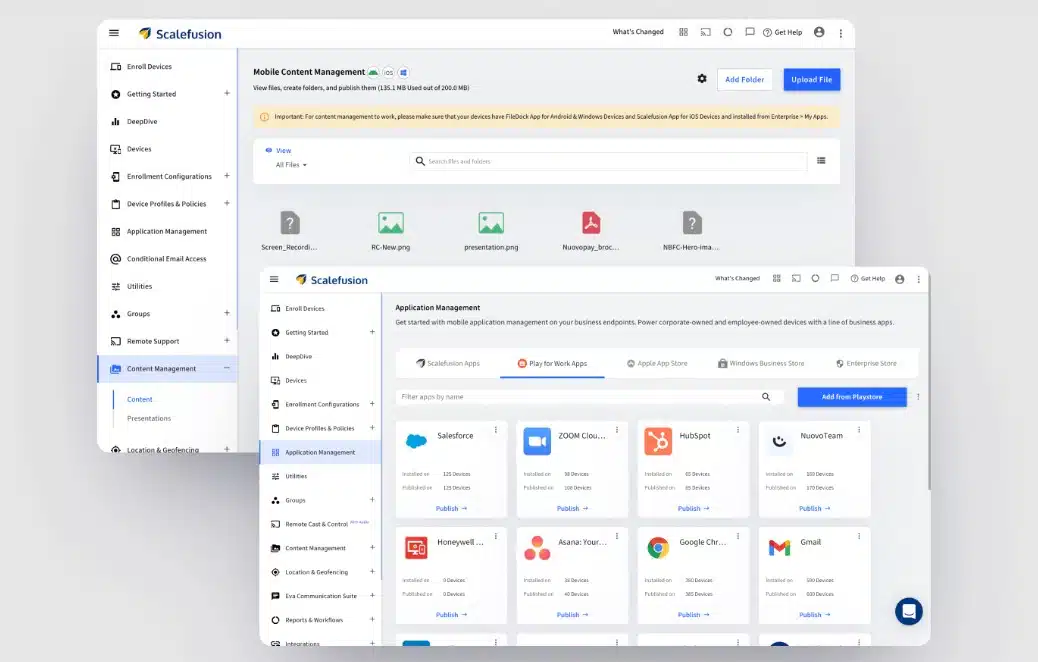
7. Scalefusion
Tested on: Cloud environment
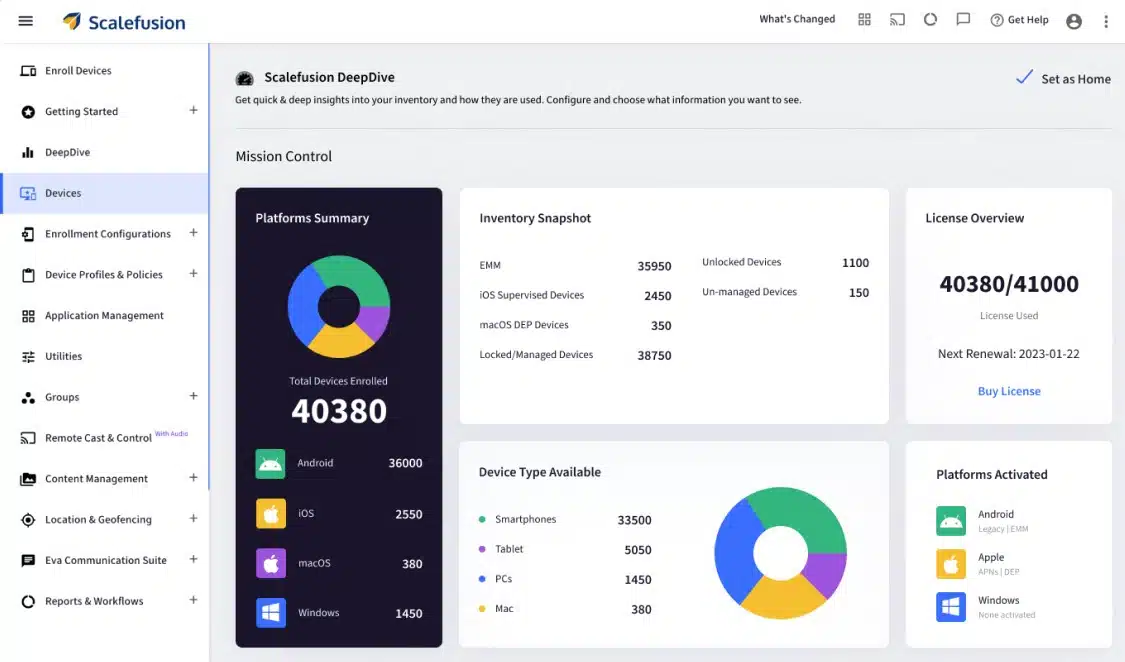
Scalefusion is a cloud-based UEM that can manage devices irrespective of their location, making it useful for distributed teams or multi-site businesses. The software includes PC management. It offers management of all mobile devices running macOS, Linux, iOS, Windows, and Android.
Key Features:
- Web-Based Dashboard: Offers a web-based dashboard for centralized and user-friendly device management.
- Geo-Fencing and Location-Tracking: Provides geo-fencing and location-tracking features, allowing administrators to monitor device locations.
- Remote Access for Maintenance and Troubleshooting: Enables remote access for maintenance and troubleshooting, facilitating efficient device management.
- Email Security with CEA: Includes email security features with Content Encryption and Authentication (CEA) to enhance email security.
Why do we recommend it?
Scalefusion can manage PCs and also desktops running Windows, macOS, and Linux. The PCs enrolled in Scalefusion can include corporate-owned computers or employee-owned computers (for work-from-home employees).
The cloud-based solution includes a Private Enterprise App Store that can serve all types of endpoints. With Scalefusion, you can set up an OS-based device profile to onboard a device. The enrollment process can be implemented by IT admins and rolled out in bulk or leverage user-based enrollment options (like email, QR code, etc.). This is a particularly useful option for devices that are in the homes of remote workers.
Apart from remote management features like OS and app patching and troubleshooting, Scalefusion offers many device management features that fortify the security of data stored on devices. Some of them include device encryption, pass-code policies, and app and content filtering. In addition, the ability to remotely lock a device and wipe its data becomes extremely useful when a device is lost or stolen.
Scalefusion is based in the cloud and it enables PCs anywhere to be enrolled in the same monitoring and management account. This software is a Unified Endpoint Management (UEM) solution, so you get automated monitoring and management services for all desktop and server operating systems – Windows, Linux, and macOS. The service will also monitor laptops, mobile devices, and IoT equipment all from the same dashboard. Scalefusion is particularly strong at PC management, enabling the enforcement of security rules for such applications as email to be enforced on all PCs and other endpoints. A company that has a distributed workforce that works from home or on client sites would benefit the most from this package.
Who is it recommended for?
Scalefusion is an ideal choice for businesses of all sizes with distributed and remote teams. The cloud-based solution can manage desktops, laptops, or mobile devices, no matter where they are. This makes it particularly useful for companies that operate a virtual office with many consultants out in the field or independent contributors.
Pros:
- Subscription Rate Per Device: Utilizes a subscription model with rates based on the number of devices being managed.
- Multi-Platform Support: Offers support for a variety of operating systems, including Windows, macOS, Linux, iOS, and Android, making it versatile for diverse device environments.
- Great for Managing Work-from-Home PCs: Particularly suitable for managing PCs used in work-from-home setups, ensuring secure and efficient device management.
- Suitable for Managing Multi-Site Businesses and Retail Outlets: Well-suited for managing multi-site businesses and retail outlets, providing centralized control and monitoring.
Cons:
- More Features for Managing Mobile Devices Than PCs: Some users note that the platform seems to offer more features for managing mobile devices compared to PCs, potentially making it less balanced for organizations with a heavier reliance on PCs.
All of the four editions of Scalefusion are priced per device, and all include Windows PC management. The basic price plan includes desktop management options. However, you need to go up to the top two plans to get patching for Windows. You can assess most of the Scalefusion features with a 14-day free trial.
8. HWMonitor
HW Monitor is a hardware monitoring tool for Windows that monitors the voltage, temperate, and fan speed of PCs. It can monitor PCs with sensor chips including the ITE IT87 Series, Winbond ICs, and more. The standard version is available for free, and there is an upgraded version called HWMonitor Pro that offers additional features.
Key Features:
- Reports on Server Hardware Statuses: Monitors and reports on the statuses of various hardware components within servers.
- Checks Voltage and Temperature: Specifically checks and reports the voltage and temperature of monitored hardware components.
- Works on Devices Running Windows: Compatible with devices running the Windows operating system.
Why do we recommend it?
HWMonitor is a free tool that provides data on the physical aspects of a PC. These factors include temperature, fan speed, battery status (for laptops), power supply voltage, and other physical statuses of the PC’s components. You can load this software onto your Windows computer and there is also a version for Android devices.
The Pro version provides you with additional features like remote monitoring, which allows you to monitor multiple PCs or Android devices remotely. You can also create graphs to view performance data in context. The Pro version supports up to 20 connections. Prices start at $22 (£16.66) for 10 connections and $38.77 (£28.78) for up to 20 remote connections.
Who is it recommended for?
HWMonitor is suitable for small businesses or for personal use. The free version reports on the device on which it runs. That functionality would not be suitable for large organizations that have too many PCs for technicians to visit them all in person. The paid, Pro version can be networked. However, only for up to 20 devices.
Pros:
- Freeware with Paid Options for Remote Monitoring: HWMonitor is freeware, and it offers paid options for remote monitoring, providing flexibility for users with various monitoring needs.
- Open-Source Transparent Project: Being an open-source transparent project, HWMonitor allows users to access and modify the source code, fostering community collaboration and customization.
- Great for Home Labs and Smaller Networks: Particularly well-suited for home labs and smaller networks where a simple, effective hardware monitoring solution is required.
- Available for Both Linux and Windows: HWMonitor is available for both Linux and Windows, extending its compatibility across different operating systems.
Cons:
- Non-Customizable Interface: The interface of HWMonitor is not customizable, which may make it difficult for users to track only the specific metrics they are interested in.
- Limited Visualization Features: Users have suggested that HWMonitor could benefit from better visualization features, especially when reporting over longer periods of time, to enhance data analysis.
- Not Designed to Monitor More Than One Machine at a Time: HWMonitor is not specifically designed to monitor more than one machine at a time, limiting its suitability for larger-scale network environments.
HW Monitor is recommended if you’re looking for a basic temperature monitoring solution for your desktops. It doesn’t have the range of features that a larger network monitoring suite offers, but it is still a very useful tool. You can download the program for free from this link here.
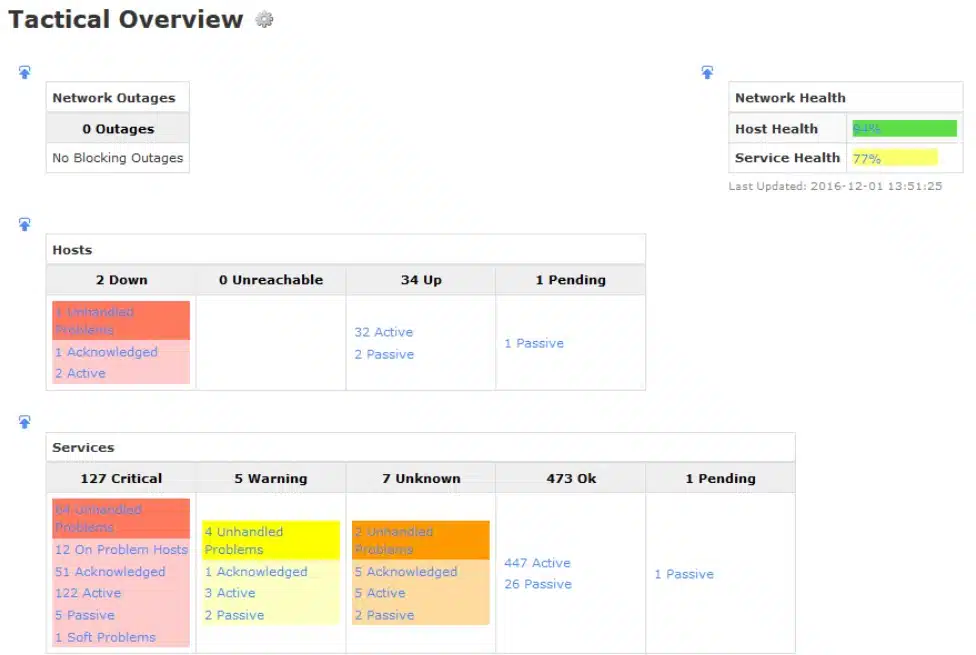
9. Nagios XI
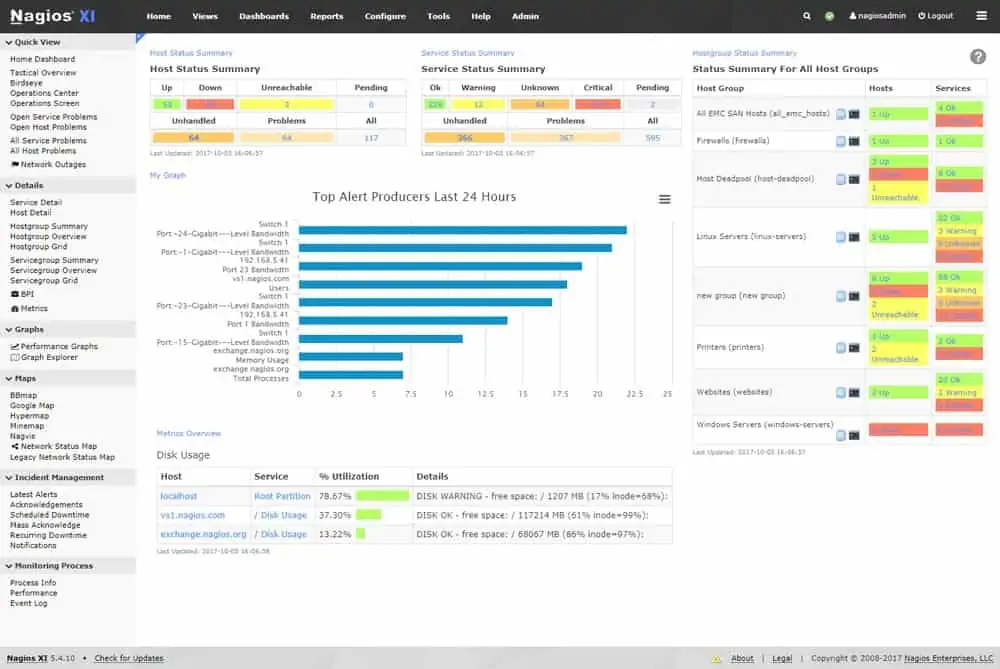
Nagios XI is a widely-used SNMP monitoring solution that can monitor Windows and Linux devices. Through the web-based GUI, you can monitor the CPU, Memory Usage, Uptime, Disk Usage, and more on connected devices. Visualization options like graphs enable you to have a complete perspective of what is going on.
Key Features:
- Monitors Servers, Applications, and Networks: Provides monitoring capabilities for servers, applications, and networks, ensuring a comprehensive view of the IT infrastructure.
- Extensible by Thousands of Free Plug-ins: Nagios XI can be extended with thousands of free plugins, allowing users to customize and enhance the monitoring functionality.
- Includes Alerts for System Problems: Alerts users to system problems, enabling timely identification and resolution of issues.
Why do we recommend it?
Nagios XI is a long-running system monitoring package that looks after networks, endpoints, software, and cloud systems. The package provides PC hardware monitoring through SNMP but you can also use plug-ins to use other monitoring strategies. The Nagios XI software is a paid package but the plug-ins are free.
The tool can be configured according to your requirements with relative ease. Configuration wizards walk you through the process of configuring monitoring elements and discovering devices. You can also configure email and SMS to let you know about changes to your devices.
The software is also highly extensible with a range of plugins available on the Nagios exchange. The Nagios Exchange features plugins that have been submitted by users. Plugins Check Linux CPU Process Scheduler and I/O Stats, Check UNIX Memory Usage, Check Physical Memory, and more.
Who is it recommended for?
Nagios XI is quite expensive and very comprehensive, so it wouldn’t be suitable for small businesses. The tool is a good choice for mid-sized and large organizations because it provides just about all of the IT asset monitoring services that businesses could need. The software runs on Linux, VMware, or Docker.
Pros:
- Open-Source Transparent Tool: Nagios XI is an open-source transparent tool, allowing users access to the source code for customization, collaboration, and transparency.
- Simple, Yet Informative Interface: Offers a simple yet informative interface, providing users with a clear overview of their monitored environment.
- Available on Both Windows and Linux Operating Systems: Nagios XI is available on both Windows and Linux operating systems, offering flexibility in deployment.
Cons:
- Installation Can Be Technical and Complex: Some users find the installation of Nagios XI to be technical and complex, requiring a certain level of expertise for setup and configuration.
Nagios XI is a very high-quality network monitoring tool, that has enough flexibility to support the needs of most enterprises regardless of their size. Nagios XI starts at a price of $1,995 (£1,510) for a 100-node license. You can download the free trial version here.
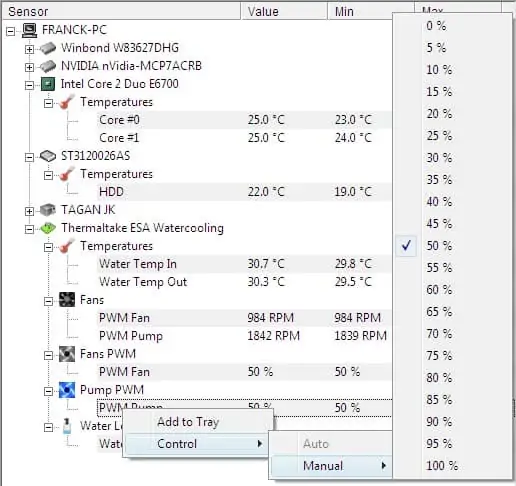
10. Open Hardware Monitor
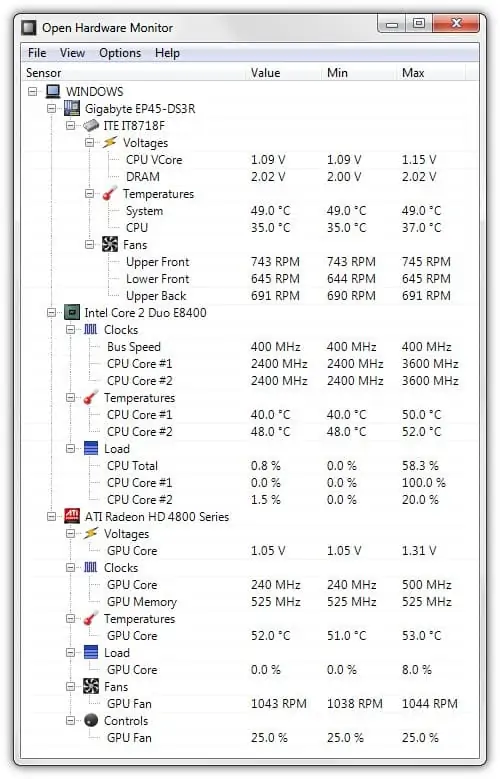
Open Hardware Monitor is an open-source hardware monitoring tool for Windows and Linux that can monitor the temperature, fan speed, voltage, load, and clock speeds of a computer. You can view performance details broken down into a table view that details the Minimum and Maximum value of the metric you’re monitoring.
Key Features:
- Measures Multiple Metrics: In addition to temperature readings, it can measure other metrics such as fan speed, clock speed, and voltage, offering a more comprehensive view of hardware performance.
- Checks Device Statuses: Monitors and reports on the statuses of various hardware components within a system.
- Runs on Windows and Linux: Compatible with both Windows and Linux operating systems, providing versatility in platform support.
Why do we recommend it?
Open Hardware Monitor is a free tool that will monitor a PC’s physical statuses. The software only reports on the computer that hosts it and there isn’t a networked version. The tool gives very detailed information on temperatures, detailing the statuses of different components within the PC.
The platform can monitor Intel and AMD core sensors, as well as NVIDIA and AMD GPU sensors. For monitoring computer temperature, Open Hardware Monitor is compatible with SMART temperature sensors. All the data captured by the program is published to WMI so that the data can be read by other applications.
Who is it recommended for?
The exact information that you can get out of the monitor depends on the reporting capabilities of the PC’s chip. In many cases, you won’t be able to see temperature data. The software is available for Linux as well as for Windows. This free package will appeal to small businesses.
Pros:
- Free Open-Source Project: Being a free open-source project, Open Hardware Monitor allows users to access and modify the source code, fostering community collaboration and customization.
- Better Suited for Home PCs and Enthusiasts: Well-suited for home PCs and enthusiasts who require a simple and accessible monitoring tool for personal use.
Cons:
- Only Available for Windows: Open Hardware Monitor is limited to the Windows and Linux operating systems, potentially excluding users on other platforms.
- Not Ideal for a Business Environment: Due to its limitations in multi-machine monitoring and lack of features typically required in business environments, Open Hardware Monitor may not be the ideal choice for organizational use.
Open Hardware Monitor is a great utility for monitoring the performance of your computer. It’s free and provides you with a basic hardware monitoring experience. You can download the program for free.
Top Choice: PRTG Network Monitor
Monitoring computers can get tricky very quickly, particularly if you’re working with lots of devices. Trying to stay on top of performance, availability, CPU usage, and disk usage without reliable software is an uphill struggle. PC monitoring software makes the process much easier by giving you a centralized location to monitor your devices.
We’ve included a range of tools on this list from complete network monitoring suites to smaller hardware monitoring tools. Our editor’s pick is Paessler PRTG because of its autodiscovery capabilities and simple sensors system. Other notable alternatives are SolarWinds NPM and ManageEngine OpManager.
PC monitoring FAQs
Does my computer have monitoring software?
Windows PCs have a native activity monitoring system that can be found in the Task Manager. To get to this utility, right-click on the task bar at the bottom of your screen and select Task Manager from the pop-up menu.
What is the monitoring software of a computer?
Monitoring software can be onboard, reporting on the processes and resources of that computer only. It is also possible to get a networked computer monitor that can aggregate the monitoring of all computers on a site. This type of software is useful for businesses that can’t rely on the users to check on monitoring software loaded on the device. A wider monitoring opportunity is presented by remote monitoring tools that enable one central office to monitor the performance of computers on multiple sites.
Is remote system monitor safe?
Monitoring systems that are designed to enable remote monitoring have encryption protection built into them so that data traveling across the internet between sites is secure. Therefore, as long as you protect access to the console of the system with credentials, these remote monitoring tools are safe to use.
