The Java Virtual Machine (JVM) is becoming prolific and you might not realize that you are running one to support your applications. The problem with virtual machines is that they are kept isolated from the operating system of their hosts. So many of the services that a lot of monitoring tools use won’t work – the separation of the platform blocks operating system access.
In order to cover JVM performance, a monitoring tool needs to be able to monitor hypervisors. It needs to be tuned in order to work with the log messages generated by the JVM that pass the information on the internal operations of the JVM. The monitor also needs to explore the VM black box to make sure that all of the JVM resource requirements are met.
Here is our list of the best JVM monitoring tools:
- AppOptics EDITOR’S CHOICE Provides infrastructure and application monitoring that covers all possible causes of JVM performance issues. This SaaS tool monitors everything from the network through to code efficiency. Start 14-day free trial.
- eG Enterprise JVM Monitoring (FREE TRIAL) This Java Virtual Machine monitor is part of a hybrid system monitoring package that covers infrastructure and applications. Runs on Windows Server and Linux, or take it as a SaaS package. Access a 30-day free trial.
- ManageEngine Applications Manager (FREE TRIAL) This monitoring tool is very strong in tracking JVM garbage collection routines and memory management. It installs on Windows Server and Linux. Start 30-day free trial.
- Site24x7 APM (FREE TRIAL) A cloud-based infrastructure and application monitor that covers JVM operations and the performance of all its supporting services. Start 30-day free trial.
- Datadog APM An application performance monitor that is based in the cloud and implements JVM monitoring.
- Sematext Monitoring A log-centered system and security monitoring service that is delivered from the cloud and includes JVM performance monitoring.
- Dynatrace A cloud-based system monitor that includes JVM monitoring and a unique end-to-end transaction monitor.
JVM is not just a passive container. It has tasks of its own to perform in order to serve the Java processes that it hosts. These include “garbage collection” which should release resources once a Java process has finished with them.
There are many different services that need to be tracked in order to keep a JVM working properly and that involves too many factors to track manually. The only solution to the successful operation of a JVM and the services and software that it supports is to use an automated JVM monitoring tool.
JVM performance monitoring
The JVM system has built-in handlers for memory and resource management. Unfortunately, each resource access event can only be managed on a program-by-program basis.
If several Java programs are running simultaneously, they can lock each other – one holds a resource that the other needs to complete a task while the other holds a different resource that the first program is trying to access. So, neither program can progress. Such scenarios are quite common in JVM environments with regard to memory and database connections.
An example of a database-related issue occurs when the database has established a maximum number of connections. Therefore, no database-dependent process can proceed until one of the other processes connected to the database completes. If the processes connected to the database hang because of memory issues, all of the Java programs on the server will grind to a halt.
Java performance issues fall into five categories:
- Memory availability
- Database access
- Multi-thread deadlocks
- Application/services availability
- Server and network problems
Spotting these issues and resolving such problems requires a JVM monitoring tool that can work at many levels of the stack simultaneously and examine hardware and application performance constantly.
The best JVM monitoring tools
Our methodology for selecting a JVM monitoring system
We reviewed the market for Java virtual machine monitoring tools and analyzed the options based on the following criteria:
- Hypervisor monitoring capabilities
- Monitoring of supporting resources, such as memory allocation
- Monitors to track JVM functions, such as garbage collection
- Activity logging
- Live performance graphs
- A free trial or a demo package that enables a cost-free assessment
- Value for money from a tool that covers a range of virtualization services as well as JVM tracking
Using this set of criteria, we looked for a range of synthetic monitoring services with both cloud-based and on-premises options.
1. AppOptics (FREE TRIAL)
AppOptics is a cloud-based service that operates both infrastructure and application monitoring. The cloud service is offered in two plans, which are Infrastructure and Application Performance Monitoring. Fortunately, for JVM users, the APM package also includes the Infrastructure module.
Key Features:
- Comprehensive Monitoring: Offers both infrastructure and application performance monitoring, crucial for JVM users.
- JVM-Specific Insights: Provides in-depth tracking of JVM activity, server resources, and interactions with other applications.
- Cloud-Based: Delivers a scalable and accessible cloud service for monitoring needs.
Why do we recommend it?
The AppOptics APM package simultaneously tracks JVM activity, the servers that support those VMs, and the other applications with which they interact. Memory management is particularly important for JVM and the AppOptics system watches those server resources. Performance dips could be due to those resources and not the JVM itself.
The complexities of JVM mean that every underlying resource that contributes to the delivery of an application containing Java needs to be monitored. The full AppOptics service covers all of these contributing resources. Lateral interactions with other applications are also monitored by AppOptics because it watches over database performance and web application systems as well as hypervisors and Java code.
Although the service is delivered from the cloud, it does need an agent installed on each of the servers that host your JVM implementations. Fortunately, there is an agent version for every server type that you could run Java on.
The Infrastructure part of the AppOptics package monitors the server and network systems that the JVM relies on. The JVM’s structure is also an issue for the Infrastructure module. The processes that implement the JVM need to be tracked by the APM module of AppOptics. Each process running within the JVM also needs to be tracked by the APM through gathering JVM log messages. Finally, all of the other applications that the Java processes within the JVM have to access need to be kept in peak performance and watched by the APM.
Java itself is built into many service libraries for other platforms, including .NET, PHP, and Python. There is constant interaction between Java processes and other applications and AppOptics can track requests across processes and identify different threads that contribute to the same process.
While the day-to-day benefit of running the AppOptics JVM monitor lies in its ability to take over all supervision tasks, it is also a useful system for root cause analysis. An alert mechanism in AppOptics means that the IT staff can assume that everything is running smoothly unless otherwise notified. Once a problem arises, specialists have the support of AppOptics, which can identify the likely source of the problem, be it a slow network or a bug in a Java script.
Who is it recommended for?
If you are running JVM instances, you need a tool like Appoptivcs to keep track of everything all at once. The APM is the higher of the two AppOptics and it is considerably more expensive than the lower Infrastructure plan. This cloud-based system will monitor systems without human intervention, improving technician productivity.
Pros:
- Holistic JVM Management: Enables monitoring of every layer affecting JVM performance, from code to infrastructure.
- Root Cause Analysis: Features advanced diagnostics to pinpoint the origins of performance issues.
- User-Friendly Interface: Boasts intuitive dashboards for real-time and historical data analysis.
Cons:
- Trial Period: A more extended trial could better showcase its extensive capabilities.
The attractive screens of the dashboard are well organized and promote drill-down investigations. The console is entirely hosted in the cloud, so it can be accessed from any standard browser. You can try AppOptics for yourself by accessing a 14-day free trial.
AppOptics is our top recommendation for JVM monitoring because it covers every level of the stack that contributes towards successful JVM operations. AppOptics runs continuous checks on the statuses of JVM, the Java code it protects, the processes that it and its Java scripts launch, threads, coordinating applications, infrastructure, and services. Just one failure in any single element can impair the performance of a JVM and that will grind most of your active applications to a halt. The alerts of AppOptics spot trouble before it gets serious and the drill-down screens of the dashboard show exactly where the cause of the problem lies. Start 14-day Free Trial: my.appoptics.com/sign_up OS: Cloud-basedEDITOR'S CHOICE
2. eG Enterprise JVM Monitoring (FREE TRIAL)
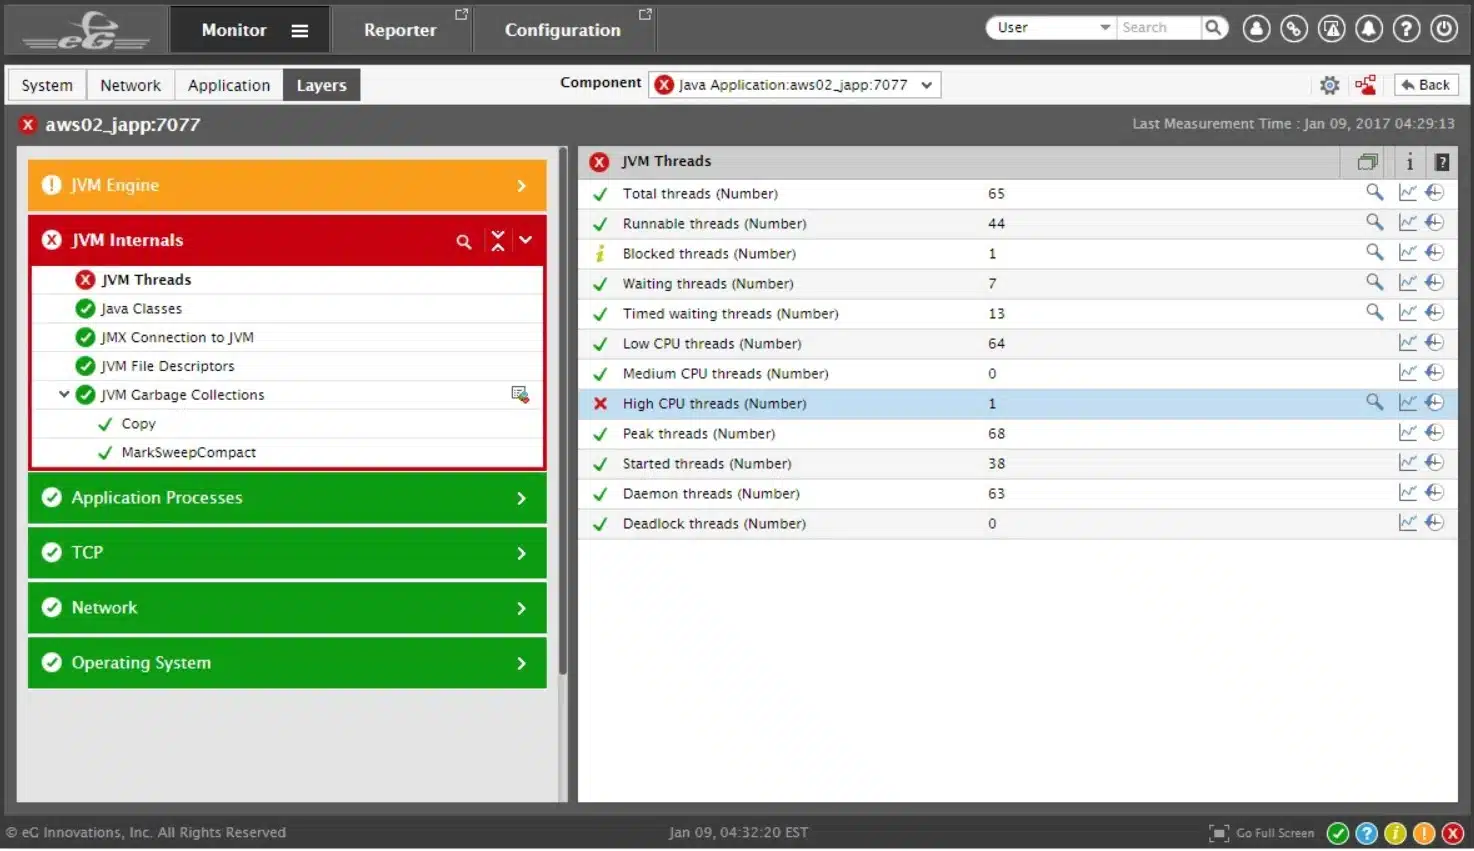
eG Enterprise is an infrastructure and application monitoring package that is able to track the performance of both cloud and on-premises systems. One of the applications that the tool is able to track is JVM.
Key Features:
- Versatile Monitoring: Tracks user experience, JVM memory management, and garbage collection among other metrics.
- Comprehensive Alerts: Sets performance thresholds to alert for any potential JVM-related issues.
- Infrastructure Insight: Integrates JVM monitoring with broader system and application performance tracking.
Why do we recommend it?
eG Enterprise JVM Monitoring is part of a system-wide monitoring package that will track activity on your servers and networks as well as applications such as virtualizations and databases. All assets are monitors with performance thresholds that raise alerts if problems arise. This provides instant root cause analysis.
The JVM monitoring system is part of the APM module of the eG Enterprise and has an underlying resource monitoring system. The Java activity of your applications will use system resources, such as server memory, and it will also access network facilities, so the infrastructure monitoring layer of this package is also essential for full JVM management. The system is able to assess demand on resources that comes from JVM instances and all of the other applications running on the same host. Knowing the full capacity of that server enables the monitor to identify when resources are likely to run short. That lack of capacity in the supporting services will impair the performance of the JVM.
Knowing the root cause of a performance issue with your JVM system enables you to react and fix the problem much quicker than if you have to begin your investigation from scratch. The eG Enterprise monitor is able to predict when resources are going to run short and raise an alert. That means you can start your mitigation actions to head off problems before they become noticeable to users.
Who is it recommended for?
This package is charged for per server, which makes it scalable and suitable for any size of business. The service is available as a SaaS package, which also saves the cost of hosting the monitoring software. Businesses that want to host their systems in-house can download the software.
Pros:
- Predictive Alerts: Proactively identifies potential resource shortages, allowing preemptive action.
- Deep JVM Analysis: Offers detailed examination of JVM memory usage and thread status for optimized performance.
- Scalable Pricing: Charges per server, making it adaptable to various business sizes.
Cons:
- Lack of Public Pricing: Transparency in pricing would aid in decision-making for potential users.
The eG Enterprise service is licensed per physical server, so you can watch over as many JVMs or other virtual systems as you need to at no additional cost. You can choose to download the software for eG Enterprise and host it on Windows Server or Linux. Another option is to access the package on its SaaS platform. You can get a 30-day free trial of both the infrastructure and APM modules of eG Enterprise.
3. ManageEngine Applications Manager (FREE TRIAL)
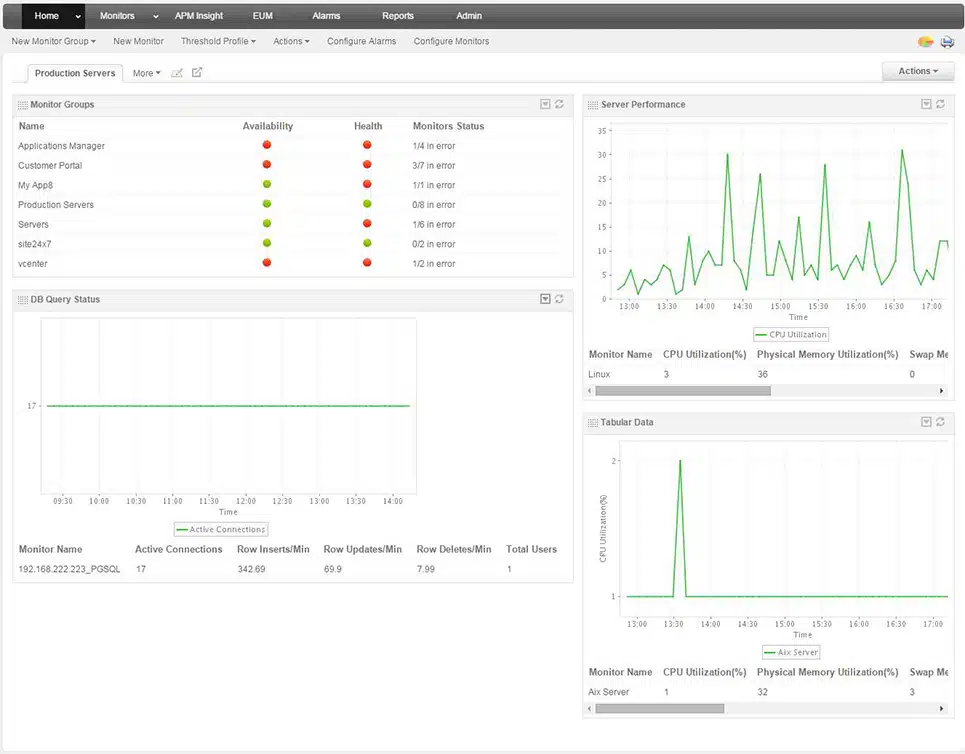
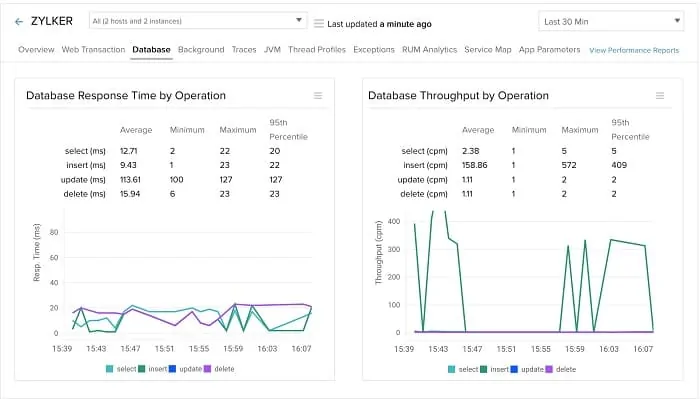
When designing their JVM performance monitoring module in the Applications Manager, ManageEngine decided that memory management was the biggest issue. They were right. The Applications Manager briefing documents stress that the JVM monitoring tool focuses on how JVM manages the memory allocation and release processes. There is a lot more to JVM memory usage and the Applications Manager covers all of those issues.
Key Features:
- Memory Management Focus: Emphasizes JVM’s memory allocation and garbage collection processes for optimal performance.
- Process Monitoring: Identifies and tracks each process, highlighting potential issues like hanging or abandoned processes.
- Comprehensive Coverage: Monitors JVM alongside other critical applications and server resources.
Why do we recommend it?
ManageEngine Applications Manager provides monitoring for applications, such as JVM and it also monitors physical server resources. The tool scans your servers and identifies all of the applications that it discovers it then tracks any external systems that these applications contact and draws up an application dependency map.
The Applications Manager isn’t just a JVM monitoring tool. While it tracks JVM performance, it is also watching those other applications that Java processes rely on, such as databases and web applications.
As the Application Manager watches all processes, it is able to spot any hanging or abandoned processes and recommend that they be killed. This vigilance alone will solve many of the potential performance problems that JVM can experience and cause other applications running on the same server to fail.
The Applications Manager also monitors server statuses. These factors include overall server memory utilization, disk availability and interactions, and interface activity. The only part of the stack that the Applications Manager doesn’t cover is the network. However, its monitoring of interfaces enables it to show where the problem lies if the network is acting up. Users would need to add on ManageEngine OpManager in order to drill all the way through to network device issues; however, the two modules integrate.
Who is it recommended for?
ManageEngine offers a Free edition of this package but that plan is limited to monitoring five assets. The Professional edition is affordable for small businesses and provides much more capacity. Larger businesses pay higher prices for more capacity and there is a multi-site version available as well.
Pros:
- Integrated Monitoring: Offers a holistic view of applications and underlying infrastructure, identifying interdependencies.
- Proactive Management: Capable of automatic process termination to prevent system overloads.
- Flexible Deployment: Available for on-premises installation on Windows Server and Linux, catering to various business needs.
Cons:
- Feature Richness: The extensive array of features necessitates a learning period to fully leverage the platform.
Applications Manager is available for installation on Windows Server and Linux. ManageEngine makes the package available for a 30-day free trial.
4. Site24x7 APM (FREE TRIAL)
The Site24x7 system is a SaaS platform and it is marketed in modules. The APM is separate from the Infrastructure monitoring system of the platform. However, it does include server monitoring and network monitoring that can be purchased as an add-on service.
Key Features:
- Cloud-Hosted Solution: Delivers a comprehensive Application Performance Monitoring service from the cloud.
- Server Resource Monitoring: Includes CPU and memory monitoring to predict and prevent potential performance issues.
- Application-Wide Observability: Tracks JVM performance metrics alongside other applications and server operations.
Why do we recommend it?
Site24x7 APM is a cloud-based system that is packaged together with network and server monitoring. This is a great combination for monitoring JVM, which this package has specific tracking routines for. The system also observes server resource utilization and availability to predict potential problems. It will track other applications simultaneously.
The core focus of JVM performance monitoring in Site24x7 APM looks at the activities of the JVM itself. Metrics checked by the APM include CPU capacity usage, process count, number of garbage collection activities, garbage collection process time, and thread summaries.
The focus on JVM activities is not unexpected. However, it isn’t the sole responsibility of the APM because it tracks all processes running on the server and it simultaneously monitors all applications. So, it can spot when there are problems with database capacity. As it also tracks overall server statuses, such as disk usage, memory availability, and CPU capacity, it is able to see any performance problems that might impact on the JVM even if the applications launching those problematic processes are completely unrelated to JVM. This is important because a server that is running out of resources is going to impact the performance of JVM.
Site24x7 APM is very strong on web application performance and there is a specialist module for web testing if your JVM contributes heavily to a website. The Website Monitoring module is able to integrate with the APM. However, the standalone APM implementation includes some web performance checks.
Who is it recommended for?
This service is suitable for businesses of all sizes. The base package is sized to be accessible for small businesses. Larger companies pay for more capacity. The service is hosted in the cloud and you need to install agents on each of your servers for data collection.
Pros:
- Web Application Specialization: Offers strong capabilities in monitoring web-based JVM applications, with options for deeper web performance analysis.
- AI-Powered Analysis: Enhances root cause analysis with AI, streamlining the troubleshooting process.
- Scalable Service: Adapts to businesses of all sizes with a base package for small businesses and additional capacity for larger enterprises.
Cons:
- Complexity: The broad feature set and additional modules extend beyond JVM monitoring, requiring time to explore and integrate fully.
Site24x7’s system, including its console, is hosted in the cloud. However, the system does need an onsite agent installed on the server where the JVM is running. Site24x7 APM is charged for by subscription with a monthly rate for the base package and a menu of add-ons to enhance and tailor the service towards specific needs. It is available for a 30-day free trial.
5. Datadog APM
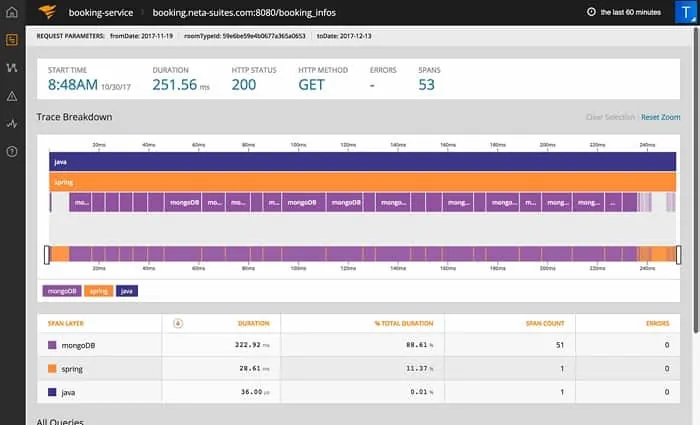
Datadog is a cloud service that includes a range of IT systems monitoring tools. One of those services is Datadog APM, which includes JVM performance monitoring. The dashboard for Datadog is hosted in the cloud and can be accessed through any standard browser. That dashboard includes screens that enable JVM performance monitoring covering a range of important metrics.
Key Features:
- Cloud-Based Monitoring: Provides a comprehensive Application Performance Monitoring solution accessible from anywhere.
- Live Performance Tracking: Offers real-time insights into application performance, including JVM metrics.
- Application Dependency Mapping: Identifies and visualizes how applications and services are interconnected, highlighting dependencies.
Why do we recommend it?
Datadog APM is a cloud-based service that includes distributed tracing. There is a higher plan that also provides code profiling for Web applications for which you have access to the code. The system is able to create service dependency maps, which link your JVM instances to the systems that they support.
The APM constantly monitors key statistics about JVM instances. These focus on resource usage, particularly memory activity and the efficiency of garbage collection.
Datadog APM measures response times and process activities for all applications on a server. This service shows whether related applications are performing badly. Such problems could have an effect on JVM performance, particularly if those applications offer services to Java processes running in JVM. An example of such a service would be database management systems.
The dashboard of Datadog APM ties together processes across applications, indicating the relationship between them and measuring performance across these boundaries.
Who is it recommended for?
This tool is exceptional at tracking Web applications, particularly those that are composed of microservices and are hosted on cloud servers. So, if this describes your application profile, the Datadog APM tool is probably the best option on this list for you. Server and infrastructure monitoring is provided by a separate module.
Pros:
- Extensive JVM Monitoring: Focuses on critical JVM performance aspects, such as memory usage and garbage collection efficiency.
- AI-Enhanced Root Cause Analysis: Utilizes advanced algorithms to quickly pinpoint the source of issues.
- Versatile Application Support: Ideal for web applications, especially those built on microservices architecture and hosted on cloud platforms.
Cons:
- Trial Limitations: A longer trial period could better demonstrate its full capabilities for potential users.
The APM also examines server performance statistics. Server monitoring can be enhanced by adding on the Infrastructure monitor. The Datadog APM is charged for on a subscription model with a rate per host per month. Datadog offers the APM for a 14-day free trial.
6. Sematext Monitoring
Sematext is a cloud-based monitoring service that has a strong SIEM security monitoring feature. The main strategy of Sematext revolves around log file collection and analysis. This is a typical methodology for security information and event management systems. Log messages arrive in real-time and are displayed before they are filed.
Key Features:
- Comprehensive Cloud Service: Offers a broad monitoring solution including infrastructure, applications, and JVM performance.
- Log Analysis Integration: Employs log file analysis for in-depth monitoring and security insights.
- Java Profiler: Includes specific tools for JVM performance analysis, focusing on key metrics like memory usage and thread activity.
Why do we recommend it?
The Sematext platform provides JVM performance tracking along with other applications plus server monitoring. The package will also watch over other virtual systems, such as containers and hypervisors. The package identifies total server capacity and watches as resources get used up. It will raise an alert if it sees problems ahead.
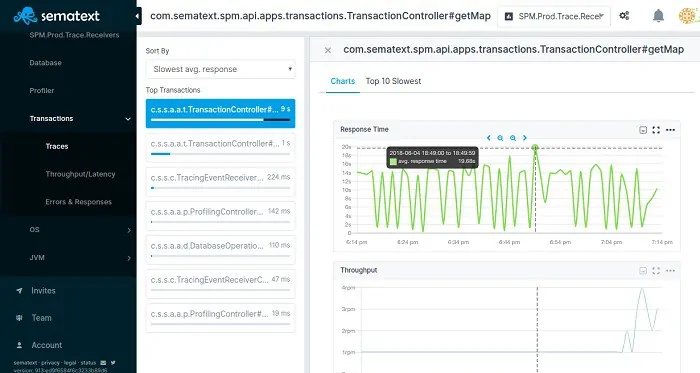
The Sematext system is able to exploit all of the information contained in log messages to produce a range of monitoring and management services. One of these is an infrastructure monitor, called Sematext Monitoring and it includes JVM performance monitoring. This is called the Java Profiler.
Sematext Monitoring is able to gather statistics on more than 100 factors surrounding Java performance. Most of these are made available for root cause analysis. The Sematext system recognizes a few key metrics that indicate performance statuses. These are memory usage, garbage collection activity, and data on JVM threads.
As Sematext stores all of the information that it gathers, users are able to check back to see the same performance indicators over time. This can be useful when trying to identify whether JVM performance impairment follows a pattern and whether there are any time-related issues that cause problems. Sematext Monitoring watches all other processes and makes constant checks on server resource availability.
Who is it recommended for?
This cloud-based system is similar to the Site24x7 and Datadog services. Sematext Monitoring has a Free edition that includes JVM monitoring. This plan is limited to monitoring five hosts but it is suitable for small businesses. Higher plans cater to larger businesses. You can adjust the data retention period to control costs.
Pros:
- Flexible Monitoring: Capable of tracking a wide array of environments, from on-premise to hybrid cloud setups.
- Continuous Asset Discovery: Automatically updates device inventories, ensuring accurate monitoring coverage.
- Built-In Troubleshooting: Features like the Java profiler aid in diagnosing and resolving performance issues efficiently.
Cons:
- Trial Duration: The free trial period may be too short for comprehensive evaluation of its extensive features.
Sematext Monitoring is metered, with a rate set per data collection agent per hour and no extra charges for data processing volumes. There are three plans available: Basic, Standard, and Pro. The Basic plan is free to use and has a limit of monitoring five hosts with a data retention period of 30 minutes. The Standard plan has a data retention period of one month and the Pro plan retains data for two months. The Standard and Pro plans can be experienced on 14-day free trials.
7. Dynatrace
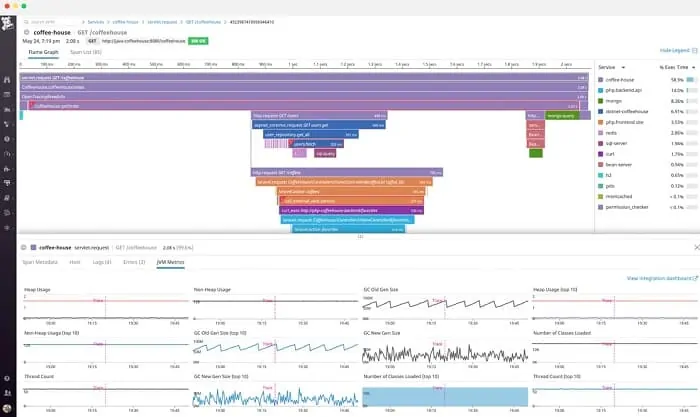
Dynatrace is a cloud-based infrastructure and application performance monitor that is particularly strong at web monitoring. Both the APM and Infrastructure monitoring modules are bundled together into one package, which is great for monitoring JVM performance.
Key Features:
- Comprehensive Monitoring: Offers an all-in-one solution for application and infrastructure performance, including JVM.
- Advanced Transaction Tracking: Employs end-to-end transaction journey monitoring to understand each request’s impact across systems.
- Cloud-Based Efficiency: Utilizes a cloud-based platform for flexible, scalable monitoring solutions.
Why do we recommend it?
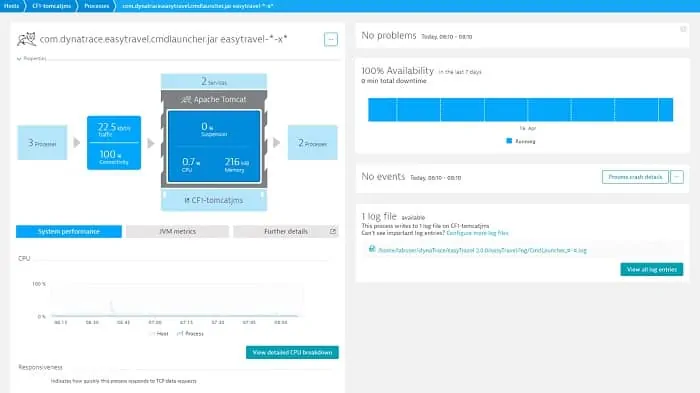
Dynatrace provides application tracking and infrastructure resource monitoring. The tool tracks and maps all applications and shows how they fit together. Performance monitoring watches each transaction as it ripples through each resource and with JVM can simultaneously record the multiple services that are accessed together. It also tracks systems that rely on JMV instances.
The JVM performance monitoring features of Dynatrace cover a comprehensive list of metrics in a JVM that includes memory statuses, garbage collection, request, process statuses, response times, interactions, error rates, and traffic volumes.
As well as straightforward monitoring status by status, Dynatrace offers a unique end-to-end transaction journey monitor. This follows each request and examines each service that contributes towards its delivery and fulfillment. In web implementations, this is particularly useful to examine how JVM statuses contribute towards the success or failure of this activity.
Who is it recommended for?
The APM and infrastructure package is a little pricey when compared to Datadog or Site24x7. This service is probably best suited for large organizations that operate a lot of interconnected systems and virtualization. Businesses that don’t need such extensive service mapping won’t get the best value out of this tool.
Pros:
- In-Depth JVM Insights: Provides detailed metrics on JVM performance, such as memory management, garbage collection, and service interactions.
- Visual Dashboards: Features highly customizable and visually engaging dashboards for monitoring and analysis.
- Cross-Application Visibility: Tracks cross-application transactions, essential for environments with complex interdependencies.
Cons:
- Enterprise Orientation: Best suited for large organizations, may be complex and costly for smaller setups.
- Subscription Model: While offering extensive features, the pricing model may pose a barrier for some businesses.
Dynatrace charges for its Full-stack Monitoring service by a subscription rate per month. You can experience the system on a 15-day free trial.
Choosing a JVM Monitoring tool
Keeping JVM running satisfactorily requires a very comprehensive tool. A standalone utility or command-line utility is just not good enough. Tests need to be run recursively and the monitor needs to have status threshold alerts on a large number of resources to head off potential performance issues.
A monitoring service that includes an alerting mechanism is preferable to a system that needs to be attended by an IT technician. Tasking an IT specialist to sit and run tests and watch for results is a waste of human resources. Tech specialists are expensive and difficult to find, so you want to make the most of their time by removing any task that can be automated. Monitoring JVM and other system resources is a very good example of the sort of work that computers do better than humans.
You need to find a good JVM monitoring system and if you can find one that takes care of many other infrastructure and resource monitoring tasks, then you have saved yourself some money.
JVM monitoring FAQs
What should I monitor in JVM?
The performance statistics to gather when watching JVM are:
- Heap memory – The memory space used for applications
- Garbage Collection (GC) – The cleaning up of allocated memory once it is is no longer needed – returning it to availability
- Threads – These serve user requests
How do I monitor a Java process?
Perform Java process monitoring by implementing transaction tracing. Tracing works through logs, comparing actions to each line of code. This lets you see the influence of a Java process on the availability of system resources.
What is Java profiling tools?
A java profiler steps through Java code and links the execution of each line to system activity, such as thread execution memory activity, and garbage collection.
