
A properly configured WiFi network improves communication between the devices that connect using it which, in turn, helps productivity in a business. It, therefore, makes sense to ensure constant, strong, and secure signal strengths can be accessed across the whole campus.
One way administrators can make sure they are getting the most out of their networks is by using heatmap software.
Here’s our list of the best WiFi heatmap software:
- SolarWinds Network Performance Monitor EDITOR’S CHOICE A powerful WiFi heatmap tool from a company that is the best in the network performance management industry; the best tool for both small and enterprise networks. Start a 30-day free trial.
- Ekahau AI Pro This WiFi signal detection system includes utilities to plan AP placement and confirm signal coverage. Runs on Windows.
- NetSpot A WiFi heatmap tool for Windows devices; it can be used to keep on top of small as well as large WiFi networks.
- Acrylic WiFi Heatmaps Great heatmap design tool that allows administrators to visualize their future WiFi networks using prediction technology; test it before you roll it out.
- VisiWave Site Survey Windows tool that can be used to scan a WiFi network, and works well with GPS positioning to create very accurate heatmaps.
- AirMagnet Survey PRO Heavy-duty WiFi heatmap software network mapping tool for engineers who need to get a grasp on the health and performance of their networks.
- TamoGraph Site Survey This package is able to plot predictive site signal strength before WiFi deployment and then provide live signal strength results once APs are in place. Runs on Windows and macOS.
What is a WiFi heatmap software solution?
The best way to describe a WiFi heatmap would be that it is a color-coded, graphical presentation of the signal strengths being broadcasted from the access points (APs) located in a predefined perimeter.
Taking that into consideration, we can say that WiFi heatmap software is a tool that gauges the signal strengths in a predefined perimeter, color-codes its findings, and presents the output as a two-dimensional graphic presentation that is known as a “heatmap.”
Usually, a WiFi heatmap is bordered by the graphical representation of a real room, floor plan, or even a city, and overlaid by the colored representation of the wireless signal strength being analyzed.
How does a heatmap tool work?
The first thing to do would be to install a WiFi heatmap tool. A laptop or even a mobile device can be used.
Once done, the WiFi heatmap software monitors the WiFi signal strength as it is moved around a pre-specified area. It then assigns a color to the strength level and it plots it on a map that has been loaded for the purpose.
The recording tool can measure the signal strengths as it is moved around on foot or, in the case of a city-wide scan, in a vehicle.
What do we use WiFi heatmaps for?
Now, there are many real-life use cases where we may need to use a heatmap tool. As mentioned above, the first would be to ensure there is a good WiFi network in the workplace. But, there are more reasons:
- Site surveying and troubleshooting new wireless network installations – just like with any type of network infrastructure implementation and optimization, this is a challenging task which becomes especially so if there are no tools to help guide the engineer.
- Strength discovery – administrators can use these tools to map out where WiFi signals are strong and where improvements need to be made.
- Visual presentation – they can also use the tools to create layouts showing the coverage of their WiFi networks.
- Check for overlaps – they can see to it that there is no WiFi interference from neighboring networks.
- Monitoring – the tools can be used to see whether or not there are unauthorized users piggybacking on the network; a good example would be if WiFi bandwidth (or access points) are allocated by floor or department. Administrators can also spot potential rogue devices.
- Plan access point placement – in cases where they are planning to expand a network, the heatmaps can plot hardware and physical obstacles in the path of new WiFi installations. They can locate and identify sources of interference causing signal deficiency before the expansion work starts.
- Create channel and power plans – the tools can be used to tune and adjust the network configuration to squeeze the best performance out of it with minimum data packet loss balanced with optimal power consumption.
The best WiFi Heatmap software
Our methodology for selecting WiFi heatmap software
We reviewed the market for WiFi heatmap software and analyzed the options based on the following criteria:
- Attractive and easy-to-read graphics
- Color-coded transmission strength indicators
- Notes on each signal footprint to identify its source
- Related network management tools
- The ability to identify authorized and rogue wireless APs and devices
- A free option with the ability to upgrade to a feature-rich paid system
- Value for money that is indicated by useful tools at a good price
We found the following characteristics for the products we tested.
Feature Comparison Table
| Product/Features | SolarWinds Network Performance Monitor | Ekahau AI Pro | NetSpot | Acrylic WiFi Heatmaps | VisiWave Site Survey | AirMagnet Survey PRO | TamoGraph Site Survey |
|---|---|---|---|---|---|---|---|
| Heatmap Visualization | Yes | Yes | Yes | Yes | Yes | Yes | Yes |
| Real-Time Analysis | Yes | Yes | Yes | No | Yes | Yes | Yes |
| Supports Multiple Bands (2.4GHz, 5GHz) | Yes | Yes | Yes | Yes | Yes | Yes | Yes |
| Site Survey Tools | No | Yes | Yes | Yes | Yes | Yes | Yes |
| Integration with Existing Networks | Yes | Yes | No | Yes | Yes | Yes | Yes |
| Customizable Reports | Yes | Yes | No | Yes | Yes | Yes | Yes |
| Scalability (Suitable for Large Networks) | Yes | Yes | No | Yes | Yes | Yes | Yes |
| OS Compatibility | Windows | Windows | Windows, macOS | Windows | Windows | Windows | Windows |
| Free Trial Available | 30-day free trial | No | Yes | No | No | No | Yes |
1. SolarWinds Network Performance Monitor (FREE TRIAL)
Tested on: Windows Server
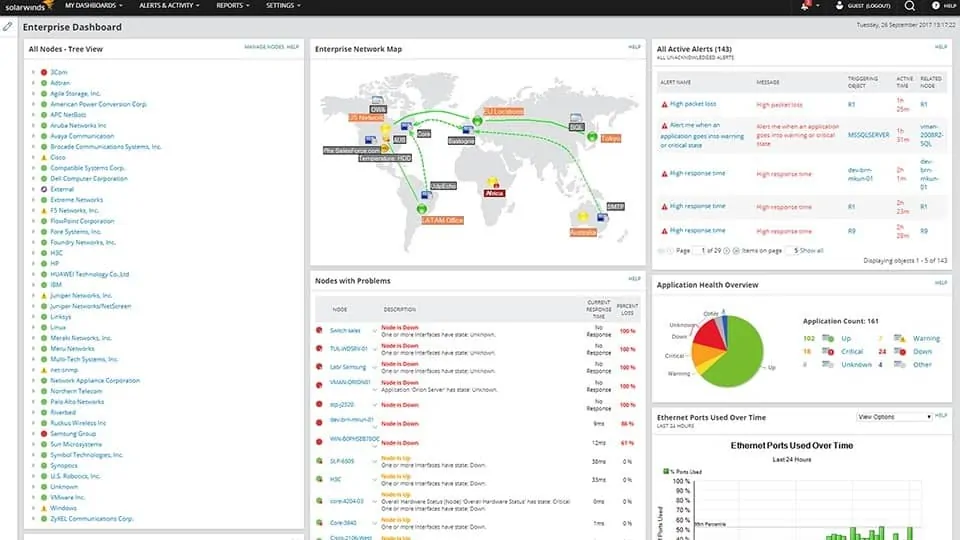
From SolarWinds, the leader in the IT and network performance management and monitoring software market, we have Network Performance Monitor (NPM).
This network performance monitoring tool’s interface is intuitive and informative; its dashboards and alerts are easy to configure. It allows administrators to prioritize the data they want to track and receive alarm notifications about before critical situations become a reality. Best of all, it has a dedicated WiFi heatmapping feature.
Key Features
- Color-Coded Maps: Provides color-coded maps, allowing users to visualize network performance and status in an intuitive and easily understandable manner.
- Easy to Understand: The platform is designed to be easy to understand, simplifying the process of monitoring and managing network performance.
- Overlay on a Floor Plan: Users can overlay network maps on a floor plan, providing a spatial representation of the network layout.
- Automatically Updated: The maps are automatically updated, ensuring that users have real-time information about the state of their network.
- Runs on Windows Server: NPM is designed to run on Windows Server, offering compatibility with Windows environments.
Why do we recommend it?
SolarWinds Network Performance Monitor offers a full network discovery and monitoring system that extends to wireless networks. The package is able to generate WiFi heatmaps, record equipment activities, and alert for strains and breakages in the whole networking system.
Administrators can use this network performance tool to gauge the performance of each Access Point (AP) in a building. The WiFi heatmaps used to capture the results are easy to create especially if they use NPM 11.5 or later.
Its algorithm combines coverage estimates with actual AP signal analysis to create accurate color-coded heatmaps.
Administrators can create, save, and continue to access their maps within NPM’s dashboard. They can find the automatically-updated heatmaps under “All Wireless Heat Maps” and see wireless clients that are currently connected – with just one click.
Viewing a wireless heatmap using the SolarWinds NPM heatmap software allows administrators to pinpoint all connected clients to within a three-meter range. This gives control over unauthorized access to a business’ WiFi network by monitoring all the devices that are on it.
Once created, labeled, and saved, the heatmaps update automatically to show the current information in real-time. This can be quite useful because administrators can use polling through WiFi APs to discover and recover lost mobile devices, for example.
Going beyond the discovery and mapping, NPM’s thorough cross-stack network data correlation and hop-by-hop network path analysis capability allow administrators to compare an odd or suspicious event to a baseline device behavior, understand what has happened, and resolve it quickly.
Extending this functionality, the detailed network device monitoring tool can ensure the health of hardware and nodes, while addressing any resource drains and security risks from unauthorized or rogue devices.
Who is it recommended for?
The SolarWinds system is suitable for large organizations. There is a free or cut-down version of the Network Performance Monitor and you need a lot of hardware to justify using an extensive package like this.
Pros:
- Highly Scalable: NPM is highly scalable, making it suitable for enterprise-level network monitoring and management.
- Detailed Reporting: The tool supports detailed reporting for heatmaps and site surveys, providing valuable insights into network coverage and performance.
- Templates for Accurate Coverage: NPM utilizes a variety of templates to recreate accurate coverage based on brand-name equipment, ensuring precision in network monitoring.
- Easy Configuration of Alerts: The platform allows for easy configuration of alerts, helping users receive notifications about issues before they impact network performance.
- Useful for MSPs: MSPs can leverage NPM to offer heat mapping as a service, extending its utility to service providers.
Cons:
- Requires Knowledge of Heat Mapping: The platform is feature-rich, but its full utilization requires knowledge of heat mapping and wireless networks. Users may need some expertise in these areas to maximize the benefits of the tool.
Download a 30-day, fully-functional free trial.
EDITOR'S CHOICE
SolarWinds Network Performance Monitor is our top choice. This WiFi heatmap tool works well with other popular brands in the networking industry. For example, the Orion Network Atlas allows administrators to map Cisco wireless controllers and mobile devices on a color-coded floor
Download: Start 30-day Free Trial
Official Site: solarwinds.com/network-performance-monitor
OS: Windows Server 2016 or later
Add on the Network Traffic Analyzer to get flow information, using the protocols NetFlow, IPFIX, sFlow, J-Flow, and NetStream. You can get both modules in the Network Bandwidth Analyzer Pack. These two units slot together and you access them through a single console. The software runs in Windows Server.
2. Ekahau AI Pro
Tested on: Windows, MacOS
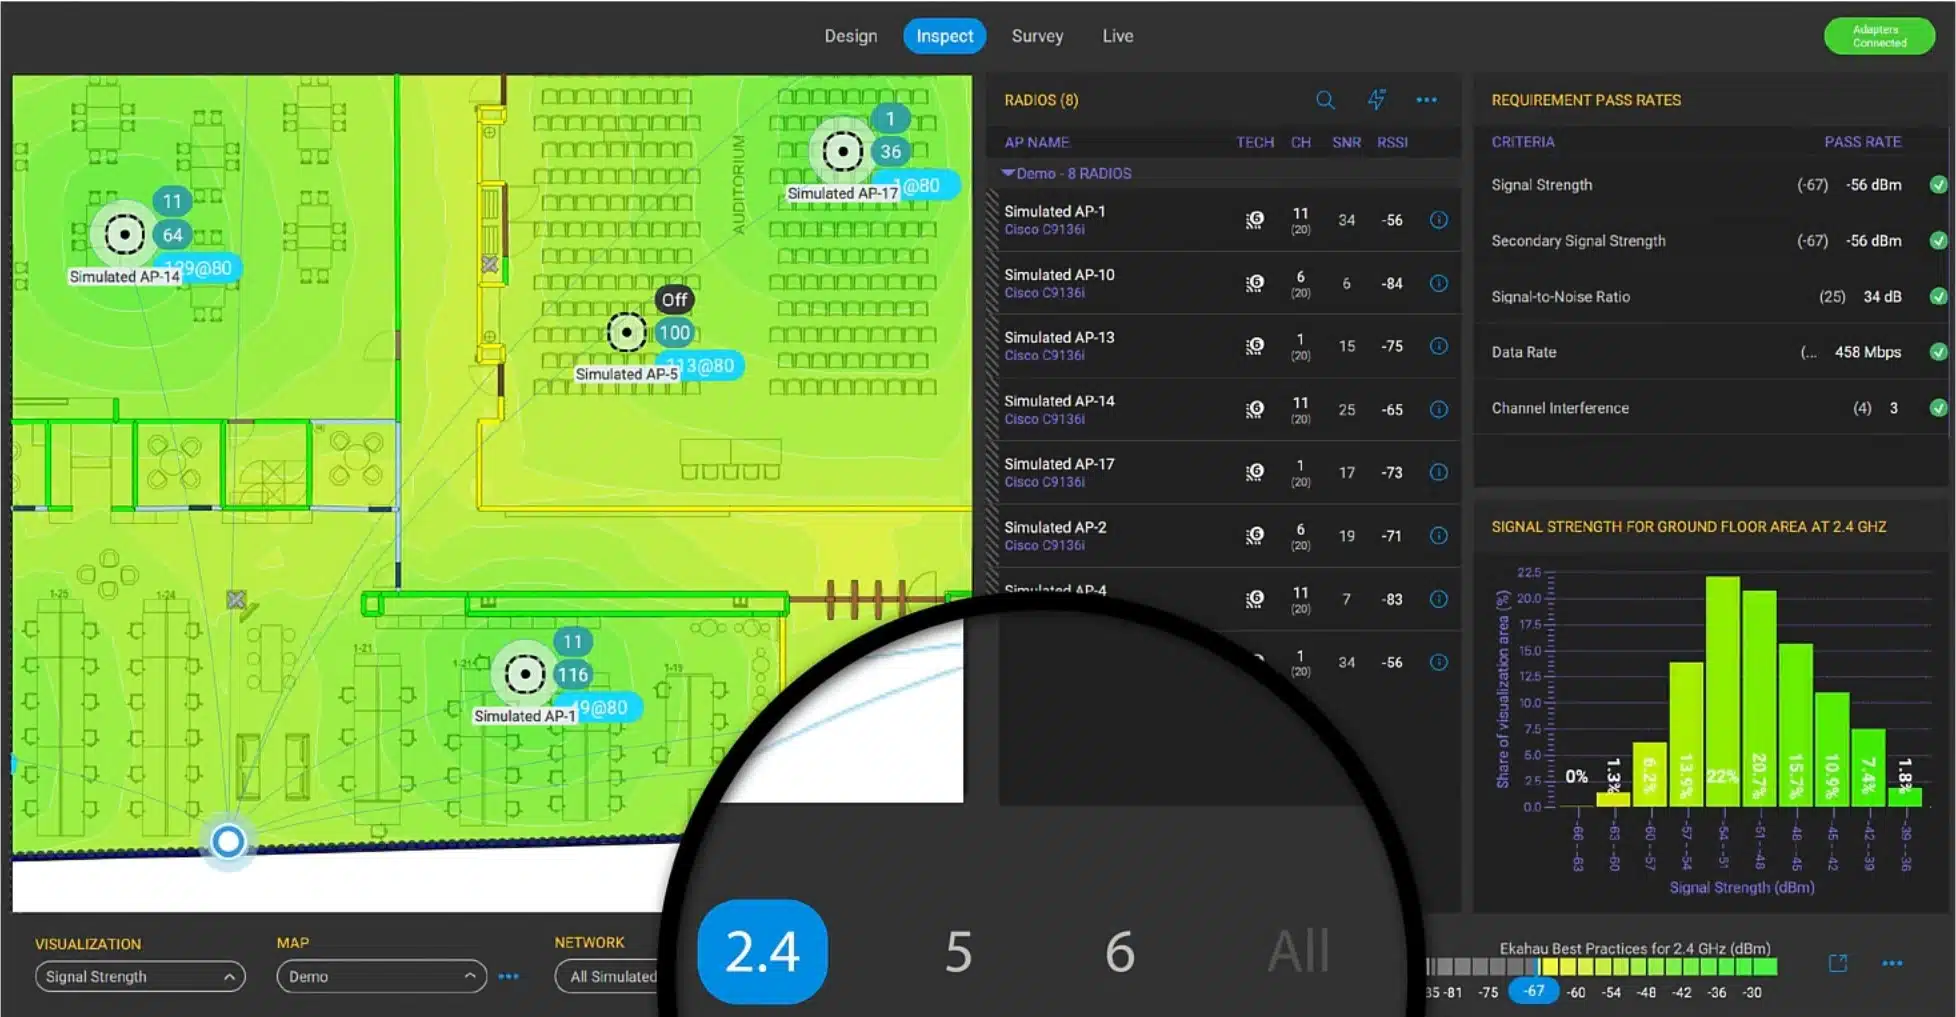
Ekahau AI Pro is a high-concept wireless network planning concept that is probably most suitable for use by consultancies and large organizations that have a specialized division for wireless network installation.
Key Features
- AI-Assisted: Ekahau AI Pro is equipped with AI capabilities, which leverages advanced algorithms and machine learning to enhance its functionality.
- AP Location Recommendations: Provides recommendations for Access Point (AP) locations, assisting users in optimizing the placement of wireless access points for optimal signal coverage.
- Floor Plan Overlay: Ekahau AI Pro supports floor plan overlay, allowing users to visualize and plan the deployment of wireless networks on a floor plan.
- Adjusts Signal Predictions According to Area Contents and Materials: This feature enhances the accuracy of signal predictions in real-world scenarios.
Unique feature
Ekahau AI Pro is a unique product on this list because it is intended for use in planning wireless networks rather than just detecting existing systems and mapping them. This service enables you to trial layout and can even adjust predictions on signal footprints according to the types of materials used in construction and the placement of furniture within office spaces.
Why do we recommend it?
Ekahau AI Pro is a design tool that uses AI to predict the likely results of different positions for APs. This is a very good system for planning but it is probably a little over-engineered for day-to-day network monitoring.
This system includes a designer, called AI Auto-Planner, that takes the floorplan of your location and allows you to place APs on the layout, identifying how the signals will spread to all workstations. Fine-tune your plan by entering more details. For example, the Ekahau system will adjust its predictions on signal strength according to furniture placement and wall and flooring material.
Implement your plan and then check on the results with a live signal footprint display.
The Ekahau system produces signal predictions, based on AI processes. This lets you avoid signal clashes and gaps. The system will adjust its recommendations according to the type of equipment that you intend to install – specifically the frequency deployed by your APs.
The tool is also good for examining the effects of a network upgrade – more powerful APs will need to be spaced out to avoid signal clashes. You can also adjust recommendations to block signals from leaking to places that you don’t want them to be available.
Once your network is live, you can collect signal performance data through the Ekahau tool, examining signal strength and quality and spotting sources of interference.
Who is it recommended for?
Two aspects of Ekahau AI Pro direct it to a specific market – system engineering consultancy. The first of these attributes is that it is intended for use before any APs have been placed and the second is that it is very expensive. Only a consultancy that would use this tool for work on many client projects could get value for money out of this system.
Pros:
- Predicts Signal Footprints: The tool is capable of predicting signal footprints before the actual implementation. This facilitates the planning and optimization of network coverage.
- Asses Impact of AP Upgrades: Provides a testing environment for assessing the impact of AP upgrades on network performance before full deployment.
Cons:
- Not the Cheapest Tool in This List: While it may offer advanced features, users should be mindful of the associated cost when considering it for deployment.
Ekahau is not a free tool, in fact, it costs a lot. You are looking at $5,995 for Ekahau AI Pro. A mobile device-resident version, called Ekahau Sidekick is available for $3,295. A pack of both tools, called Ekahau Connect costs $9,290. You can request a demo to see the Ekahau system in action.
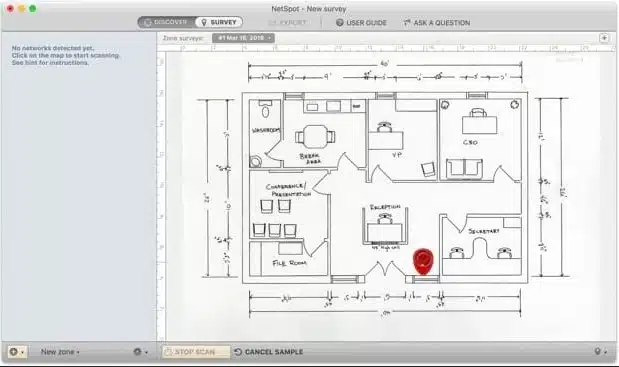
3. NetSpot WiFi Heatmaps
Tested on: Windows, MacOS
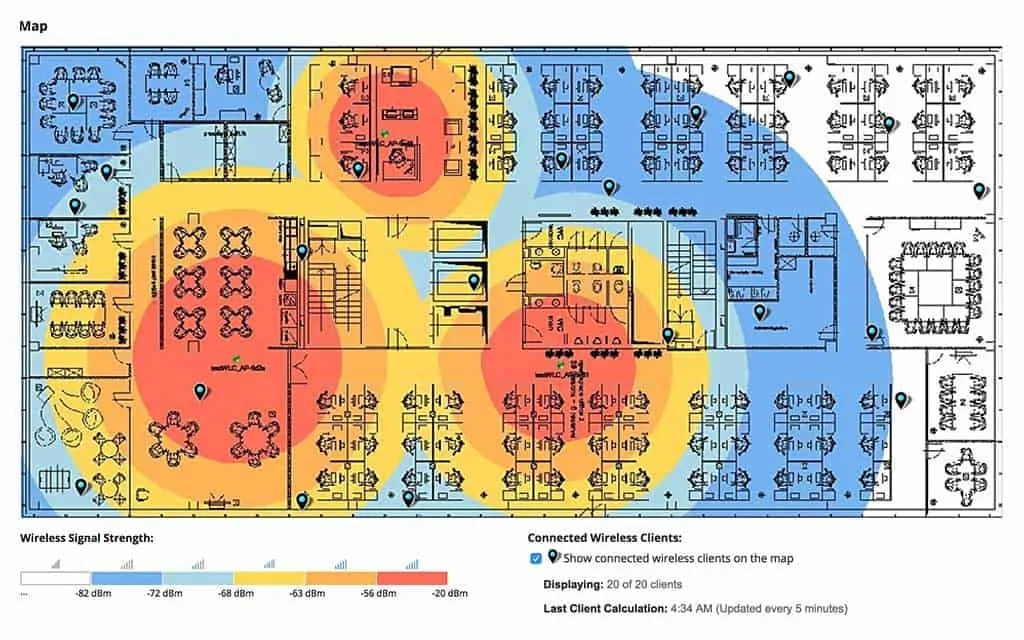
NetSpot offers a comprehensive wireless site survey, WiFi analysis, and troubleshooting heatmap application. It is designed for a wide variety of scenarios – from small home WiFi installations to large-scale wireless deployments in a corporate setting.
Key Features
- Plots onto a Floor Plan or a Map: Allows users to plot WiFi data onto a floor plan or map, providing a visual representation of the wireless network coverage.
- Detailed Signal Analysis: Provides detailed signal analysis, allowing users to assess the strength and quality of WiFi signals in different areas.
- Color-Coded Display: Uses a color-coded display, making it easier for users to interpret and understand the varying signal strengths on the visual representation.
Unique feature
The NetSpot system has excellent signal analysis features that the other tools on this list lack. While the heatmap concept provides signal strength and extent, it doesn’t cover the interference issue as thoroughly as the supporting service in NetSpot. You get a heatmap with this tool as well, but with NetSpot, that image acts as a starting point.
Why do we recommend it?
NetSpot can give you a quick superficial display of signal footprint and then it provides some very detailed information about signals that go right down to the scientific level. Look at signals, identify channels and track the traffic of individual devices.
The NetSpot tool has the ability to run on multiple operating systems including Mac OS X as well as Windows 7, 8, 10, and 11.
During our testing we found it is pretty straightforward: simply upload a site plan or area layout, indicate the starting point on the plan, and the tool begins to register and map the WiFi coverage and signal strengths.
The result is recorded on heatmaps that look professional and are highly informative.
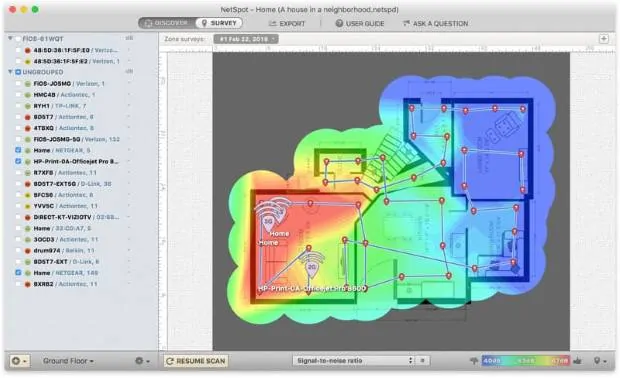
The tool can register a signal-to-interference ratio to show interference from other radio transmitters.
The Wireless Transmit rate shows the speed of data transfer from an AP to a wireless device.
On a Mac device, the Signal-to-Noise Ratio (SNR) compares the level of WiFi signal to the background noise level – the amount of outside interference determined at each measuring point.
It can monitor issues with SNR visualization, which helps determine the spots with low SNR levels and that can affect network connectivity. After all the information has been saved on a heatmap, it can be viewed locally on the measuring device or exported to Google Earth, for example.
Who is it recommended for?
As NetSpot is free, everyone with a wireless network should use it. The detailed analysis options take a bit of learning and probably most users will just be satisfied with the heatmap screen.
Pros:
- Highly Scalable: NetSpot is described as a scalable tool that works well for both home offices and enterprise-sized networks. This scalability makes it versatile for use in various environments.
- Multi-Platform Support: NetSpot can run on multiple operating systems, supporting both Windows and macOS. This cross-platform support enhances its compatibility and usability across different devices.
- User-Friendly Interface: NetSpot is noted for its user-friendly interface. It doesn’t require extensive training to use and is self-explanatory for new users, making it accessible for a broad range of users.
Cons:
- Lacks Some Device Management Features: One noted limitation is that it lacks some device management features seen in competitor products.
Download NetSpot for free (premium versions also available).
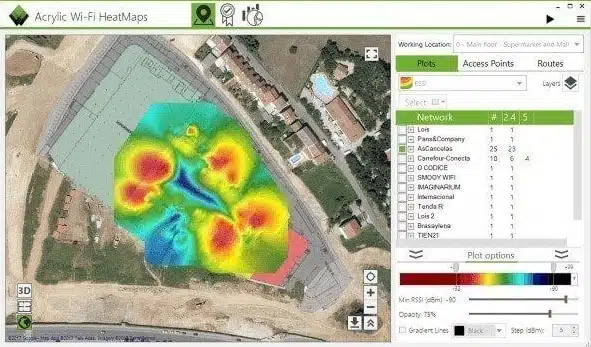
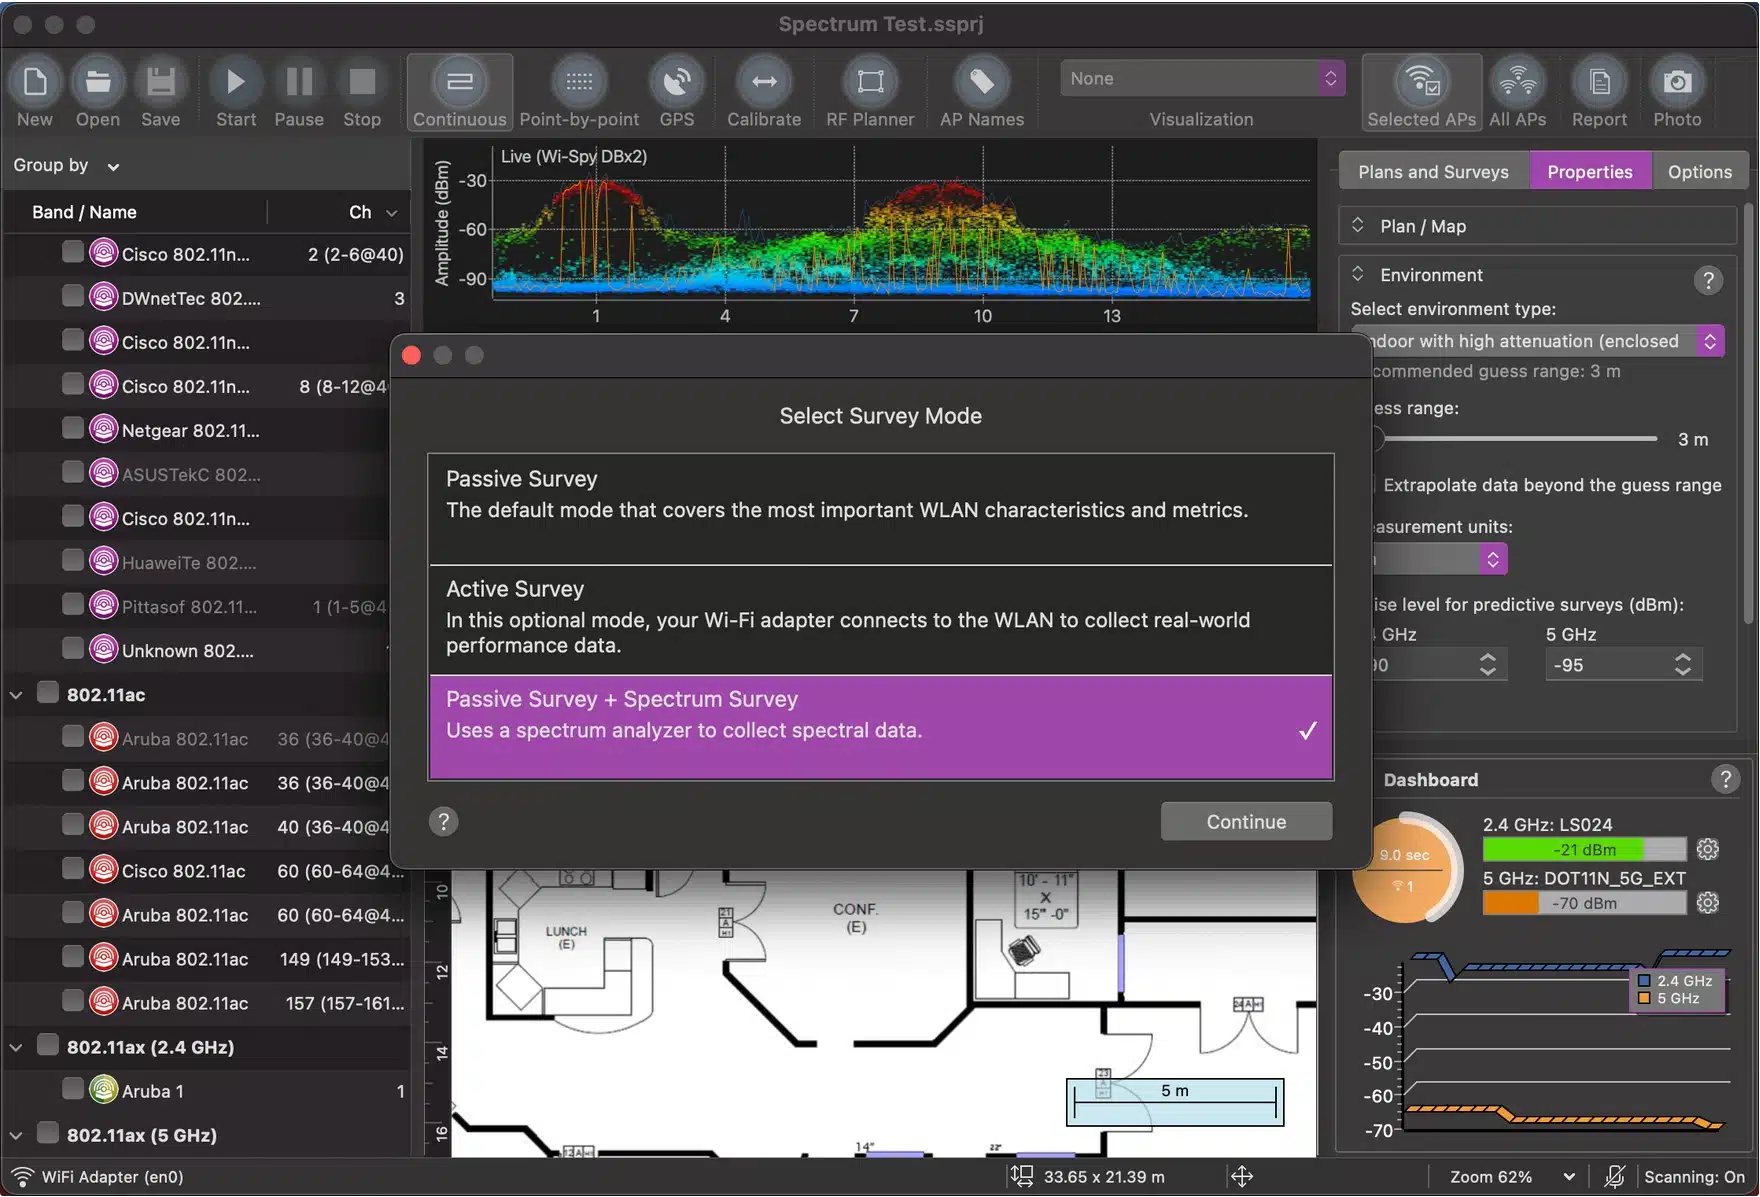
4. Acrylic Wi-Fi Heatmaps
Tested on: Windows
Acrylic Wi-Fi comes to us with a complete suite of WiFi analysis tools – including a heatmap tool – that is designed for Small-to-Medium Businesses (SMBs).
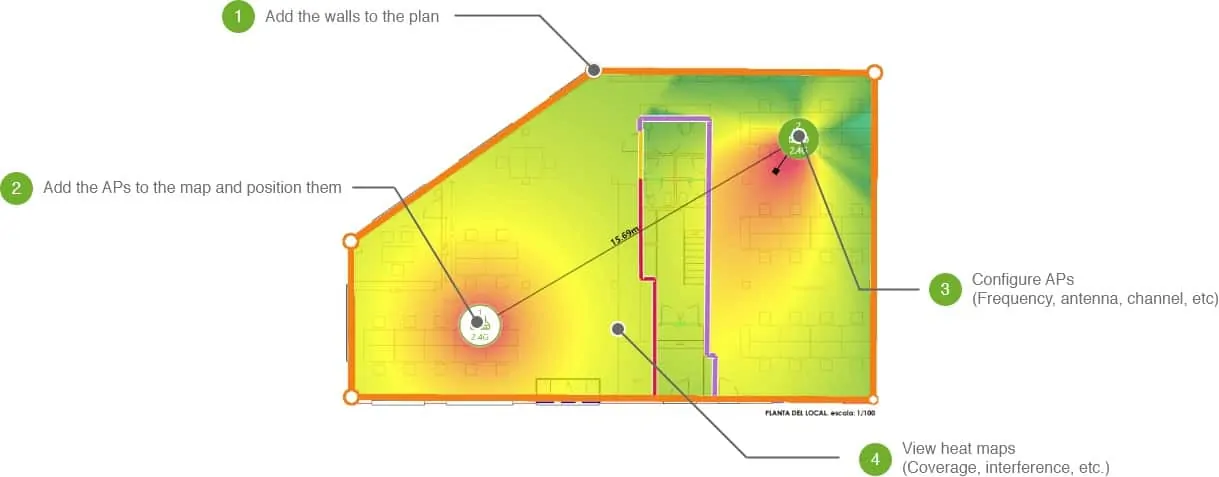
This tool can be used to design and plan a new WiFi network; it identifies the best locations for APs and recommends the orientation of their antennas for optimal coverage of premises. As a site surveying and WiFi planning tool, it is designed to provide WiFi coverage mapping and RF analysis.
Key Features
- Plots onto a Floor Plan: Acrylic Wi-Fi Heatmaps enables users to plot Wi-Fi data onto a floor plan, providing a visual representation of the wireless network coverage within a physical space.
- Color-Coded Signal Strength: Utilizes a color-coded system to display signal strength, allowing users to easily identify areas with strong or weak Wi-Fi signals.
- Estimates the Effects of Changing the Room Layout: Acrylic has the capability to estimate the effects of changing the room layout, providing insights into how modifications may impact the Wi-Fi coverage.
Unique feature
Acrylic Wi-Fi Heatmaps gives Ekahau a run for its money because it can be used to plan new wireless networks and will even take building materials into account. This system will also identify existing network signals, let you examine channels, and examine performance issues. It does all of this without the AI capacity of Ekahau but its price is less than 10 percent of that charged by Ekahau.
Why do we recommend it?
Acrylic Wi-Fi Heatmaps are the real deal. They give you the classic color-coded signal overlaid on a floorplan of your offices (which you have to feed in). As well as signal strength, Acrylic provides traffic analysis and noise ratio statistics.
It was able to analyze both 2.4GHz and 5GHz frequency bands on testing and supports active and passive site surveying.
It does not require expensive hardware as it can run on most PCs that have a network card. It is also easy to use and allows for heatmaps to be exported to different formats and even to maps that allow for blueprints to be edited online.
Administrators can draw walls and building elements as they design their premises maps and even add multiple materials to make it as real-life as possible to simulate their expansion or new installation plans.
The tool can be combined with GPS to cover larger premises; the area surveying that is done using this method can be accurately represented on a map – administrators can even generate 3D heat maps.
They can obtain a complete inventory of the analyzed devices, which are plotted in detailed, editable reports; the heatmaps can be exported to Word and CSV formats, and even Google Earth.
Who is it recommended for?
While not free, and so not as accessible as NetSpot, Acrylic is a great tool for consultants. The system runs on Windows and so isn’t a roaming tool like ManageEngine WiFi Monitor Plus. However, the endpoint-based configuration means that you don’t have to visit a site in order to analyze its wireless system.
Pros:
- Designed for SMBs: Acrylic is designed with a focus on small to medium-sized businesses, making it user-friendly and accessible for less experienced users.
- Optimal Access Point Placement: The tool automatically identifies the best places for AP placement, simplifying the process of optimizing the Wi-Fi network for better coverage.
- Ease of Drawing: Users can easily draw walls, rooms, and specify building materials within the tool. This enhances the accuracy of the heatmap by allowing users to input the physical characteristics of the environment.
Cons:
- Lacks Mobile App: Acrylic Wi-Fi Heatmaps lacks a mobile app, potentially limiting flexibility and real-time monitoring capabilities for users who prefer mobile access.
- Not Designed for Enterprise Use: Organizations with larger and more complex networks may find that it lacks certain advanced features necessary for enterprise-level deployments.
Download a 15-day free trial.
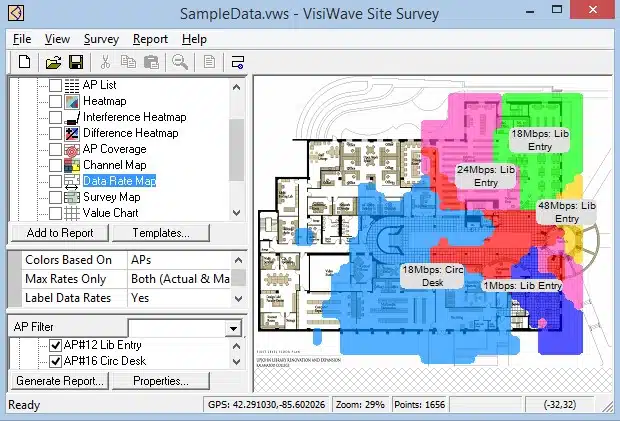
5. VisiWave Site Survey
Tested on: Windows
VisiWave is a complete WiFi network survey solution that can also be run on any Windows laptop that has a wireless network adapter. During testing it captured the WiFi data one point at a time, by scanning around an entire survey area or with the help of GPS positioning.
Key Features
- Shows Current Signal Footprints: Allows users to view current signal footprints, providing real-time insights into the strength and coverage of Wi-Fi signals.
- Overlays on a Floor Plan: Supports the overlay of Wi-Fi data on a floor plan, enabling users to visualize and plan the deployment of wireless networks within a physical space.
- Predicts Signals in Planning Scenarios: VisiWave includes the capability to predict Wi-Fi signals in planning scenarios, helping users optimize their network layouts.
Unique feature
The 3-D view or a floor plan is a nice feature of the VisiWave Site Survey heatmaps.
Why do we recommend it?
VisiWave Site Survey is available in many editions. The basic edition just gives you signal detection from the Pro edition up, you also get predictive capabilities for use in planning a network.
VisiWave Site Survey has a comprehensive reporting system that is highly customizable; administrators can also use a template or generate a heatmap. All heatmaps can be exported to Google Earth – it has simple location tracking that is triggered by clicking on a floor plan image.
It can be used in any network setting: in businesses, warehouses, cyber cafes, on campuses, and even city-wide hotspot installations.
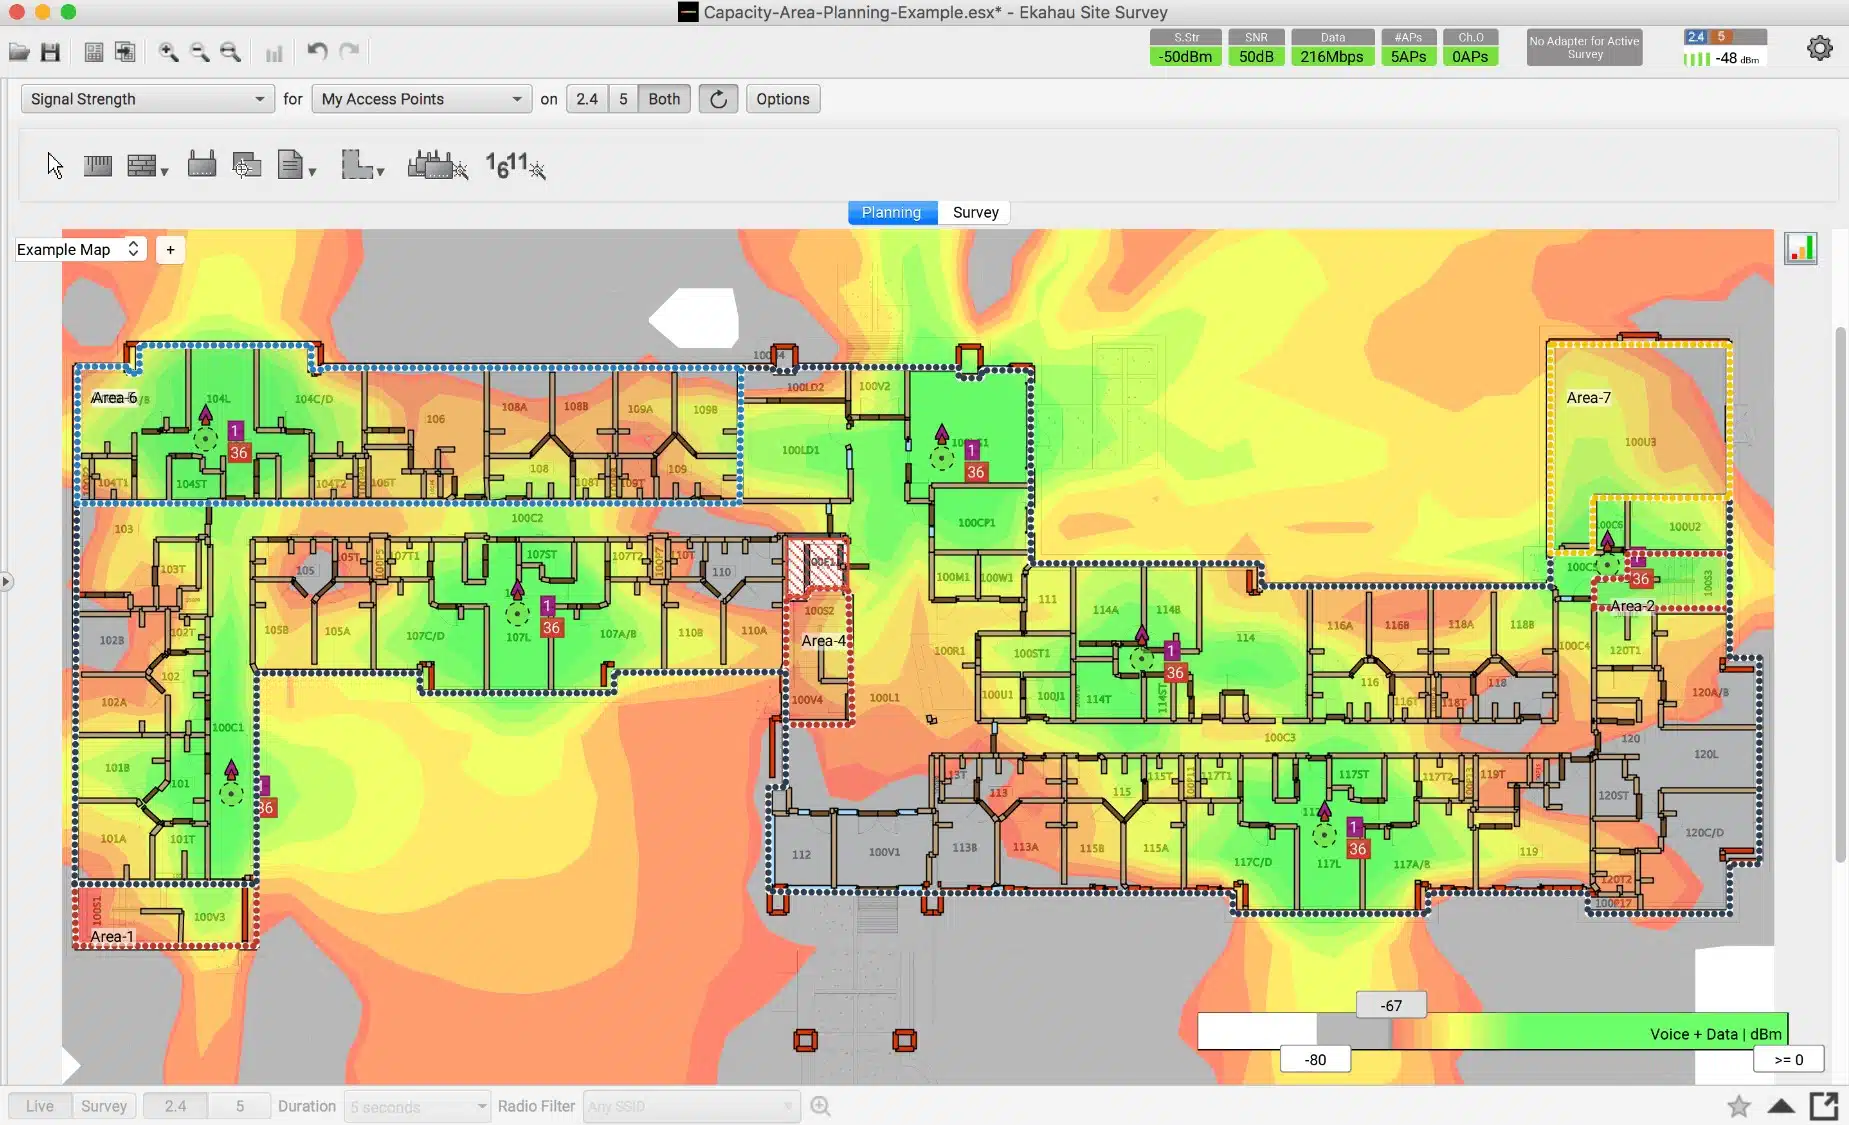
VisiWave Site Survey Pro can perform predictive site surveys – administrators can simply add barriers like walls and other solid objects in a survey area along with the location and characteristics of one or more APs and then run a theoretical simulation of how radio waves would propagate throughout the premises.
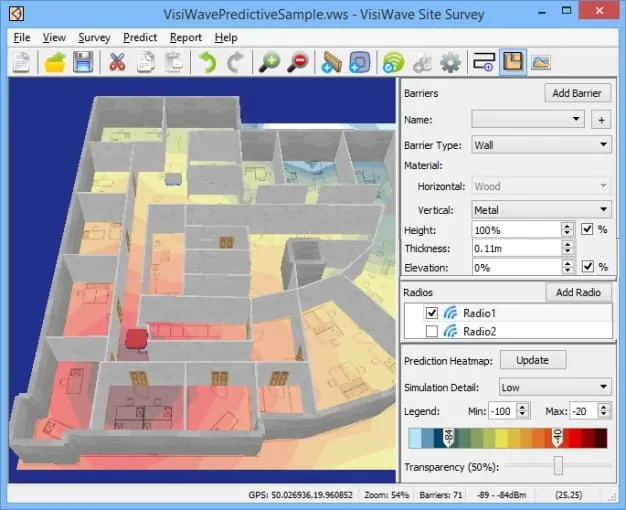
The result is a predictive WiFi coverage heatmap that estimates signal strengths; this simulation can be done at a desk – long before the survey area even exists in the real world.
It is a relatively affordable product. But, what is even more appealing is that it can be further enhanced by combining it with other third-party tools. For example, VisiWave Site Survey supports Wi-Spy Spectrum Analyzer, a USB 1.1 device, to continuously monitor 2.4GHz or 5GHz radio spectrums and report on any radio transmissions or interference sources that occur in this range. VisiWave records this information and associates it with a location on a survey map image to create detailed interference graphs on top of the wireless coverage maps.
Also, VisiWave Traffic, a separate, standalone product, allows us to easily see how wireless packets work together to create a WiFi network. Administrators can analyze WiFi traffic, see data flow patterns, and examine packet details.
Who is it recommended for?
The different editions of the VisiWave system mean that it caters to different audiences. The signal detection system is good for network administrators and the predictive service is a tool for network engineers and consultants.
Pros:
- 3D Visualization: One of the notable advantages is the provision of a 3D visualization, offering a more immersive and detailed representation of WiFi heat mapping.
- Supports Both GPS Positioning and Network Card Capture Mapping: This provides flexibility in data collection methods for creating accurate heatmaps.
- Works Well with Other Network Mapping Tools: This interoperability can be beneficial for users who require additional functionalities beyond what VisiWave Site Survey offers.
Cons:
- Only Runs on Windows: This potentially excludes users who operate on other platforms.
- Must Be Used with Other Programs: Continuous monitoring features are not directly provided by VisiWave Site Survey, and users may need to use other programs to fulfill this requirement.
Download an evaluation version of the VisiWave Site Survey.
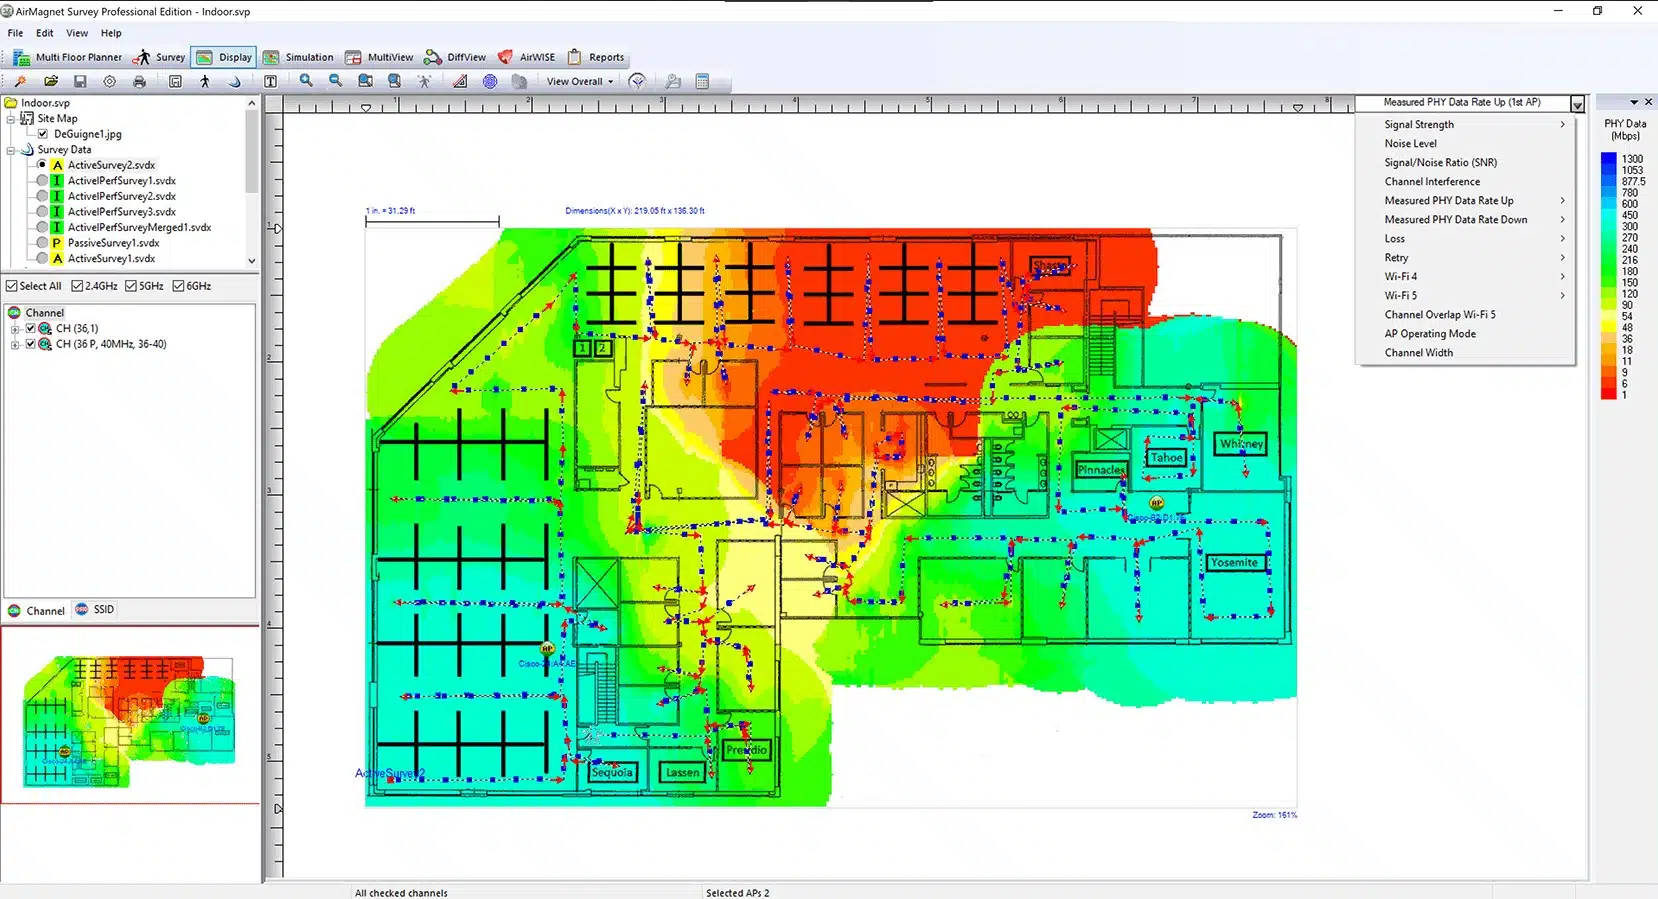
6. AirMagnet Survey PRO
Tested on: Windows, MacOS
NetAlly is the maker of network troubleshooting and monitoring tools. Its AirMagnet Survey PRO is one such tool that was made for large networks and can be used to create heatmaps, plan for capacity, design WLANs, and improve network security.
Key Features
- Shows AP Signals on a Floor Plan: Displays Access Point signals on a floor plan, providing a visual representation of the Wi-Fi signal coverage within a given space.
- Recommends Transceiver Relocation: AirMagnet offers recommendations for the relocation of transceivers, assisting users in optimizing the placement of wireless devices for improved signal strength.
- Simulates New Layouts and Signals: It has the capability to simulate new layouts and signals, allowing users to plan and predict the impact of changes to the wireless network environment.
Unique feature
AirMagnet Survey PRO can be run on a PC or Windows laptop or it can be used in conjunction with one of the hand-held scanners produced by netAlly.
Why do we recommend it?
The AirMagnet Survey PRO system provides signal footprints of existing wireless networks and it can also be used to plan the position of APs either for completely new implementations or to adjust an existing installation. By combining this tool with a hand-held scanner, you can walk around the building and gather a complete image of all wireless APS in your building.
AirMagnet Survey Pro maps out network performance by gathering data on bandwidth, network throughput, and packet losses which the tool then uses to create WiFi heatmaps as well as displaying other relevant performance measurements. It can also be used to create signal strength, noise, and SNR coverage heatmaps.

A simulation feature allows for the optimal positioning of APs – administrators can compare different WiFi configurations in real-time before real-world actions need to be taken.
AirMagnet Survey’s simultaneous multiple surveying capability leverages multiple adapters plugged into the same PC, for example, so users can perform active and passive surveys together, across multiple spectrum bands (like a 2.4 GHz and 5 GHz survey).
While testing we found that this tool goes beyond just verifying RF coverage – it plotted actual end-user network performances in terms of Throughput and PHY (Physical Layer) data rates, taking MIMO, and other network characteristics and configurations into consideration.
Reports could be generated using customizable templates that allowed for the creation of insightful, informative data presentation.
Who is it recommended for?
This tool is good for network engineers and consultants. However, netAlly doesn’t publish a price list, so it is difficult to know whether the AirMagnet Survey would be a reasonable competitor to the other site survey tools on this list.
Pros:
- Enterprise-Scale Deployments: AirMagnet is specifically designed to support larger networks, making it suitable for enterprise-scale deployments.
- Capacity Planning: The tool includes capacity planning tools, providing valuable resources for enterprise network administrators to optimize network performance and scalability.
- Calculates User Network Performance Metrics in Simulations: This helps correlate the heatmap with potential downtime scenarios and provides a more comprehensive analysis.
Cons:
- Not Available for Linux: This potentially limits its usability for users on Linux operating systems.
- No Free Trial: The absence of a free trial means that users must manually request a demo version to explore the capabilities of the software.
There are versions for Microsoft Windows 7, 8, and 10 or MacOS. Request a free demo of AirMagnet Survey Pro.
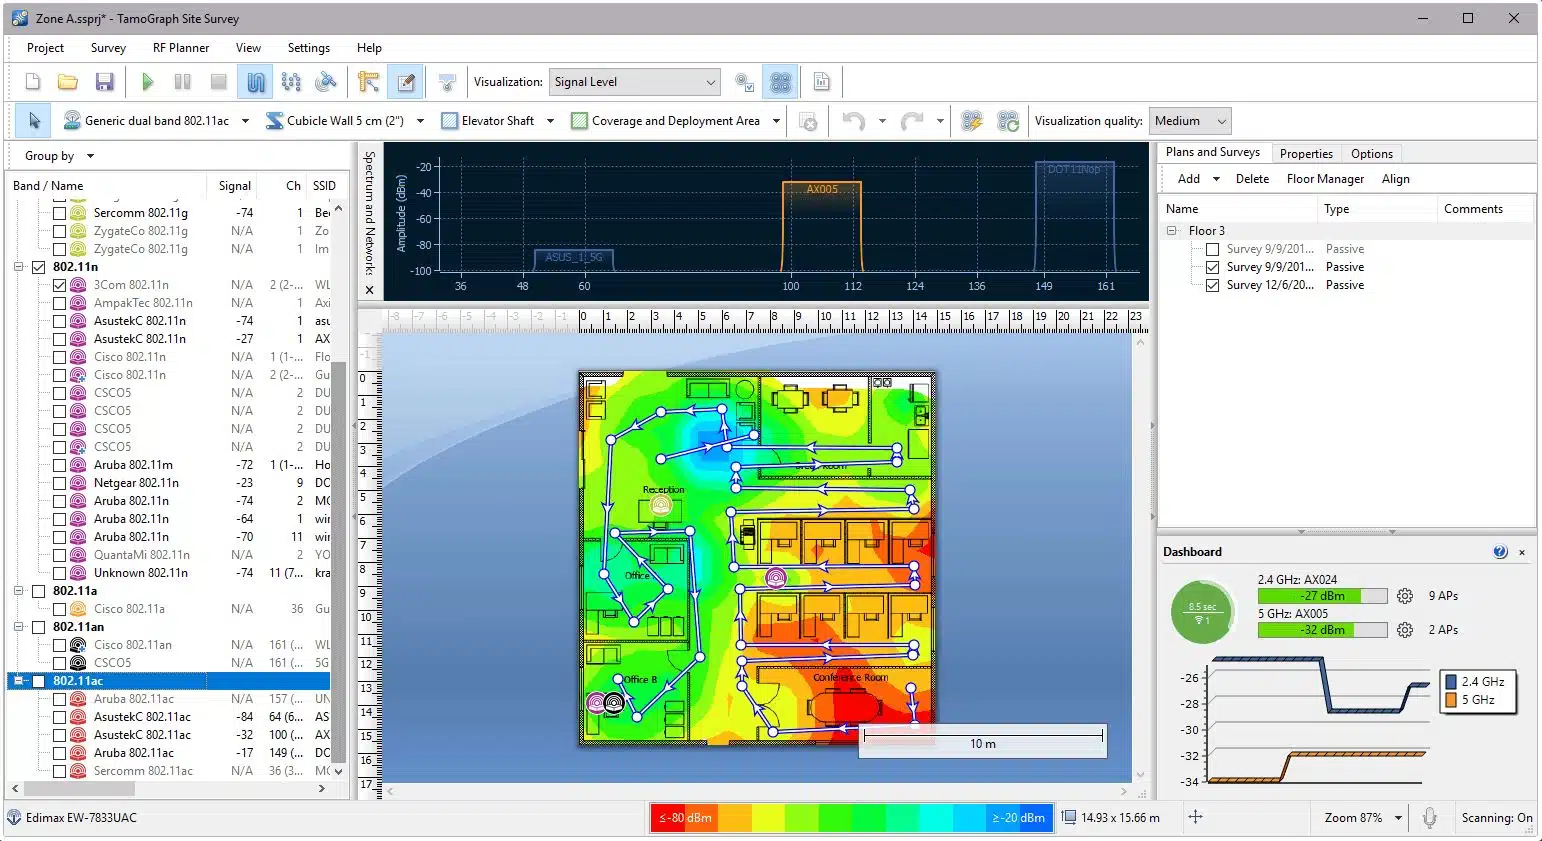
7. TamoGraph Site Survey
Tested on: Windows, MacOS
TamoGraph Site Survey provides signal scanning for all the 802.11 specifications – a, b, g, n, ac, and ax. This tool is also able to predict where WiFi Access Points should be located in a new building, so you can start using this wireless heat mapper even before you have any WiFi systems in place. The heatmap view is just one of the signal detection and representation utilities in this package.
Key Features
- Wireless System Planning: TamoGraph provides tools for wireless system planning, allowing users to strategically design and optimize their wireless networks.
- Color-Coded Live Signal Map: Features a color-coded live signal map, offering a visual representation of signal strength variations across different areas.
- Signal Source Details: Provides detailed information about signal sources, aiding in the identification and analysis of wireless devices.
Unique feature
TamoGraph Site Survey is a strong competitor to Acrylic Wi-Fi Heatmaps and Ekahau AI Pro service. This is another expensive tool, so it would probably only offer value for money to consultancies or large organizations. The tool has many different wireless signal assessment utilities and it will provide a heatmap of your premises after you feed in a floorplan. This tool can be used to plan deployment, to verify full coverage, and to watch over day-to-day operations to identify interference.
Why do we recommend it?
TamoGraph Site Survey has a lot of features but at its core is a very easy-to-understand heatmap. This shows you immediately where there are blackspots in your wireless coverage and it will also identify signals coming in from neighboring properties.
A nice feature of TamoGraph is that it can also identify signals outside your offices by accessing GPS information. This gives you the opportunity to create a WiFi heatmap for a campus or a community.
Once you have all of your wireless Access Points in operation, the console for TamoGraph provides an asset inventory that gives you details on the make, model, and specifications of each device.
The survey can also be used to see all channels available from each AP and an assessment of utilization and capacity.
The TamoGraph system can produce detailed reports on demand, which can be extracted in PDF, HTML, or ODT format.
This system provides a very busy console, which looks impressive but the heatmap will probably be the main tool that most administrators refer to.
Who do we recommend it for?
The TamoGraph Site Survey system is not free, so it won’t appeal to small businesses. It is available only for Windows and MacOS, so system administrators that like to walk around a site won’t want to use this tool. However, it can operate across a network, which means that it can also be used over the internet to survey remote sites, so centralized IT data centers and managed service providers (MSPs) would be able to use this tool.
Pros:
- Covers All Versions of 802.11: Supports all versions of the 802.11 wireless standard, ensuring compatibility with a wide range of devices and network configurations.
- Wireless Deployment Planning: The tool is versatile and can be used to plan a full wireless deployment, providing comprehensive insights for designing and optimizing wireless networks.
- Easy-to-Follow Color-Coded Heatmap: The color-coded heatmap simplifies the interpretation of signal strength data, making it easy for users to identify areas with strong or weak signals.
Cons:
- Not Available for Mobile Devices: This could be a drawback for users who prefer or require mobile solutions for site surveys.
Access a 30-day evaluation version.
Choosing WiFi heatmap software
Finally, let’s talk about what to look for when choosing the best WiFi heatmap software for a survey – and the reason these eight tools have been put on the list:
- Ease of use – the whole purpose of owning a tool is to make a task easier; heatmap software should be easy to use while being highly informative at the same time.
- Compatibility – any good tool works on as many platforms as possible while being able to monitor just as many popular WiFi routers (and related hardware) on the market.
- Features – an ideal tool should give more insights into a WiFi network – predictive analysis to help with growth and forecasting, for example – apart from simply showing how well WiFi signals are at present.
- Price – free will always be the best, but sometimes there will be that tool which is worth investing in; the tool with the best ROI always wins.
WiFi Heatmap FAQs
How do you read a wireless heat map?
A wireless heatmap is a visual display that shows the signal footprint of a wireless AP. In order to fully utilize such a service, you will need to upload a floorplan of your premises. The detector then overlays the signal footprint on that plan.
How do I check my WiFi signal strength?
Most WiFi heatmaps are color coed. The signal will be displayed as a footprint but in color. In contrast to most color-coded status systems, red usually means a good thing in a WiFi heatmap. It shows the footprint of the strongest signal. The heatmap software should display a key that explains the meaning of each color in the view.
For more information, check out the best wifi signal strength applications.
Let us know about any WiFi heatmap tools you may have used and think should be on this list too. We would love to hear about them; leave us a comment below.
