
Cacti is an open-source, web-based network monitoring and graphing tool designed to monitor and visualize network traffic.
Cacti allow users to poll network devices such as switches, router interfaces, and services via Simple Network Management Protocol (SNMP) at predetermined intervals and graph the resulting data for easy visualization
Cacti is used as a front-end application for RRDTool that handles time-series data such as network bandwidth, temperatures, or CPU load. In addition, web hosting providers sometimes use it to display customers’ bandwidth statistics. The front end can handle multiple users, each with its visualization interface.
Here is our list of the best Cacti monitoring alternatives:
- SolarWinds Network Performance Monitor (NPM) (FREE TRIAL) A powerful network monitoring tool that helps organizations detect, diagnose, and resolve network performance issues. Start a 30-day free trial.
- ManageEngine OpManager An integrated network management software that provides real-time network monitoring, configuration management, and more.
- PRTG Network Monitor A mature and well-known network monitoring tool from Paessler AG, a German-based company.
- Nagios A U.S.-based company that delivers IT infrastructure monitoring and management software that enables organizations to identify and resolve problems before it gets out of hand.
- Checkmk One of the leading tools for IT infrastructure and application monitoring.
- Icinga A popular enterprise-grade open-source tool for IT infrastructure and application monitoring.
- OpenNMS Open-source network management and monitoring tool developed and managed by the OpenNMS Group and a community of developers.
- NetXMS An enterprise-grade multi-platform open-source network management and monitoring tool.
- Pandora FMS An all-in-one network monitoring tool. It uses an agentless and agent-based approach to monitor the health of IT infrastructures such as networks, servers, applications, databases, and much more.
- Observium A powerful auto-discovering network monitoring platform that provides real-time network and infrastructure monitoring.
Cacti is free to use and deployed on Windows or Linux OS. It can be used on complex networks with many network devices and users. Nevertheless, Cacti is not a one-size-fits-all solution for every organization. The fact that it fits perfectly from a feature and functionality standpoint for one organization does not mean it will fit another. In addition, Cacti, just like every other software solution, also has its challenges and imperfections.
A few examples of the Cacti challenges and imperfections include:
- Using cacti can be overwhelming and confusing for new users.
- It has a little bit of a steep learning curve to set up correctly.
- Customization can also be a tedious task at times – It requires a large number of man-hours to get it working the way you want.
If you figured out that Cacti is not best suited for your environment and you’re considering a suitable alternative, you’d find lots of them out there, from open source to the commercial level. However, you want to make sure that you get the same functionality, if not more, out of an alternative monitoring tool. To help you with the countless alternatives out there, we’ve put together a list of the best Cacti alternatives. Hopefully, this will guide you in the process of selecting the right one for your environment.
The Best Cacti Monitoring Alternatives
1. SolarWinds NPM (FREE TRIAL)
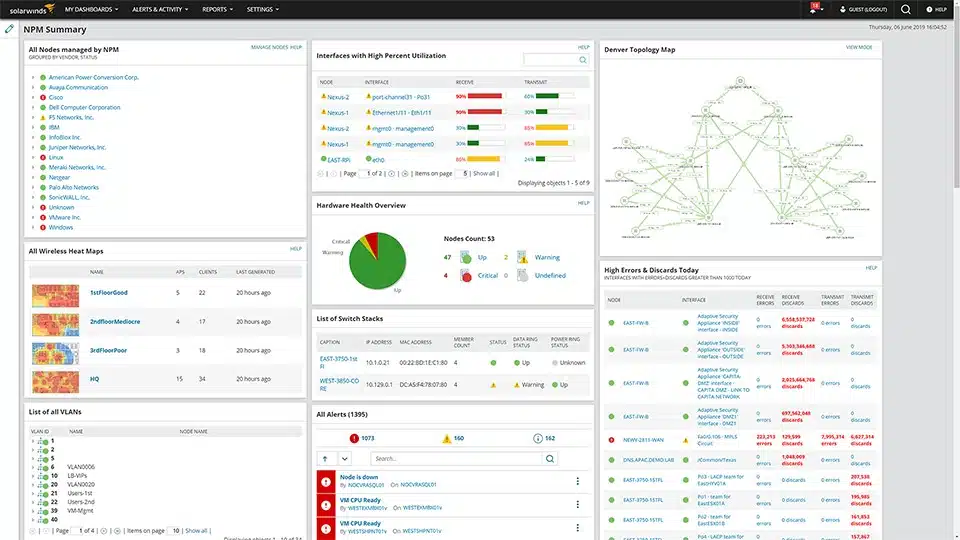
SolarWinds Network Performance Monitor (NPM) is a powerful network monitoring tool that helps organizations detect, diagnose, and resolve network performance issues. The tool is best suited for medium to large-scale enterprises. As a result, SolarWinds NPM is listed in the 2020 Gartner Peer Insights Customers’ Choice for Network Performance Monitoring and Diagnostics.
Key Features:
- Multi-vendor network monitoring
- Network Insights for deeper visibility
- Intelligent mapping
- NetPath and PerfStack for easy troubleshooting
- More innovative scalability for large environments
- Advanced alerting
- Critical path visualization
NPM can be deployed in the cloud or on-premises using Windows server 2019, 2016, or 2012 R2. The SolarWinds Orion platform is required to deploy NPM either in the cloud or on-premises. The Orion Platform is the core of all SolarWinds IT products, and it allows the NPM to work and integrate with other SolarWinds tools and software seamlessly.
The SolarWinds NPM license is based on several items to monitor or according to the most significant number of the monitored network elements. Each license tier has a stipulated maximum number of supported nodes (routers, switches, physical and virtual servers), interfaces (VLANs, ports, and interfaces), and volumes (any logical disks being monitored) to manage and monitor, as shown on the table below:
| License tier | Maximum number of monitored elements |
|---|---|
| SL100 | Up to 100 nodes, 100 interfaces, and 100 volumes (300 elements in total). |
| SL250 | Up to 250 nodes, 250 interfaces, and 250 volumes (750 elements in total). |
| SL500 | Up to 500 nodes, 500 interfaces, and 500 volumes (1500 elements in total). |
| SL2000 | Up to 2000 nodes, 2000 interfaces, and 2000 volumes (6000 elements in total). |
| SLX | Virtually unlimited number of elements |
Table 1.0 | Available license levels in NPM
One potential downside to this tool is that its capabilities come at the expense of enormous system resource requirements. This means that to get the most of this software, you need a hardware and software server that will be capable of handling all that SolarWinds NPM has to offer.
The SolarWinds Network Performance Monitor (NPM) is available for a 30-day free trial.
2. ManageEngine OpManager
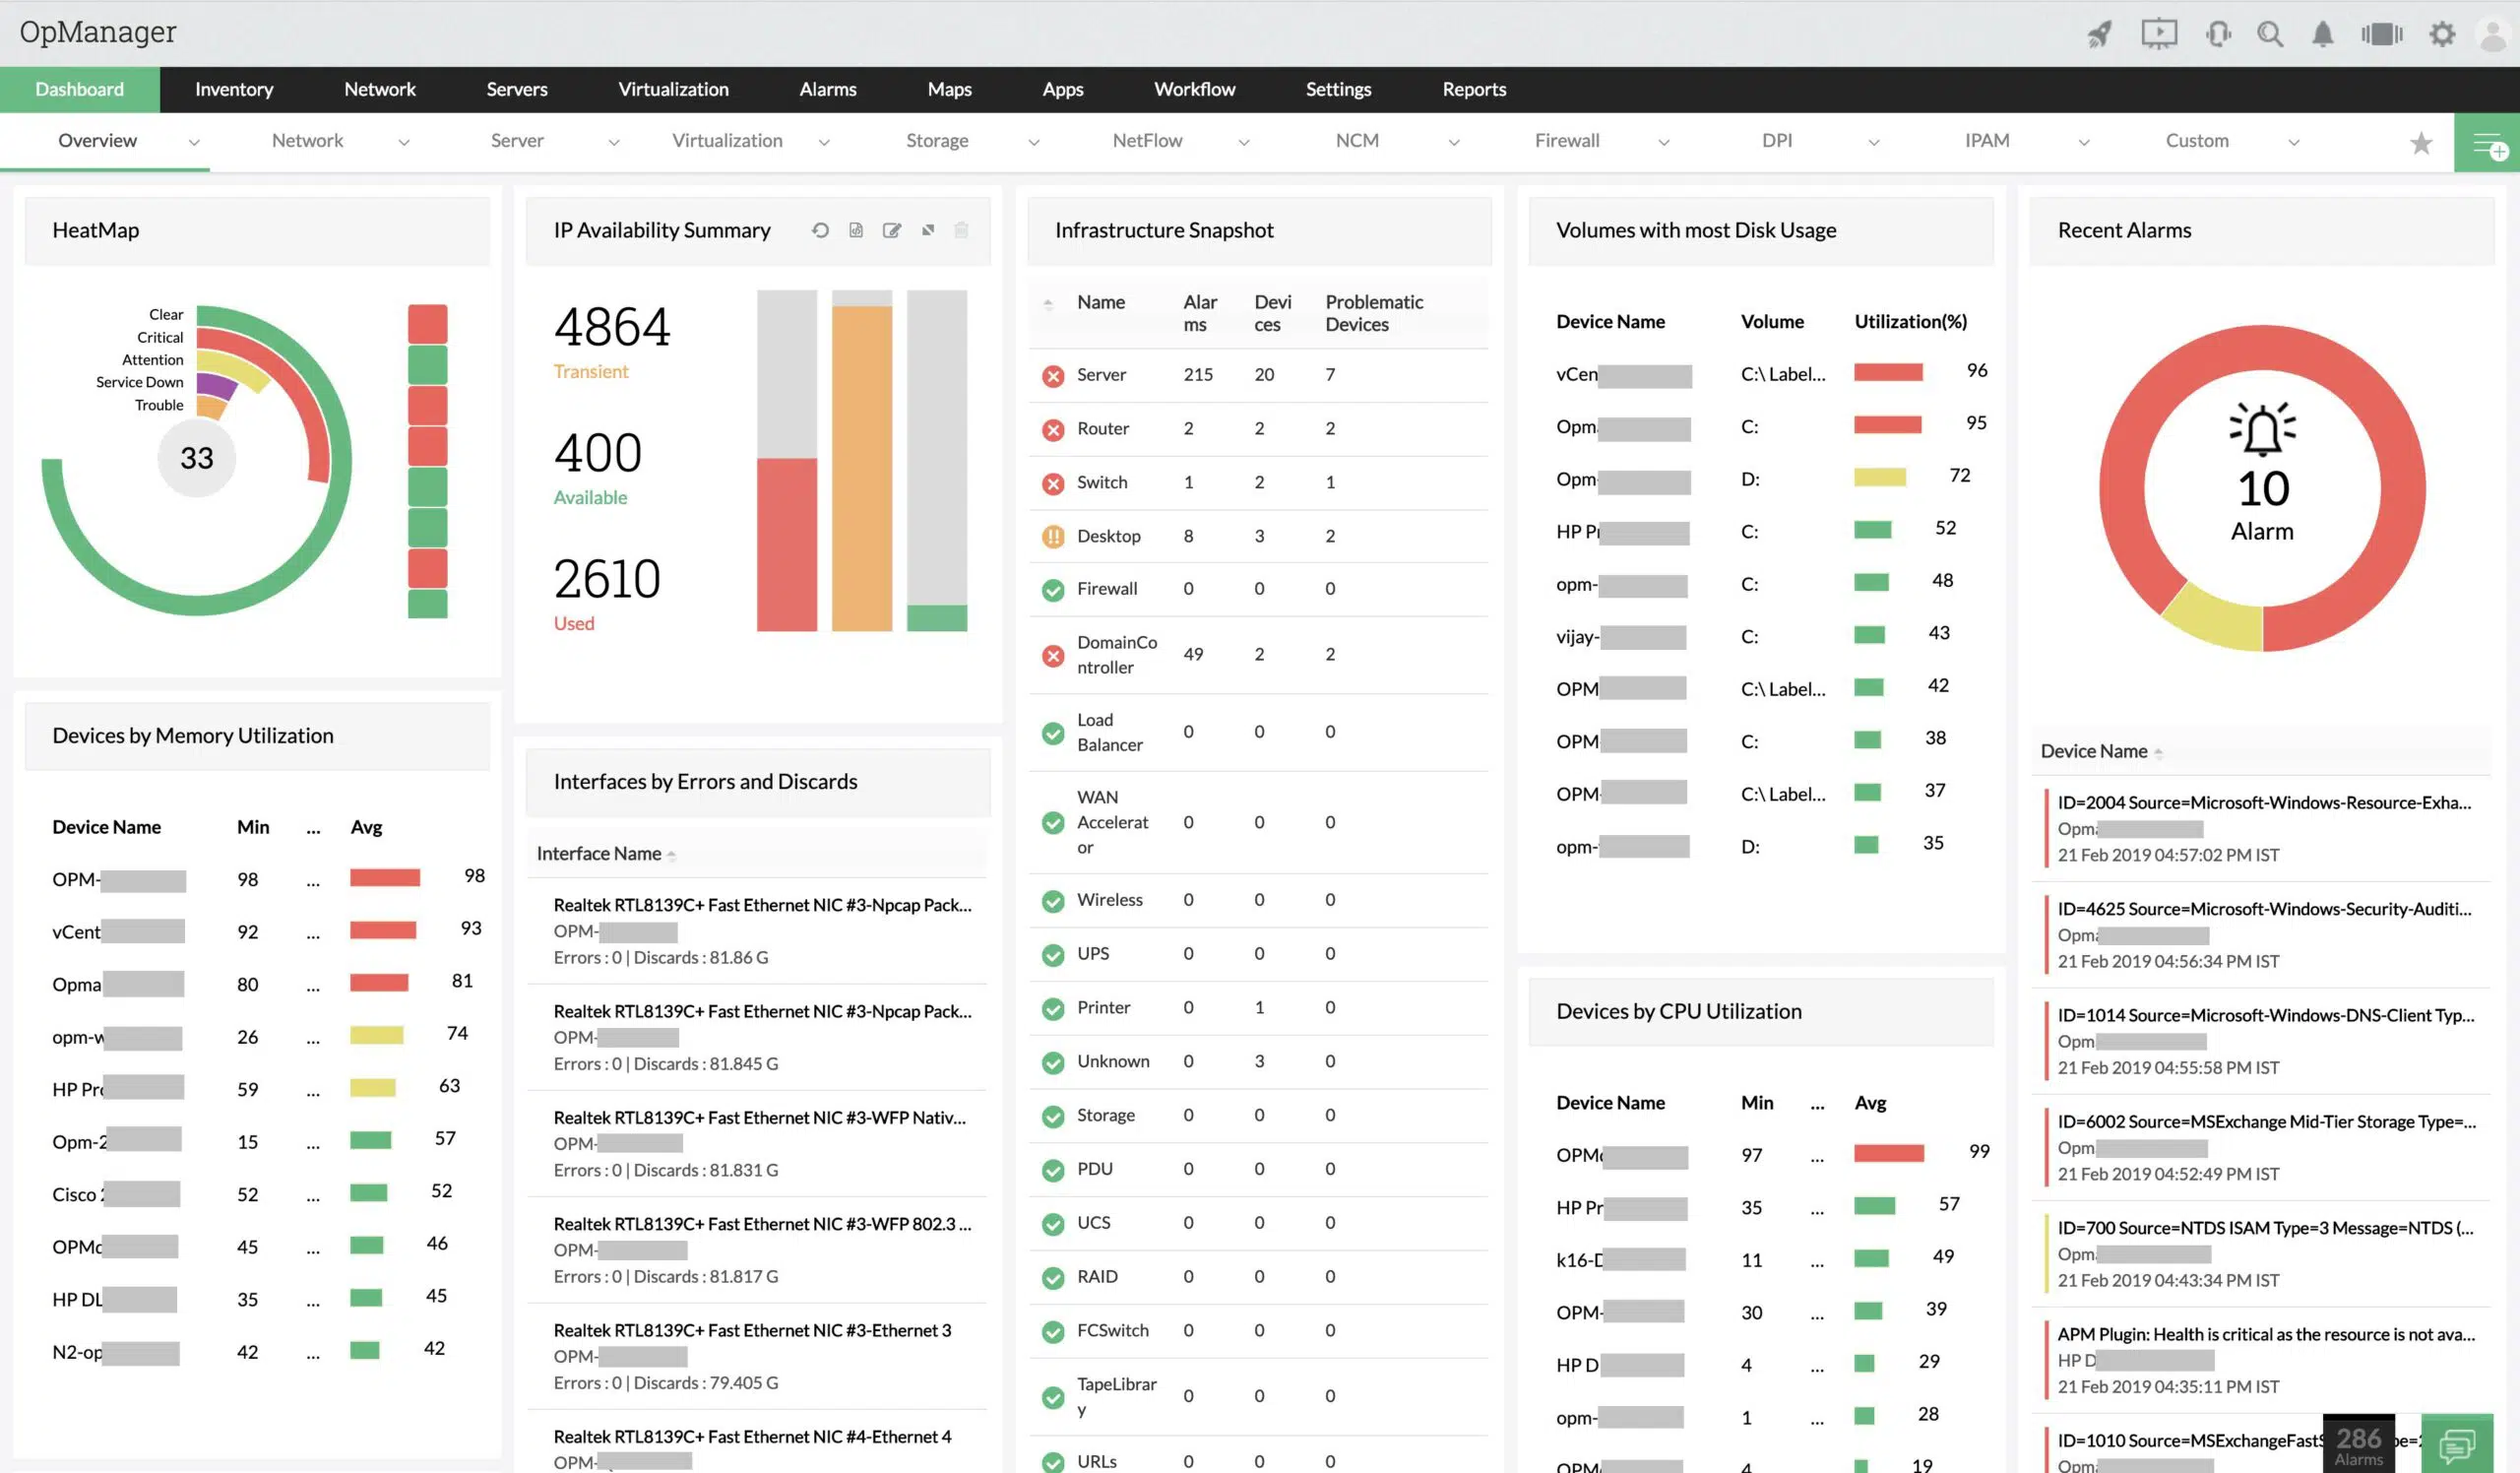
ManageEngine OpManager is an integrated network management software that provides real-time network monitoring, configuration management, and more. It monitors network devices, servers, applications, and everything connected to the network, providing visibility and helping you track and resolve outages before they occur. OpManager is supported in Windows and Linux operating systems and servers.
Key Features:
- Real-time network performance monitoring
- Physical and virtual server monitoring
- Network Performance Reporting
- Customizable dashboards
- Multi-level thresholds
- WAN Link monitoring
- Email and SMS alerting
- Easy to set up
OpManager comes in different editions which are tailored to suit your network and server monitoring requirements, as shown in Table 2.0 below:
| Features | Free | Standard | Professional | Enterprise | MSP |
|---|---|---|---|---|---|
| Targeted at | Small network | Small to medium networks | Mid to Large networks | Geographically distributed networks | MSPs managing multiple clients |
| Monitor up to | 3 devices | 1000 devices | 1000 devices | 10,000 devices | 10,000+ devices |
| Starting price | Free | $245 | $345 | $11,545 | Contact vendor |
Table 2.0 | Comparison of the different editions of OpManager
OpManager license options depend on the number of devices to be monitored. The license includes all the device’s interfaces, nodes, or sensors. A device can have any number of interfaces, elements, or sensors. You can download the free version for evaluation or check out the 30-day fully functional trial to confirm its capabilities and ensure it’s the right fit for your organization before purchase.
3. PRTG Network Monitor
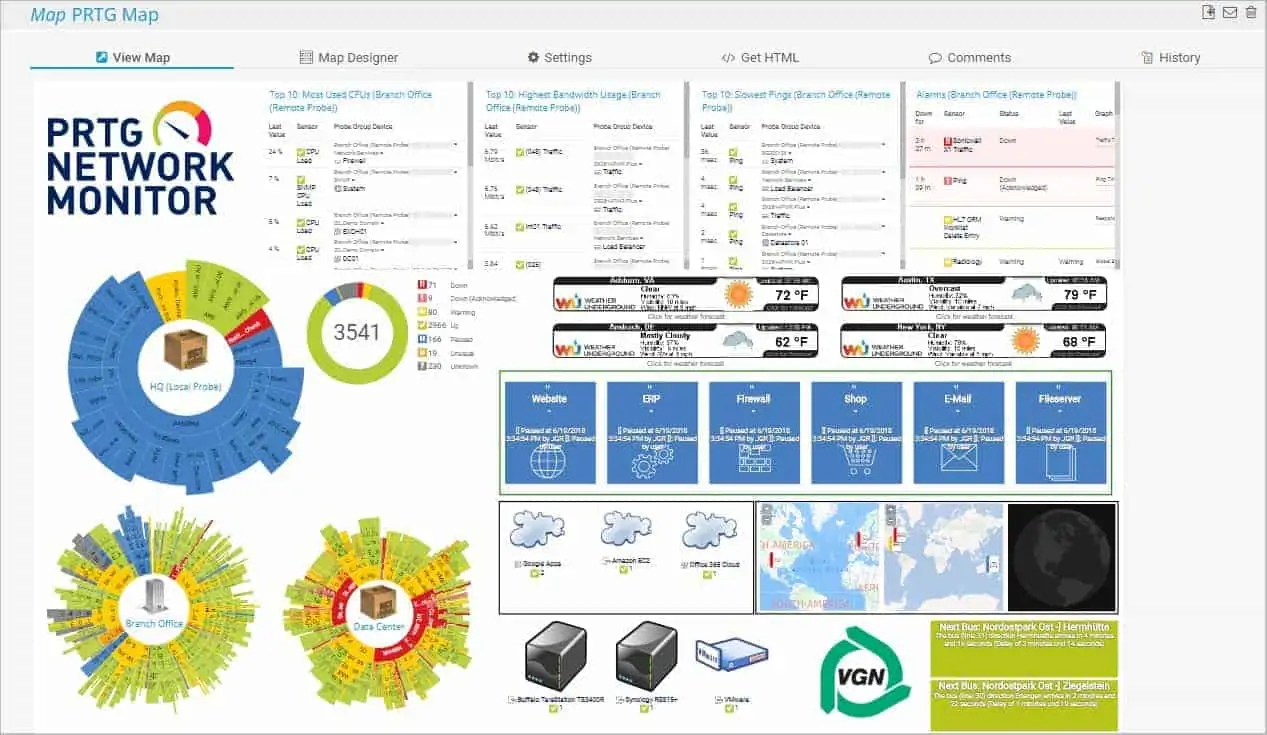
PRTG Network Monitor is a mature and well-known network monitoring tool from Paessler AG—a German-based company. Few tools provide the blend of maturity and rich capabilities that the PRTG tool offers. In addition, it comes in different editions and variants such as:
- PRTG Enterprise Monitor Targeted at large networks with thousands of devices and systems across multiple locations.
- PRTG Hosted Monitor A cloud-based option that allows you to monitor from the cloud
- PRTG Desktop Allows you to manage multiple PRTG servers.
- PRTG Mobile App Allows you to check your network, devices, and sensors while on the go.
PRTG Network Monitor is agentless—which means you do not need to install any agent on the target devices and application; instead, it uses network protocols such as SNMP, WMI, NetFlow, or SSH to carry out its monitoring functions. This way, not only is the burden lower, the monitoring is done quickly and easily.
Key Features:
- In-depth reporting Runs or schedules regular reports and gets your specific monitoring data statistics.
- Maps and dashboards Visualize your network using accurate time maps with live status information.
- Flexible alerting Supports SMS, email, push notification, and audio alarm.
- Distributed monitoring Monitors several networks in different locations.
- Cluster failover solution Allows failover tolerant monitoring.
- Multiple user interfaces Desktop, mobile, and web.
To install PRTG, you only need a Windows computer with sufficient computing power. In addition, a cloud-based option known as PRTG Hosted Monitor is also available. The PRTG licensing model is based on sensors (parameters that can be monitored on a device such as CPU load, port status, or network traffic) and includes one year of free support and maintenance. Most devices require between five and ten sensors to be thoroughly monitored.
A free 30-day trial with full access to all the features is available for download. PRTG is also known as freeware for up to 100 sensors. If you want to monitor more than 100 sensors, you will need to upgrade to a commercial version. If you don’t upgrade, the trial version automatically reverts to the free version after 30 days, and you can continue using the free version without any time limit.
4. Nagios
Nagios is a U.S-based company that delivers IT infrastructure monitoring and management software that enables organizations to identify and resolve problems before it gets out of hand. The product comes in two editions—Nagios Core and Nagios XI.
Key Features:
- Comprehensive Monitoring Monitoring of all critical infrastructure components.
- Problem Remediation Remediate failed network components, applications, and services when problems are found.
- Proactive Planning Allows you to plan for upgrades proactively.
- Multi-Tenant Capabilities Supports multi-user access and user-specific views.
- Extendable Architecture Provides integration with third-party applications via APIs and add-ons.
- Awareness Deliver alerts to IT staff, via email and SMS.
- Visibility Gain visibility into your entire IT operations.
- Reporting Up-to-date availability and historical reports, among others
Nagios Core is an agent-based free and open-source application that monitors critical IT infrastructure components such as network devices, servers, and applications, including network protocols and system metrics and resources. Some of the essential protocols of network and system resources monitored include:
- Network protocols include SMTP, POP3, HTTP, NNTP, ICMP, SNMP, FTP, SSH, and many more.
- Host resources such as processor load, disk usage, system logs, and more, using monitoring agents.
- Hardware conditions such as temperature, alarms, and more
It alerts administrators when those critical components fail and when they recover after the problem has been resolved. It runs on Linux and Windows operating systems.
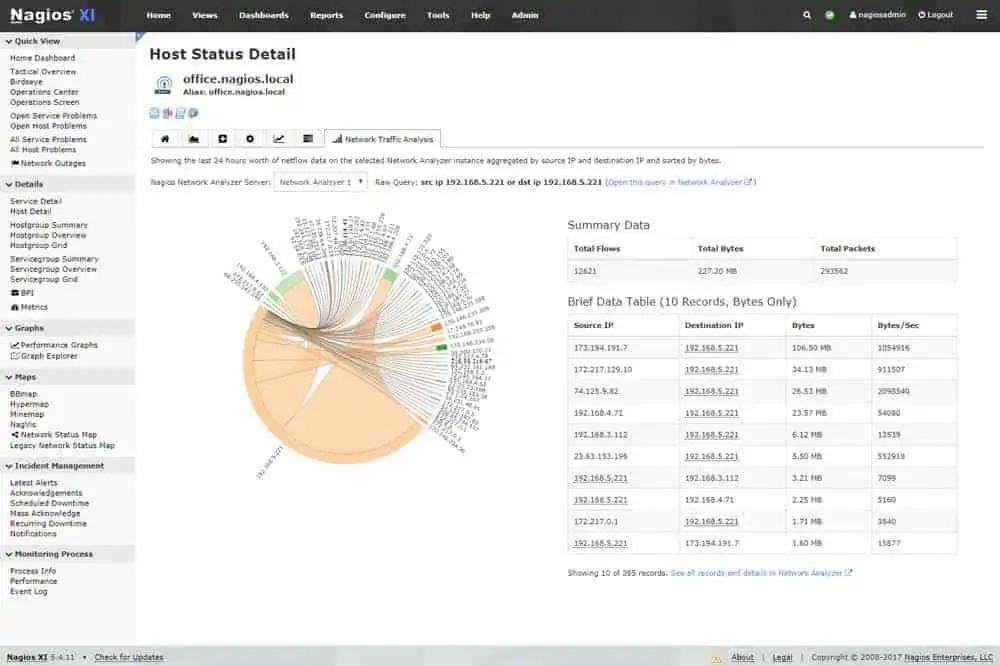
On the other hand, Nagios XI is an easy-to-use agentless commercial edition that is targeted at large networks and enterprises. It uses Nagios Core as its back-end alongside other technologies, including a built-in web configuration GUI, making it much easier to manage. If flexibility and extensibility are what you’re after in a network monitoring tool, then Nagios XI is the way to go. It includes graphs and reports, customizable dashboards, backend API, multi-tenancy, and many other advanced features that make it much easier to use.
5. Checkmk
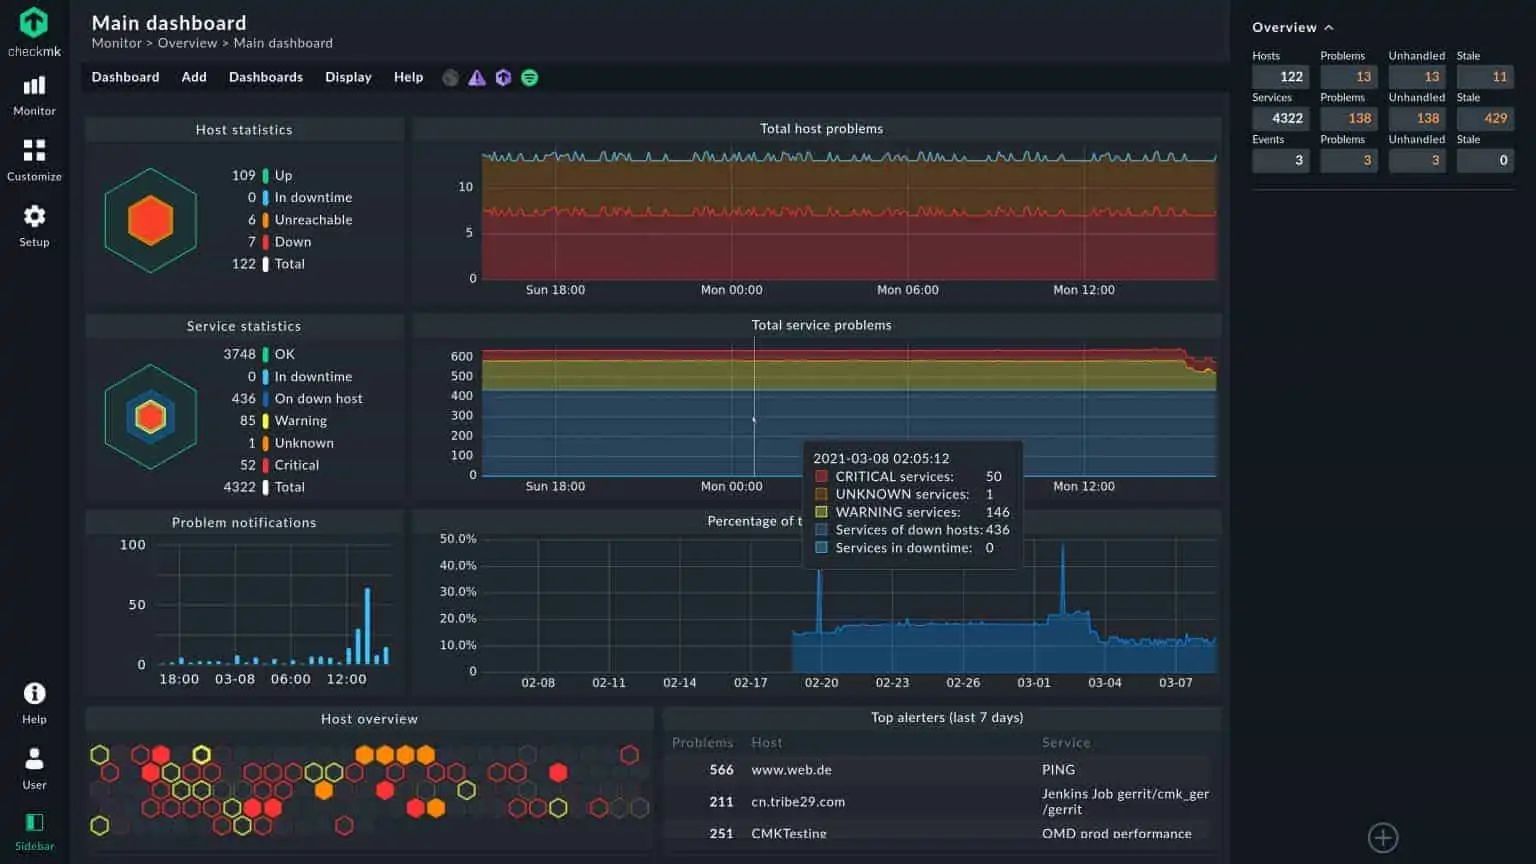
Checkmk is one of the leading tools for IT infrastructure and application monitoring. It uses an agentless and agent-based approach to monitor the health of IT infrastructures such as networks, servers, applications, storage, cloud infrastructure, IoT devices, and even business processes.
Checkmk combines the following types of IT infrastructure monitoring:
- Status-based monitoring, which records the health of a device or application.
- Metric-based monitoring enables the recording and analysis of time-series graphs.
- Log-based and event-based monitoring, in which key events can be filtered out, and actions can be triggered based on those events.
The Checkmk server can only be deployed on a Linux machine. Basic knowledge of Linux is all you need to get the application up and running. All the software you need is included in your Linux distribution or the Checkmk package. It is also possible to run Checkmk as a virtual appliance, a physical appliance, or as a Docker-Container. The agents used by Checkmk to monitor and collect data are supported on Windows and other operating systems. Checkmk is available in various editions. Before you begin installing it, you must first decide which editions you want to use. A breakdown of the available editions is shown in Table 3.0 below.
| Features | Checkmk Raw | Checkmk Enterprise | ||
|---|---|---|---|---|
| Edition | Open-source (100% free) | Free Standard Edition | Standard | Managed Services |
| Targeted at | Freelancers and the general public | Small scale users—one instance | Professional users | MSPs managing Multiple clients |
| Scalability | 1,000+ hosts | 25 hosts | 100,000+ hosts | 100,000+ hosts |
| Monitoring kernel | Nagios | Checkmk Microcore | Checkmk Microcore | Checkmk Microcore |
| Pricing | Free | Free | From €600 per year | From €1200 per year |
Table 3.0 | Comparison of Checkmk software editions
The Free Standard Edition contains all of the features of the Standard Edition, and it’s unlimited for the first 30 days. In addition, the Free Standard Edition and the Raw Edition can be easily upgraded directly to the Standard Edition.
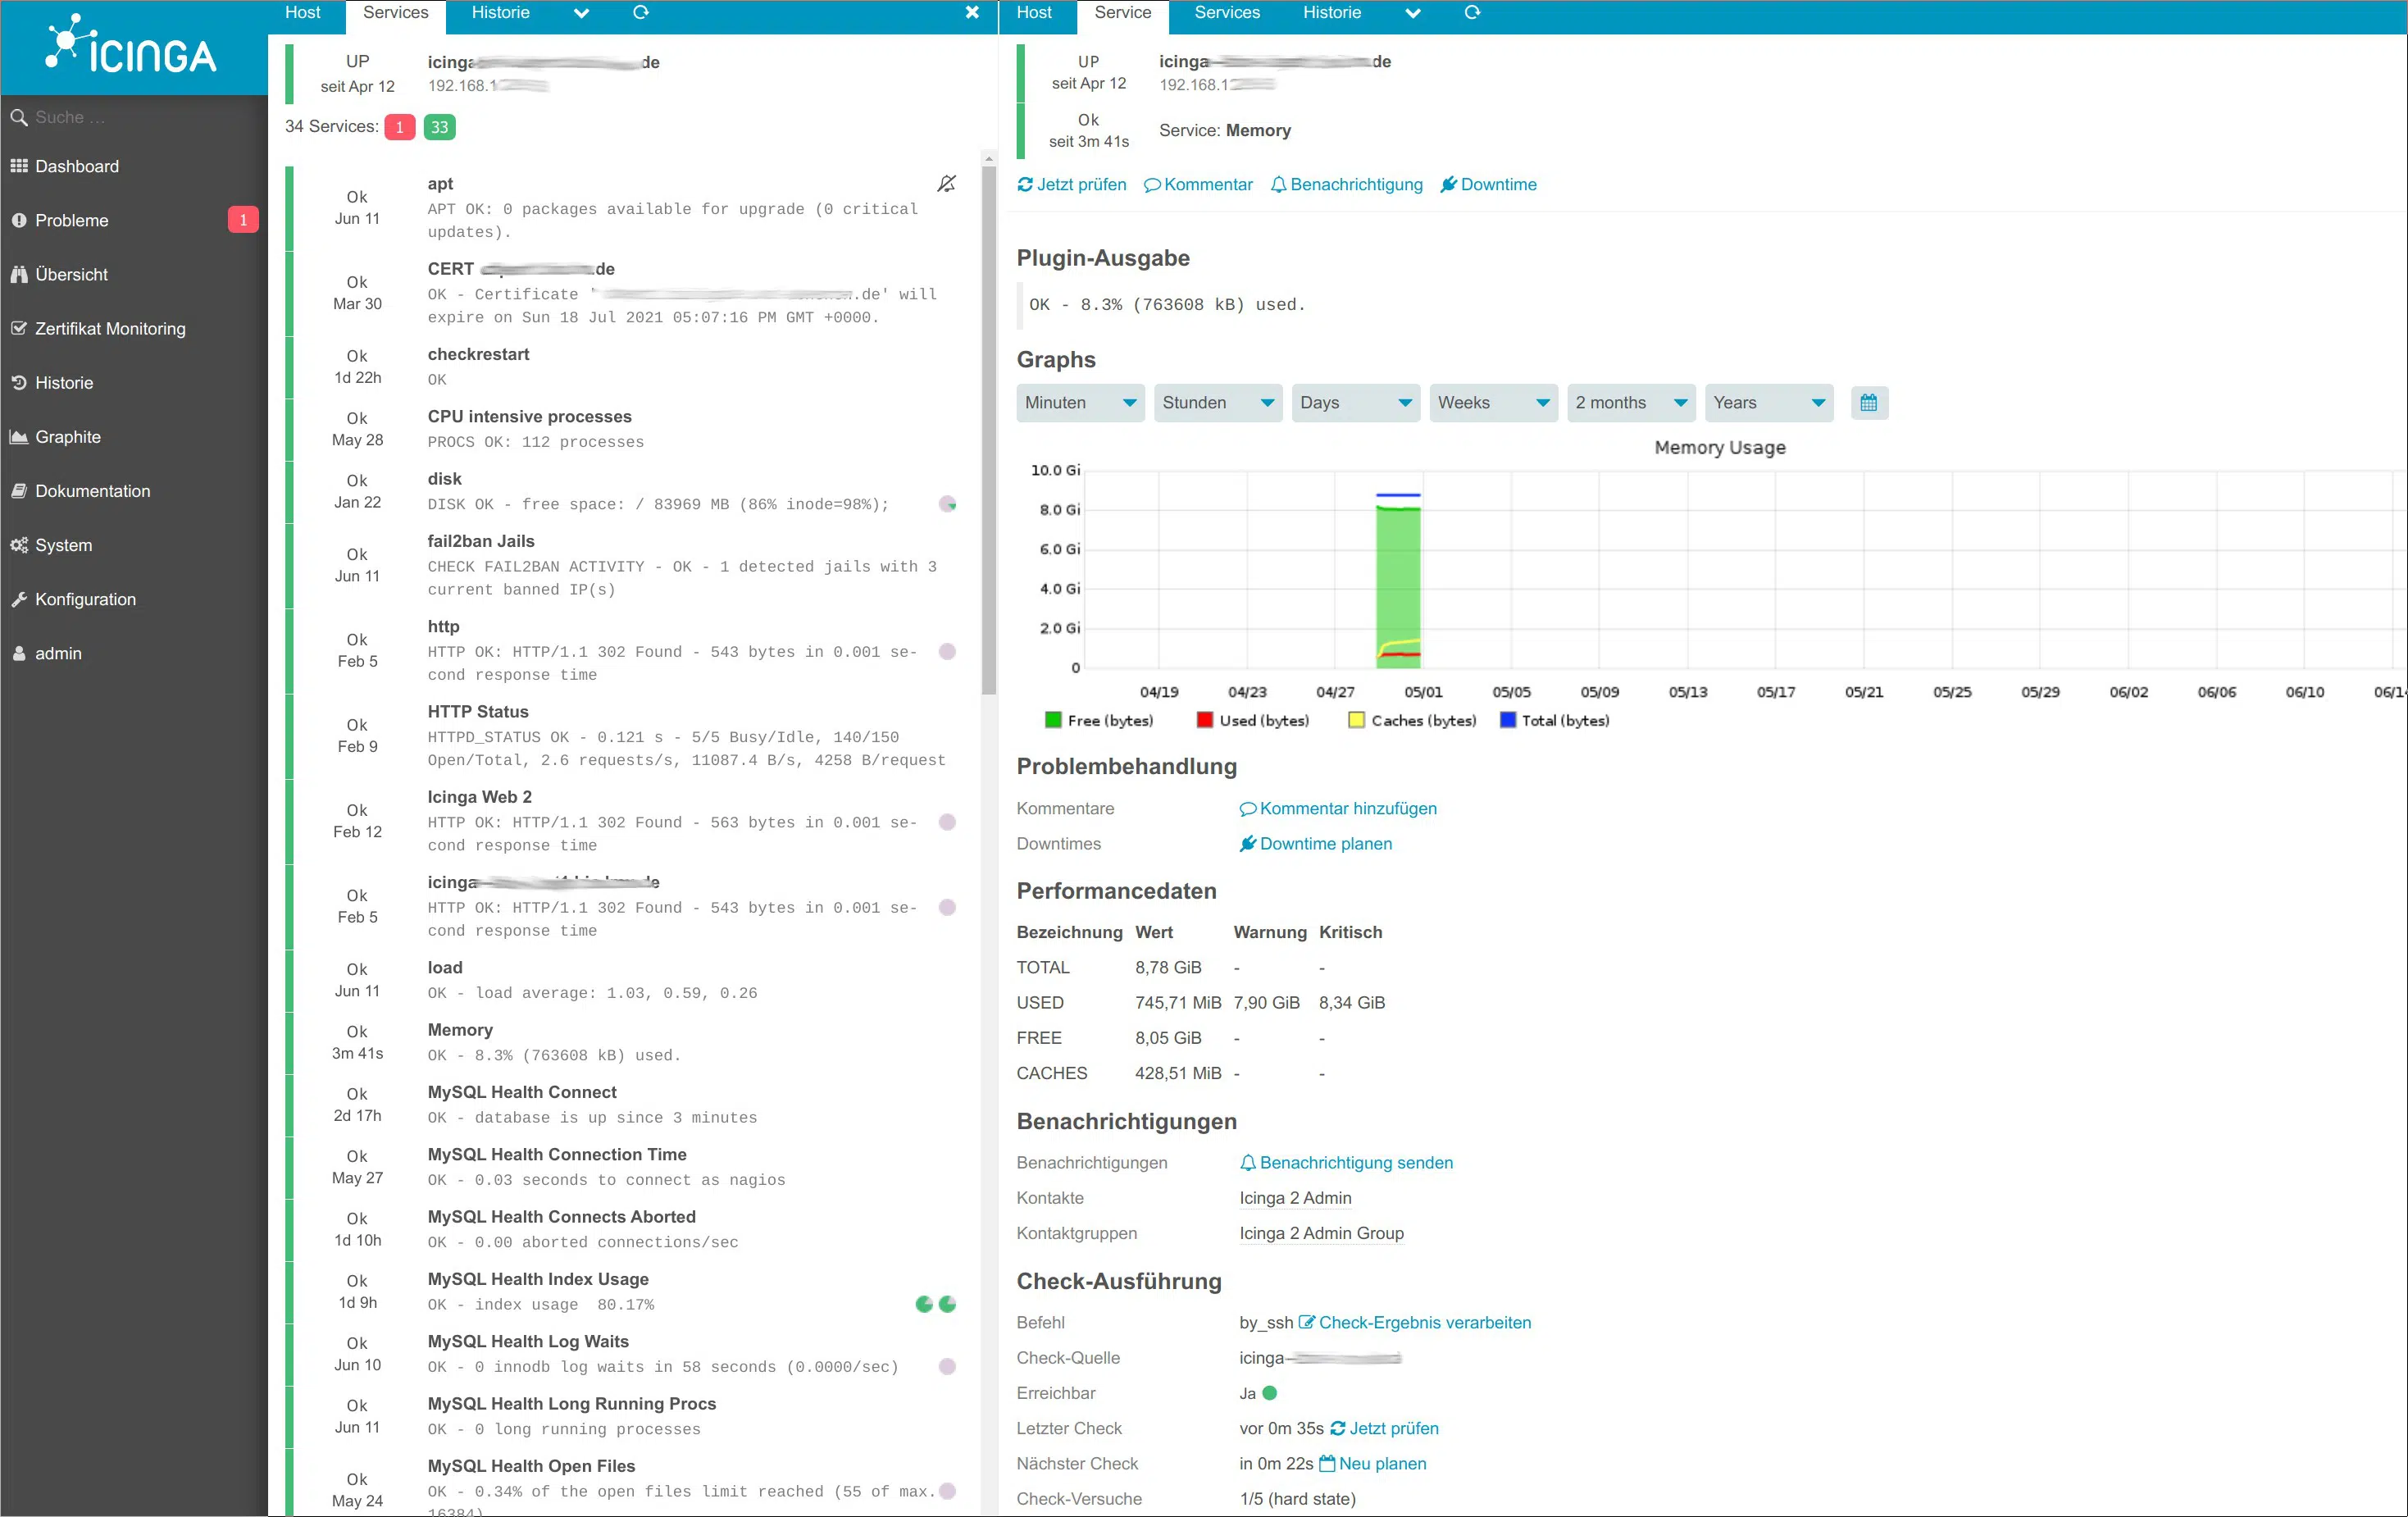
6. Icinga
Icinga is a popular enterprise-grade open-source tool for IT infrastructure and application monitoring. It checks the availability of your network resources, notifies you of outages, and generates performance data for reporting. Icinga was initially created as a fork of the Nagios Core application in 2009. The goal is to improve upon the groundwork laid by Nagios, including the addition of new features and capabilities.
Key Features:
- Monitoring of server components such as switches, routers, temperature and humidity sensors, and more
- Simple plug-in design that allows users to develop their service checks easily
- Tracking of network protocols such as SMTP, POP3, HTTP, NNTP, ping, and more
- Monitoring of host resources such as CPU load, disk usage, and more
- Notification, visualization, and reporting
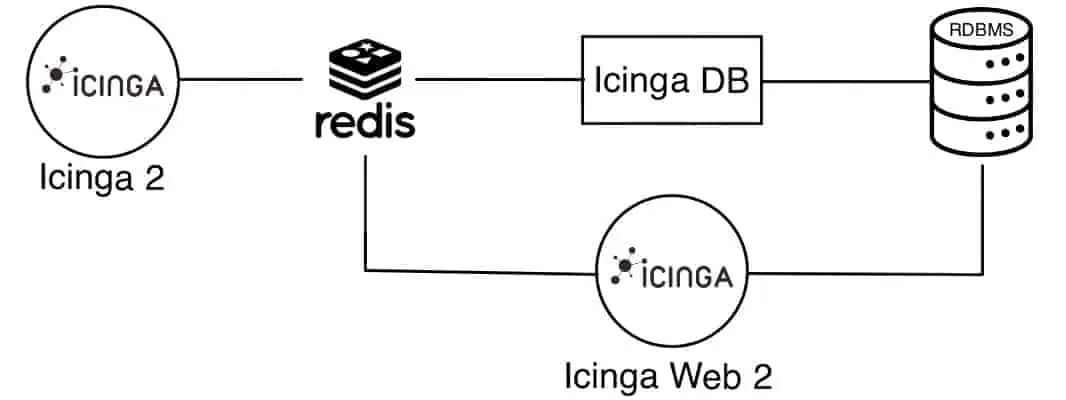
The application is scalable, extensible, and can monitor large networks that span multiple locations. Icinga is made up of the following core products:
- Icinga 2 (server) This is the core of the Icinga monitoring application that runs on a Linux machine
- Icinga Web 2 A web interface for users to view monitoring results and send commands to the Icinga Core
- Icinga DB A synchronization daemon between Icinga 2 (Redis) and Icinga Web 2 (MySQL)
- Icinga Director The configuration deployment tool for Icinga 2
Icinga has been successfully deployed in large and complex environments with thousands of hosts and services in distributed and failover setups.
7. OpenNMS
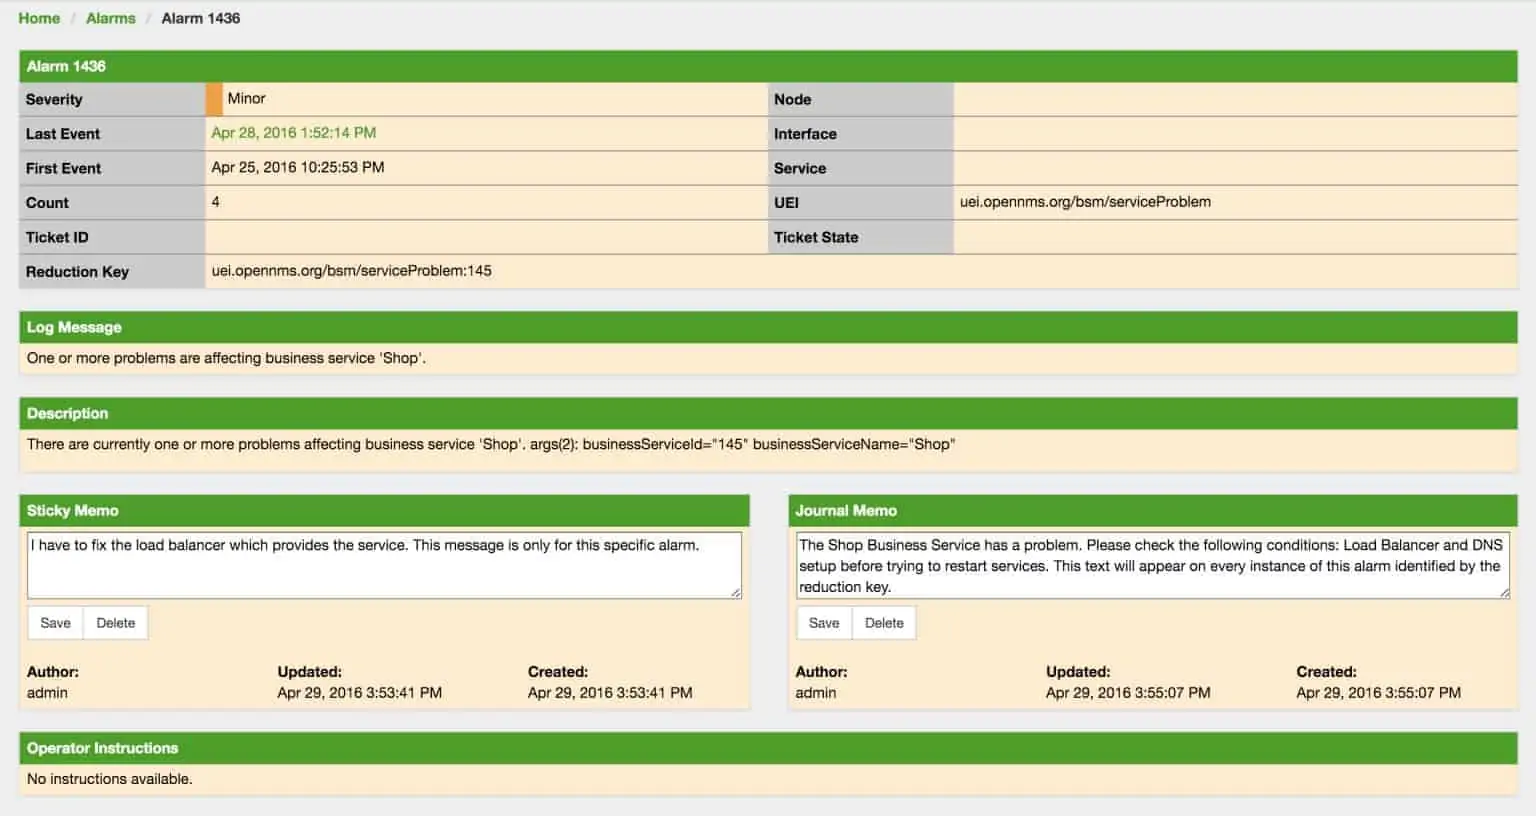
OpenNMS is an open-source network management and monitoring tool developed and managed by the OpenNMS Group and a community of developers. The product is 100% free with no licensing requirements. It prides itself as the first enterprise-grade network management platform developed under the open-source model. The business model is to offer it free of charge and earn revenue through consulting services provided by the OpenNMS Group.
OpenNMS is designed to be flexible, scalable, and distributed, with the ability to manage tens of thousands of devices from a single server. OpenNMS runs natively on both Windows and Linux/Unix-based operating systems as long as Java SDK and PostgreSQL database is supported.
The following are the four main functional areas of OpenNMS:
- Discovery and Provisioning Discovers and adds devices to the management system either manually or automatically.
- Service Monitoring Determines if network-based services such as ICMP, HTTP, DNS are available.
- Event Management and Notifications Receive events via SNMP, syslog, and other methods and generate an email, SMS, and other forms of notification.
- Data Collection Collects performance data for several network protocols such as SNMP, HTTP, JMX, WMI, and others.
OpenNMS is freely available for download via Sourceforge. Check the installation and administration manual for a detailed guide.
8. NetXMS
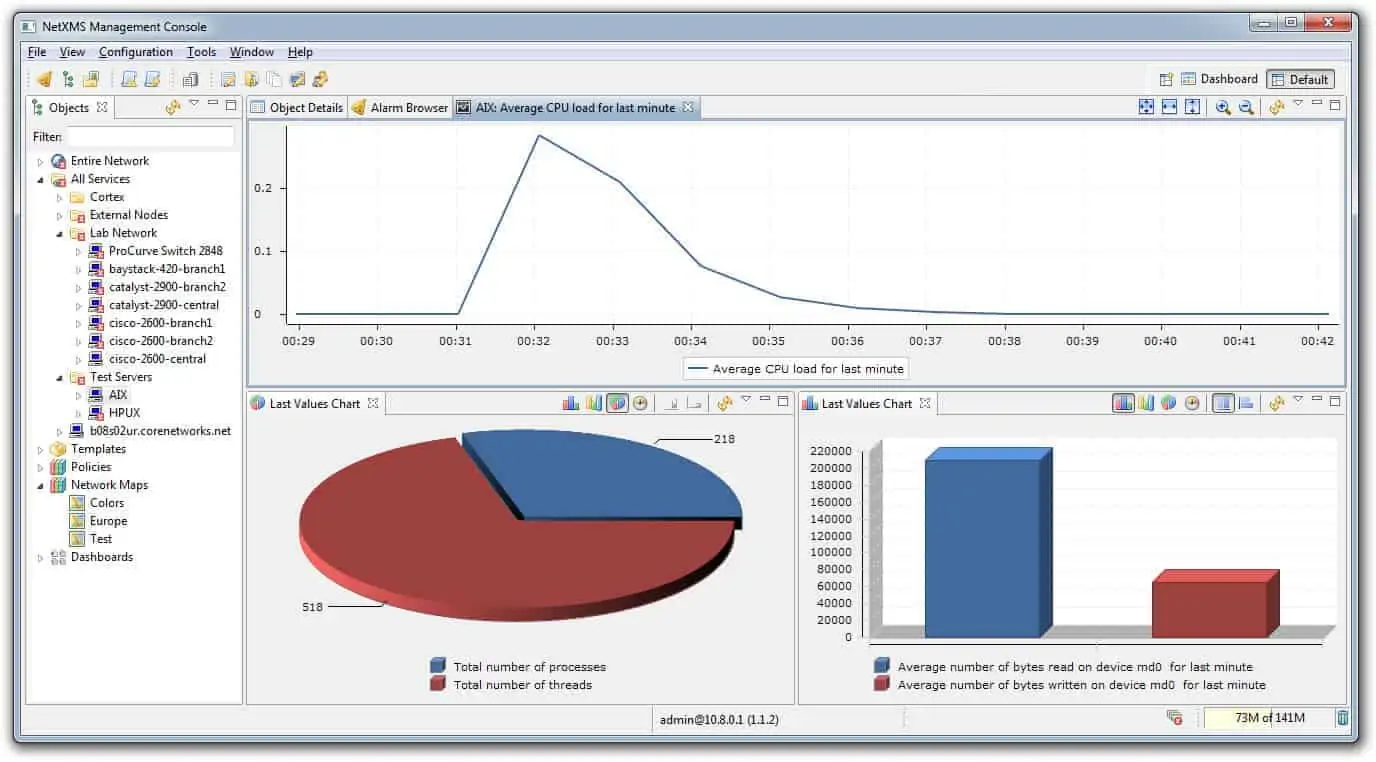
NetXMS is an enterprise-grade multi-platform open-source network management and monitoring tool. NetXMS runs natively on both Windows and Linux/Unix-based operating systems and can be used to monitor your entire IT infrastructure, including servers and applications.
Key Features:
- Compatibility with Nagios plug-in compatibility (most Nagios plug-ins work out-of-box with NetXMS)
- Monitoring of network devices, servers, and applications from one management server
- Data collection either from SNMP-capable platforms or from native NetXMS agent
- Centralized configuration and upgrades and Uses meager system resources
- User-friendly Windows and Unix GUI management console
- Automated network discovery for OSI layers 2 and 3
- The ability to send e-mails and SMS notifications
NetXMS can auto-discover devices in your network and collect information from them using agents. The collected data is sent back to the NetXMS servers for processing and storage. Network administrators can access collected data using the desktop, web, or a mobile (Android) management console.
NetXMS is available for download free of charge. Check the administration manual for a detailed guide.
9. Pandora Flexible Monitoring Solution (FMS)
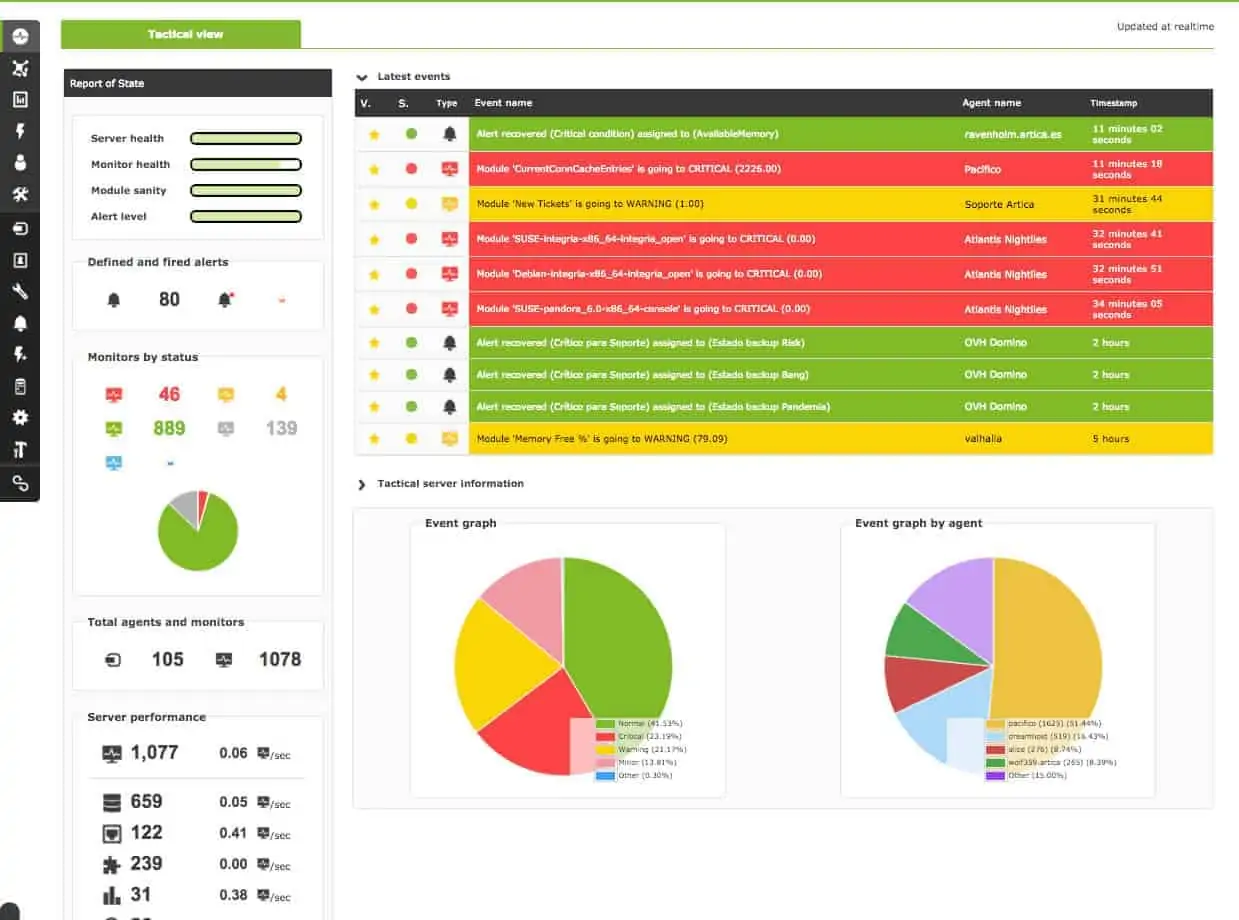
Pandora FMS is an all-in-one network monitoring tool. It uses an agentless and agent-based approach to monitor the health of IT infrastructures such as networks, servers, applications, databases, and much more. Pandora FMS supports both on-premise and cloud deployment options.
Key Features:
- Advanced availability reports, SLAs and capacity planning charts, and more
- NetFlow for network capacity management and low-level performance
- Monitoring of Windows and Linux/Unix computers with or without agents
- Automated mapping of the network, allowing users to customize it
- Detection of changes in network device configuration
- Historical graphs for up to three years back
- Auto-discovery of networks at levels 2 and 3
- Support for High availability setup
With Pandora FMS, you will be able to supervise and analyze your entire IT infrastructure in a single view. Pandora FMS is supported in almost any operating system. However, Linux seems to be the preferred OS for installation. The product is available in two editions:
- Community edition A 100% free and open-source version targeted at individuals and small businesses.
- Enterprise Edition A fully functional premium version designed for businesses with large networks
Pandora FMS Community edition is available for download. A 30-day free trial of the Enterprise edition with full access to all the features is also available. The easiest way to install Pandora FMS is to use the ISO image, which contains a customized version of CentOS Linux with all the dependencies.
10. Observium
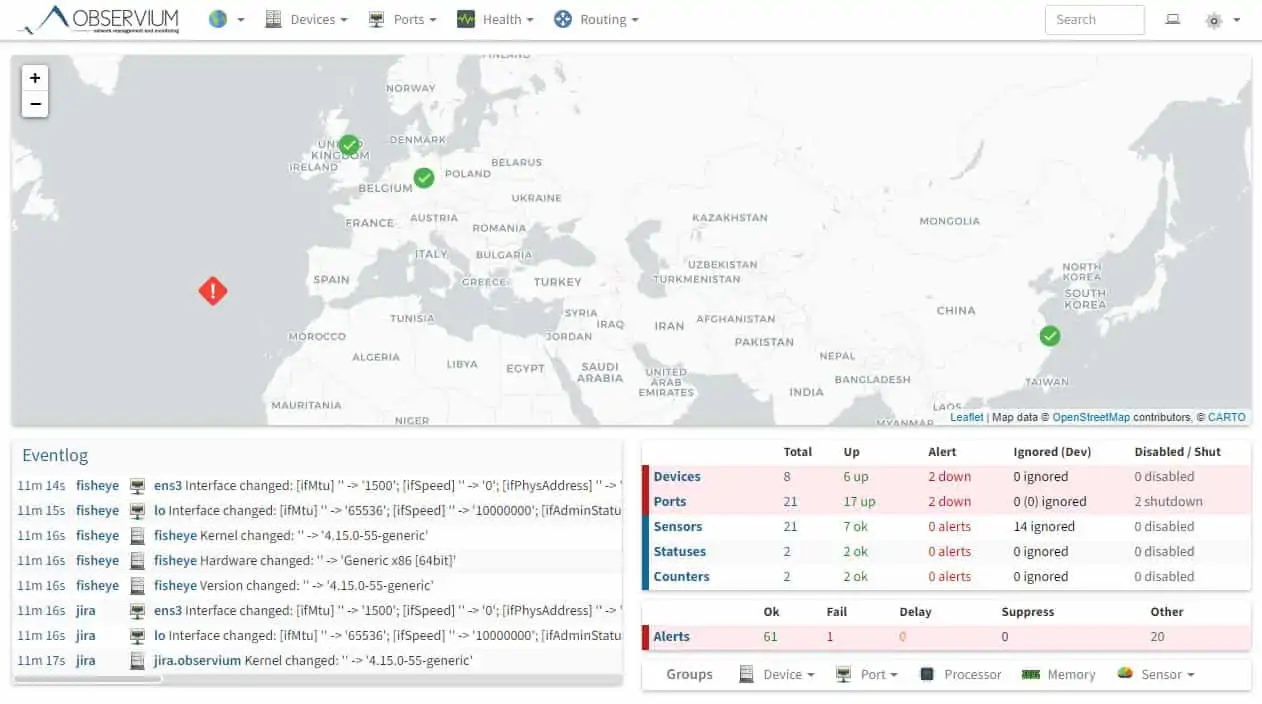
Observium is a powerful auto-discovering network monitoring platform that provides real-time network and infrastructure monitoring. Observium is designed to run on Linux but can also monitor Windows and support other platforms such as Cisco, Juniper, FreeBSD, Citrix Netscaler, NetApp, and many more.
Key Features:
- Support for a wide range of platforms and operating systems
- Ability to poll and store measurements for billing
- Streamline capacity and disaster recovery planning
- Bypass traditional round-robin limitations
- External integration and threshold alerting
- Auto-Discovery and traffic accounting
It uses SNMP to collect data, presented via a friendly web-based user interface. Since Apache and MySQL are prerequisites for the installation of Observium, your server needs to meet the hardware requirements to run them.
Observium comes in different editions which are tailored to suit your network and server monitoring requirements, as shown in Table 4.0 below:
| Features | Community | Professional | Enterprise |
|---|---|---|---|
| Ideal for | Personal/Home labs | SME and ISPs | large Enterprises |
| Number of monitored devices, ports, and sensors | Unlimited | Unlimited | Unlimited |
| Traffic accounting system | No | Yes | Yes |
| Priority consideration and support | No | No | Yes |
| Pricing (USD) | Free | 280 per year | 1,400.00 per year |
Table 4.0 | Comparison of the different editions of Observium
