Kibana is a highly capable open-source data visualisation and analytics platform built to work with Elasticsearch. It is designed to handle massive volumes of data and transform them into clear, interactive visual insights, making it an essential tool for organisations that need to interpret complex information quickly and at scale.
The platform provides an intuitive interface for searching, exploring, and visualising data stored in Elasticsearch. It is widely used by system administrators and security teams to turn raw logs and events into meaningful insights, whether for performance monitoring, troubleshooting, or security analysis.
Kibana is part of the Elastic Stack, alongside tools such as Logstash and Elasticsearch, forming a unified system for data ingestion, storage, and analysis. This integration enables real-time log processing, dynamic dashboards, and advanced reporting across use cases such as observability, SIEM, and application monitoring.
This guide introduces the basics of Kibana, including setup, configuration, and creating your first dashboards. It also covers key features and practical usage tips to help you work more effectively with your data.
Overview of Kibana
When connected to a data source in Elasticsearch, Kibana enables you to easily visualize and make sense of them. It provides line graphs, bar charts, pie charts, heat maps, and scatter plots, among others, or pie large volumes of data. Kibana also allows you to create slide decks that pull live data directly from Elasticsearch via a tool known as Canvas.
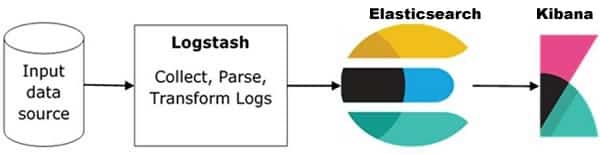
Kibana is one of the three main components of the Elastic Stack service: Logstash, Elasticsearch, and Kibana. Logstash provides an input stream to Elasticsearch for storage and search. It extracts and processes logs or events data from various remote sources, and pushes them to Elasticsearch for storage. Elasticsearch acts as a database where the data is collected, and Kibana is the window into the Elastic Stack, allowing you to access the stored data for visualizations, perform log and time-series analysis, detect anomalies in the data with unsupervised machine learning and extract insights.
Network admins and data analysts can use Kibana to visualize data on dashboards and discover insights in the data. Not only does Kibana help you make sense of data, it allows you to share your findings and explore the dashboards you create with other team members. Kibana enables you to create a search experience for your app, workplace, and website. It also enables you to monitor and apply analytics in real-time to events happening across all your environments. Kibana works with all types of data—structured or unstructured text, numerical data, time series data, geospatial data, logs, metrics, security events, and more to uncover patterns and relationships and visualize the results.
Some of the features and capabilities include:
- Data visualization: Kibana makes it easy to visualize data, search for hidden insights, and display them in charts, gauges, maps, graphs, and more.
- Manage, monitor, and secure the Elastic Stack: Manage your data, monitor the health of your Elastic Stack cluster, and control which users have access to which features.
- Dashboard: Kibana visualizations can all be placed on one dashboard. Visualizing different sections together gives you a clear picture of what exactly is going on within.
- Coordinate and region maps: A coordinate and region map in Kibana helps to show the visualization on the geographical map giving a realistic view of the data.
- Canvas: A powerful feature in Kibana that allows you to create slide decks that pull live data directly from Elasticsearch. With canvas visualization, you can represent your data in different color combinations, shapes, texts, and multiple pages.
- Timeline: A visualization tool mainly used for time-based data analysis. It helps more in comparison of data to the previous cycle in terms of the week, month, etc.
- Plugins: Third-party plugins allow you to enhance the visualization and UI capabilities of Kibana.
- Reports: All the data in the form of visualization and dashboard can be converted to reports (CSV format), embedded in the code, or in the form of URLs to be shared with others.
Installing and Configuring Kibana
Kibana can be installed as a self-managed on-premise solution on Windows, Linux, and macOS using native packages. Images are also available for running Kibana as a Docker container. To deploy Kibana and other associated tools on-premise, you must meet the minimum software and hardware requirements. For details on deploying Kibana on-premise, please check out the official documentation page.
On the other hand, the hosted Elasticsearch Service on Elastic Cloud is the quickest means to get up and running with Kibana, and it includes a scalable, fully managed backend. You access Kibana with a single click of a button. With Elastic Cloud, you can avoid the overhead of installing, maintaining, and scaling your observability stack. There are no installation and configuration hassles. It’s the only hosted Elasticsearch and Kibana offering available, managed, and administered by the creators of Elasticsearch. You can run it on Amazon Web Services (AWS), Google Cloud, or Microsoft Azure. All that’s required is to sign up for the Elastic Cloud account, add a sample data set that you can explore and visualize, and you are good to go. A 14-day trial is available on request. Follow the steps below to set up a cloud account.
- Get a free trial
- Log into Elastic Cloud
- Click Create Deployment
- Give your deployment a name
- Click Create deployment and download the password for the elastic user
Adding Data for Visualization
Once you are up and running, the next step is to get some data into Kibana for visualization. Multiple options exist for getting data into the Elastic stack for visualization adding. You can choose the one that works best for you:
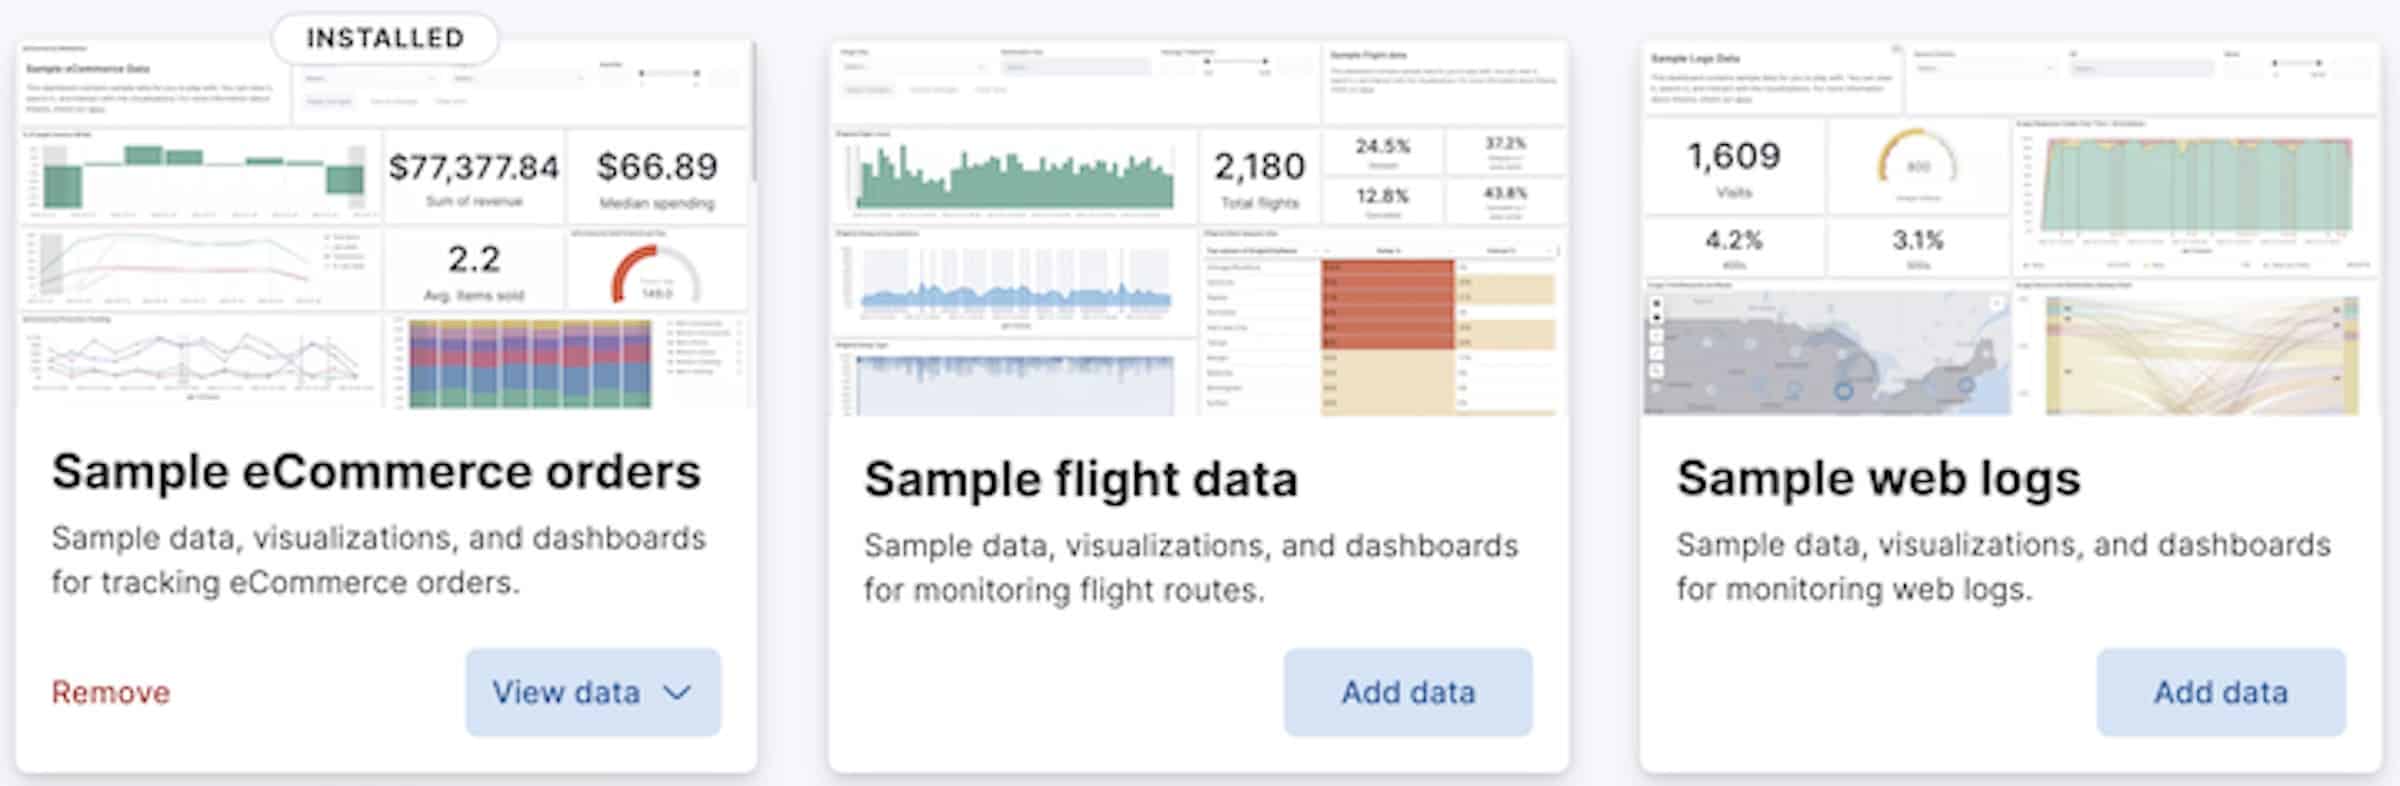
1. Add sample data: If your data is not yet ready, Kibana provides sample data sets to enable you to explore Kibana visualization, dashboards, and more before you ingest or add your data. To use the sample data, follow the steps below:
- On the home page, click Try sample data.
- Click Other sample data sets.
- On the Sample eCommerce orders card.
- Finally, click Add data.
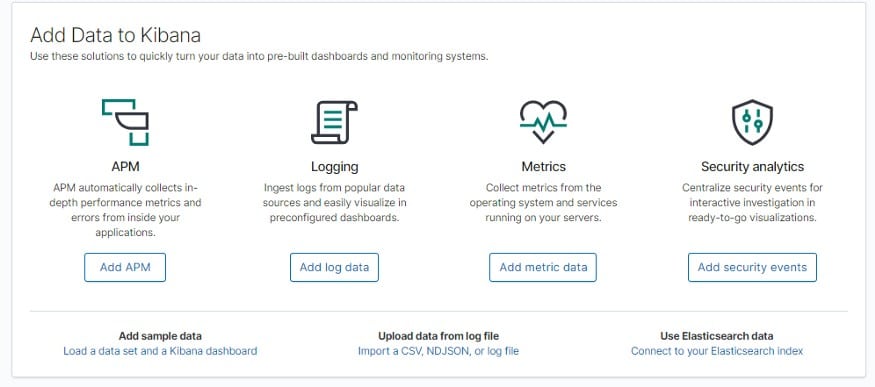
Once you are ready to add your data to the Elastic Stack, you can use any of the integration methods below, which are pre-packaged assets that are available for a wide range of popular services and platforms.
2. Add data with Elastic solution: Elastic solutions are a good source of data for the Elastic stack. You can leverage these solutions to extract logs or events data from, and then process and push them to Elasticsearch for storage and visualization on Kibana. Examples of such Elastic solutions include:
- Web site search crawler: Enterprise and Workplace Search are great sources of data for Kibana. Enterprise Search website crawler allows you to discover, extract, and index web content into App Search engines. Workplace Search allows content search across Google Drive, GitHub, Salesforce, and many other web services.
- Elastic APM: Allows you to extract logs, metrics, traces, and uptime data into the Elastic Stack for visualization on Kibana.
- Endpoint Security: Send logs, metrics, and endpoint security data to Elasticsearch Security which can then be pushed to the Elastic stack for visualization on Kibana.
3. Add data with programming languages: Programming languages such as Python, Ruby, Java, and JavaScript can be used to add any data to the Elastic Stack. Elasticsearch Client documentation provides details for each programming language library that Elastic provides. If you are running Kibana on the hosted Elasticsearch Service, you can complete the integration process by clicking View deployment details on the Integrations view to verify your Elasticsearch endpoint and Cloud ID, and create API keys for integration.
4. Add data by uploading a data file: If you have a log file in the form of CSV, TSV, or JSON file, you can upload it, view its fields and metrics, and optionally import it into Elasticsearch for visualization on Kibana. Again, if you are running Kibana on the hosted Elasticsearch Service, you can complete the integration process by clicking Integrations view, then searching for Upload a file, and then dropping your file on the target.
Visualize the Data with Dashboard
Once you have added your data, you are almost ready to visualize them on Kibana. The entire process of creating a dashboard and visualization in Kibana is designed to be smooth and orderly—thanks to Kibana’s user-friendly and intuitive interface. However, before you can do that, Kibana will require you to create a data view to access the Elasticsearch data that you want to explore. A data view selects the data to use and allows you to define the properties of the fields.
You get a data view for free if you obtained data using one of the Kibana ingest options, uploaded a file, or added sample data. In that case, you can begin exploring your data without creating a separate data view. However, if you loaded your data, follow these steps to create a data view.
- Open the main menu, then click Stack Management >> Data Views.
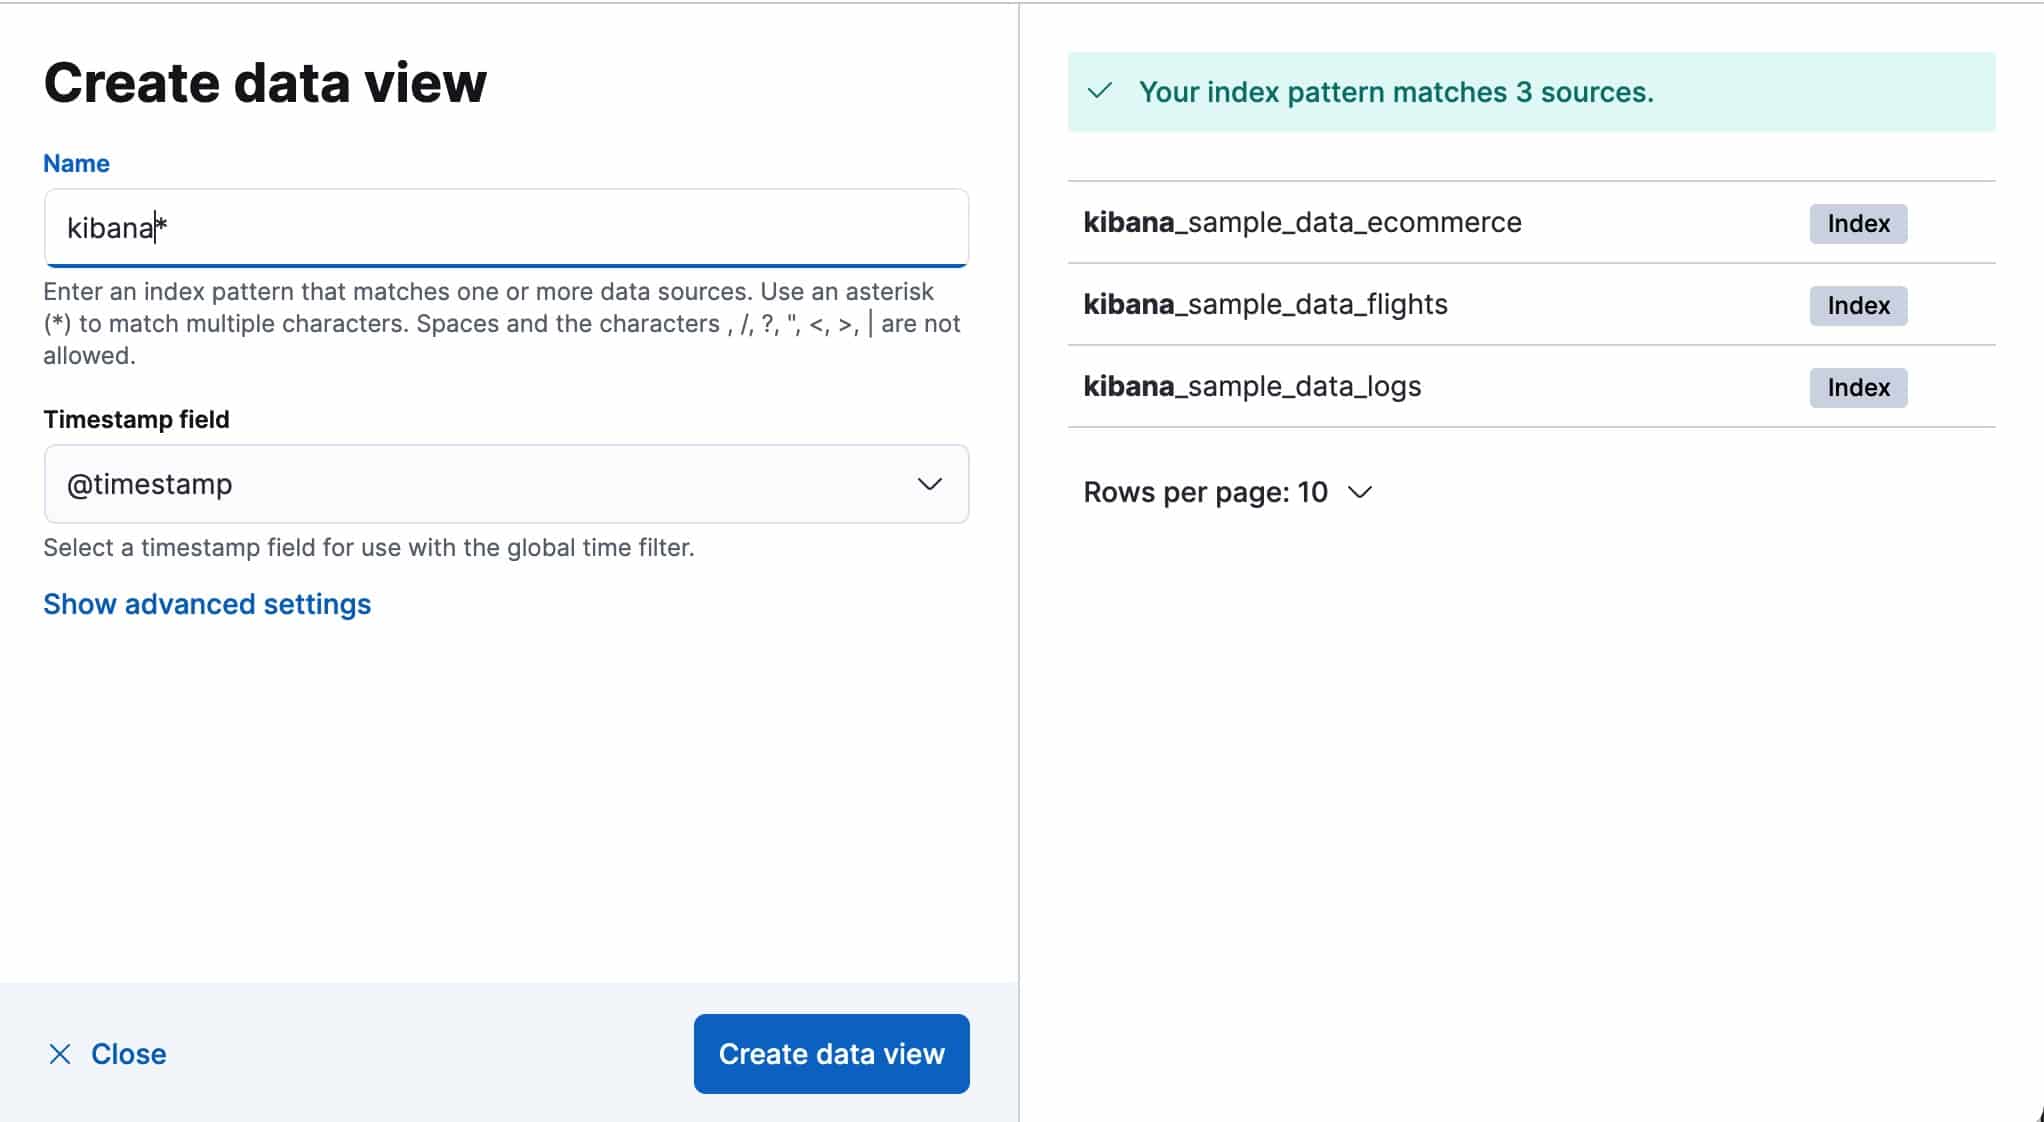
- Click Create data view.
- Start typing in the name field, and Kibana looks for the names of indices, data streams, and aliases that match your input.
- If Kibana detects an index with a timestamp, expand the Timestamp field menu, and then select the default field for filtering your data by time.
- To display all indices, click Show advanced settings, then select Allow hidden and system indices.
- To specify your data view name, click Show advanced settings, then enter the name in the Custom data view ID field. For example, enter your Elasticsearch index alias name.
- Click Save data view to Kibana.
- Select this data view when you search and visualize your data.
Kibana also provides a feature that allows you to turn your data from one or more data views into a collection of panels that bring clarity to your data, tell a story about your data, and allow you to focus on only the data that’s important to you. Panels display your data in graphs, charts, tables, maps, and more, which allow you to compare your data side-by-side to identify patterns and connections.
This feature is called a dashboard. With Kibana, you can extract insights from the Elasticsearch data with visualizations that can be combined in a custom interactive dashboard. Dashboards support several types of panels to display your data, and several options to create panels. They include:
- Editors: Use one of the editors to create visualizations of your data. Each editor varies in capabilities for all levels of analysts.
- Maps: Create beautiful displays of your geographical data.
- Anomaly swim lane: Display the results from machine learning anomaly detection jobs.
- Anomaly chart: Display an anomaly chart from the Anomaly Explorer.
- Log stream: Display a table of live streaming logs.
- Tools: Add interactive filters with Controls panels.
- Text: Add context to your panels with Text.
Elasticsearch and Kibana also provide a powerful feature that provides a way to visualize only a selected subset of documents. The comfy interface in Kibana provides a straightforward way of filtering the data. You can choose how to filter the data—either by using the Kibana Query Language (KQL)—simple syntax for filtering Elasticsearch data using free text search or field-based search, or Lucene query syntax—a query language that can be used to filter messages in Kibana for advanced Lucene features, such as regular expressions or fuzzy term matching.
Tools that Work with Kibana
The table below lists some examples of popular third-party tools that can be used to extend the capabilities of Kibana:
| Tool Name | Purpose | Description |
|---|---|---|
| LogTrail | Apps | A plugin for Kibana to view, analyze, search, and tail log events from multiple hosts in real-time with DevOps friendly interface. |
| Shard Allocation | Apps | A kibana plugin that allows you to visualize Elasticsearch shard allocation |
| Wazuh | Apps | Provides host-based security visibility using lightweight multi-platform agents. |
| AI Analyst | Apps | Uses Natural Language Processing (NLP) to provide ML visualizations and insights from your data in Elastic stack |
| 3D Graph | Visualization | Allows you to add a new interesting graph feature, to the current Kibana series of charts and metrics, to show 3D data. |
| Insight | Visualization | A multidimensional data exploration tool that allows users to establish relationships among them and draw useful insights from them. |
| Vega | Visualization | Allows any data visualizations from Elasticsearch and other data sources using Vega grammar. For instance, you can use it to create a visualization on top of an interactive map. |
| Flexmonster Pivot | Visualization | A powerful JavaScript tool for interactive web reporting. It allows you to visualize and analyze data from JSON, CSV, SQL, NoSQL, Elasticsearch, and OLAP data sources quickly and conveniently. |
| Time filter as a dashboard panel | Time filter | Widget to view and edit the time range from within dashboards. |
| Prometheus Exporter | Prometheus data export | Exports the Kibana metrics in the Prometheus format |
| Kibana-API | API | Exposes an API with Kibana functionality. It allows you to create, edit and embed visualizations, and also to search inside an embedded dashboard. |
| Mathlion | Timelion Extensions | An advanced math plugin for Kibana's Timelion. It enables equation parsing and advanced math under Timelion. |
Table 1.0 | List of some of the popular tools that work with Kibana
