

Cisco Application Centric Infrastructure or Cisco ACI is Cisco’s answer to Software-Defined Networking (SDN). In a world where tangible networks are becoming entangled with less tangible models of connectivity like cloud computing, enterprises are using tools like ACI to take control.
Here is our list of the best Cisco ACI monitoring tools:
- ManageEngine OpManager EDITOR’S CHOICE This network management package interacts with network devices to track activity on switches and routers and it is able to read in ACI data to generate a map and adapt statistics to the virtual network structure. Available for Windows Server, Linux, AWS, and Azure. Get a 30-day free trial.
- Site24x7 (FREE TRIAL) This cloud-based platform provides full-stack observability of both hardware and software assets, which is ideal for monitoring composite systems, such as the Cisco ACI service. Get a 30-day free trial.
- NetBrain A network monitor and SDN monitoring tool that can monitor Cisco ACI and VMwareNSX environments. Runs on Windows Server.
- SevOne An infrastructure monitor that includes Cisco ACI supervision. Available as an appliance or as a cloud-based service.
- SolarWinds Network Performance Monitor A network monitoring tool that can access and track Cisco ACI networks.
- ScienceLogic SL1 AI-based systems monitor that includes Cisco ACI performance tracking. Available as a physical or virtual appliance.
- Zenoss Cloud-based system management service that includes the monitoring of Cisco ACI.
What is Cisco ACI?
Cisco ACI is a software-defined networking solution that uses a network policy automation model to integrate hardware and software. ACI has been designed specifically to implement data center automation and consistency management policies in cloud or data center environments.
Briefly, the ACI includes a number of core components:
- End Point Groups
- Application Profiles
- Contracts
- Filters
- Outsides
ACI makes automatic changes to the network according to how conditions change. For instance, ACI uses a policy to determine how applications and services communicate including which groups can communicate with whom. The user has the control to manage endpoints (virtual machines) and group them together.
The key advantage of ACI is that rather than going to each device and using a command-line interface to administrate, the user can simply use APIC to manage the network and its connected services.
The SDN can be used to automate connections and tasks that administrators would usually have to do normally. For example, administrators used to have to manually configure Access Control Lists (ACLs).
ACI has two main components; Nexus 9000 switches and Application Policy Infrastructure Controllers (APICs). Nexus 9000 deals with physical switching and the APIC deals with virtual fabric configuration. The APIC configures the policy that is then used by nodes within the network. The APIC is essentially a centralized solution for managing systems and applications throughout the network.
ACI Leaf and Spine Topology
ACI uses a leaf and spine topology. In the topology, the leaf node is connected to all spine nodes in a fabric. Leaves don’t communicate with other leaves and spine switches can’t communicate with other switches. Servers, hosts, and services all connect to the leaf nodes. This layout is advantageous because it can adapt to the requirements of the modern data center environment.
The best Cisco ACI monitoring tools
Of course, the fabric management approach of Cisco ACI does raise some challenges, particularly with regards to performance monitoring.
Our methodology for selecting a Cisco ACI monitoring tool
We reviewed the market for infrastructure monitors that can query performance data from Cisco ACI systems and analyzed tools based on the following criteria:
- Monitoring for the underlying network elements
- Application monitoring capabilities
- A full-stack view that lets you select the ACI application and see all of the underlying system layers
- Live performance reports
- Alerts for resource shortages or degrading performance
- A free trial or a demo system that offers a no-risk assessment opportunity
- Value for money from a single tool that is offered at a fair price
With these selection criteria in mind, we identified a number of monitoring systems that are ideal for tracking the performance of Cisco ACI implementations.
1. ManageEngine OpManager (FREE TRIAL)
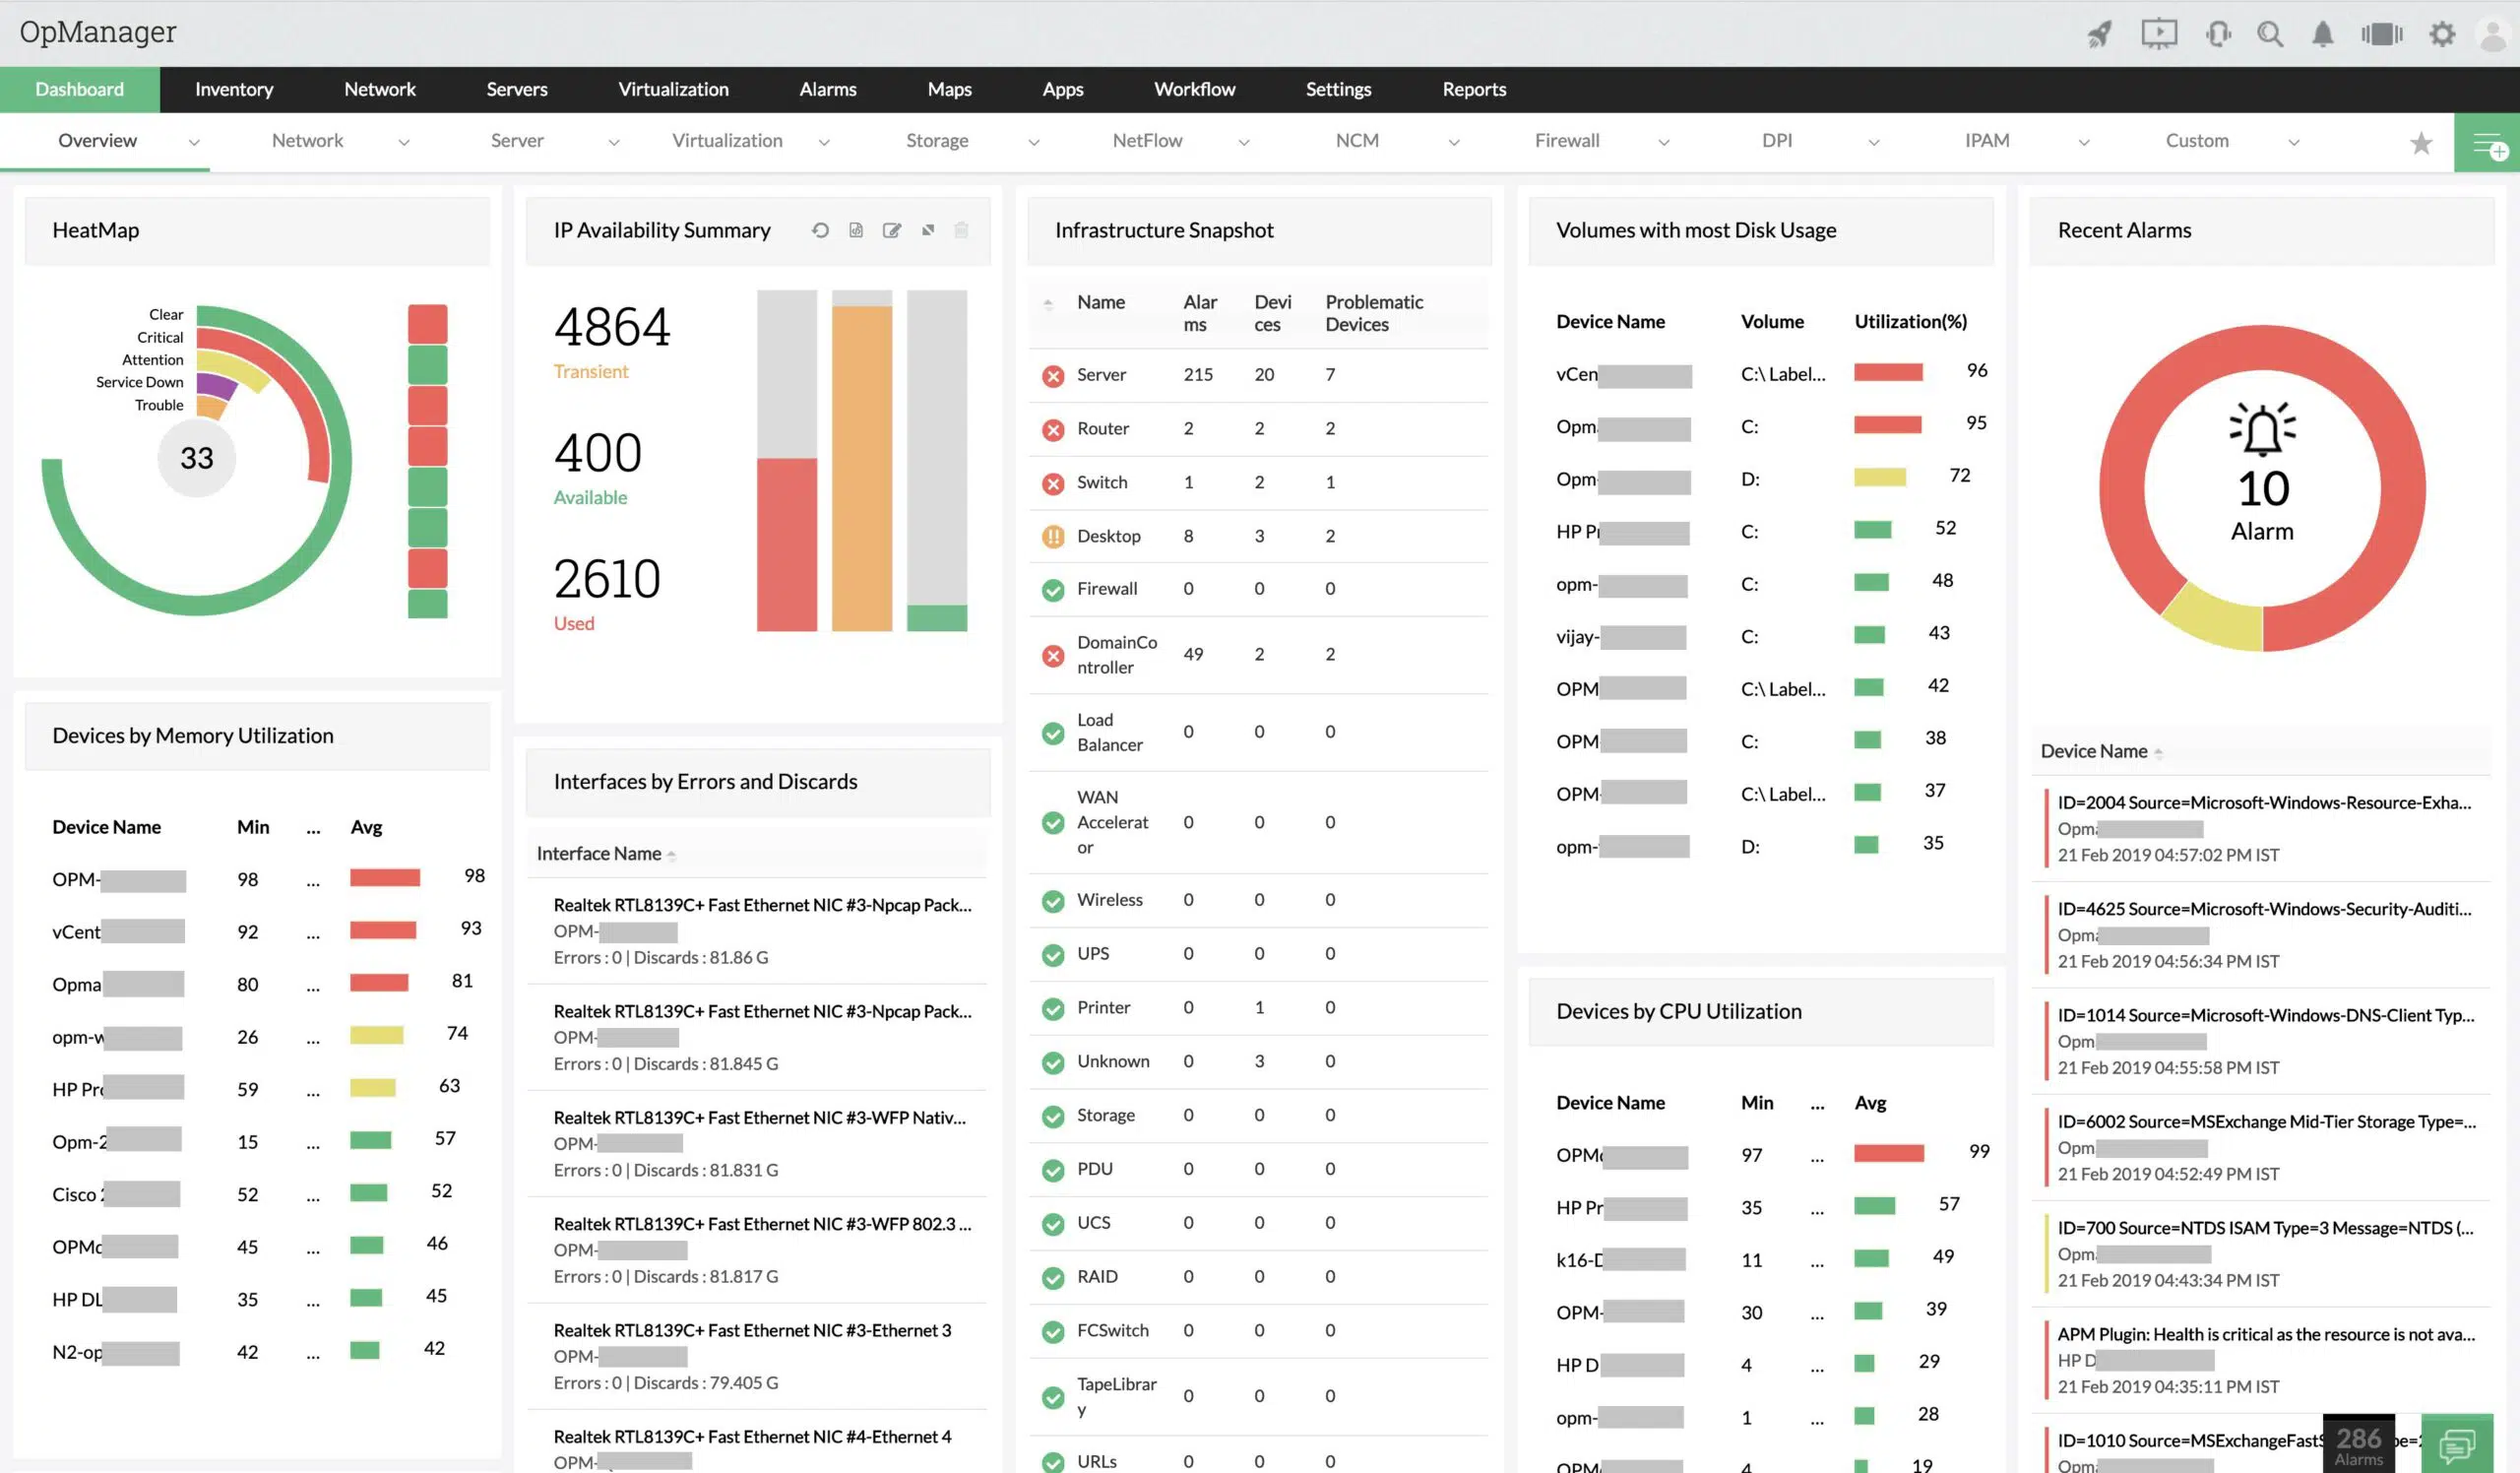
ManageEngine OpManager is able to interface to your Cisco ACI controllers and map out the virtual network. The system creates a map of the network as seen by ACI. This stylized depiction clearly shows the spine and leaf switches in the environment.
Key Features
- Interpretation of the ACI environment: Also discovers the physical network layout
- Maps the ACI network: Shows the relationship between virtual switches
- Creates an inventory of the real network: Records the capacity of each switch interface
- Reconciles between the physical and virtual network: Provides tabs that show the network from different perspectives
- Provides a summary screen: Shows availability and statuses
Why do we recommend it?
ManageEngine OpManager isn’t just suited to monitoring ACI networks – you can also use it to monitor a regular LAN or WAN. The system will also track the performance of all the endpoints on your network. The system keeps constant vigilance over the network and will raise an alert if any element develops a problem.

The monitoring console shows a topology map, all fabrics and their tenants. You can zoom in to any level and look at details for each entity on the ACI network. Endpoints on the network are grouped according to the ACI rules that you set up and these groups are shown in the console, listing the members of each.
The package keeps track of the setup that you defined in the Application Policy Infrastructure Controller (APIC). It provides an overall performance and health score plus a record of availability over time.
You might not want to see all of the available metrics on your ACI environment. The ManageEngine console is customizable, with a library of widgets that you can choose from. The package also offers performance thresholds that will trigger alerts and you can define your own alerting rules.
Who is it recommended for?
This package is able to monitor a range of virtual systems, including VMs, virtual servers, and software-defined networks, such as Cisco ACI. The package can be combined with the NetFlow Analyzer to add on traffic analysis to the device status monitoring of OpManager. The editions of the OpManager package make it suitable for all sizes of businesses.
Pros:
- Network device and server monitoring: Monitors regular networks as well as ACI
- Drilldown details: See the status details of each node including the physical infrastructure that it relies on
- Monitors wireless networks: Can include wireless sections of a virtual network
- WAN monitoring: The highest plan provides multi-site monitoring
- Deployment options: Install the monitoring package on Windows Server or Linux or get it as a service in AWS or Azure
Cons:
- No SaaS option: The cloud hosting opportunities have to be run on your own account
ManageEngine provides five editions for OpManager and the first is Free. Although this sounds appealing, the Free edition is limited to monitoring three devices and it isn’t suitable for Cisco ACI monitoring. There is an edition that is suitable for monitoring WANs and another that is designed for use by managed service providers.
The prices for the paid editions are:
- Standard: 25 devices = $245 per year
- Professional: 25 devices = $345 per year
- Enterprise (WANs): 250 devices = $1,545 per year
- MSP: 50 devices = $795
The software for OpManager will run on Windows Server or Linux. It is also available as a service on AWS or Azure. You can try out the package with a 30-day free trial.
EDITOR'S CHOICE
ManageEngine OpManager is our top pick for a Cisco ACI monitoring tool because this package is able to monitor physical networks with all of their devices and endpoints as well as SDNs, such as ACI. The package discovers both the actual network and the virtual system and monitors the interpreting software that generates the virtual network. The editions for the package are all suitable for single LANs, except for the Enterprise edition, which is for WANS, and the MSP editions, which will monitor the networks of multiple businesses. This is a flexible service that you can run on your own server or on an AWS or Azure account in the cloud.
Download: Get a 30-day FREE Trial
Official Site: https://www.manageengine.com/network-monitoring/download.html
OS: Windows Server, Linux, AWS, and Azure
2. Site24x7 (FREE TRIAL)

Site24x7 delivers a pack of system monitoring tools from its cloud platform. These monitors include systems for checking the performance of networks, middleware, applications, and Web assets. All of the monitors can interact with each other to cover composite systems and that combination is ideal for monitoring Cisco ACI.
Key Features:
- Detailed Network Overview: Shows the health and availability of your Cisco ACI network, including super spines, spines, leaf nodes, tenants, and endpoint groups.
- Eliminates Tool Sprawl: Monitor Cisco ACI and traditional on-premises networks in a single tool for complete network observability.
- REST API Integration: Fetches data using REST APIs and organizes it in an easy-to-understand format
- Real-Time Alerts: Proactively address issues by receiving instant notifications when thresholds are breached.
Why do we recommend it?
Site24x7 provides comprehensive monitoring for Cisco Application Centric Infrastructure (ACI). It implements real-time alerts, detailed network overviews, and health score monitoring. It integrates via REST API to fetch data, offers customizable dashboards, and maintains historical performance records, ensuring complete network observability and proactive issue resolution.
The full Site24x7 platform provides monitors for just about all of the IT assets that your company could have. The Cisco ACI monitor is just part of that service. So, you will be able to monitor your network devices, endpoints, Web applications, middleware, services, and cloud-based systems all within the same console.
The platform provides a specific screen for ACI monitoring, which you need to finds in the plug-ins library and activate. The screen, once available, can be customized and it is also possible to create your own custom screens in the dashboard. Automated monitoring hinges on a series of performance thresholds that will provoke an alert if breached. Those triggers can also be customized.
Who is it recommended for?
Site24x7 is offered in a range of plans. However, all of them include the ability to monitor Cisco ACI. Plans are sized and priced to suit small businesses and larger companies pay supplements for extra capacity. So, Site24x7 is suitable for all sizes of enterprises that use Cisco ACI.
Pros:
- Customizable Dashboards: Create dashboards tailored to your organization’s specific monitoring needs.
- Historical Reporting: Maintain records of historical performance data to track trends and identify patterns.
- Health Score Monitoring: View the health score of various elements in the Cisco ACI network, including super spine, spine, leaf, and tenant.
- Full Stack Observability: Monitor all of your IT assets from a single console.
Cons:
- No on-premises option: Site24x7 is only available as a cloud-based platform.
Site24x7 is a versatile package and isn’t just suitable for Cisco ACI monitoring,. Companies that don’t implement ACI would also find this package suitable. You can examine the system with a 30-day free trial.
3. NetBrain
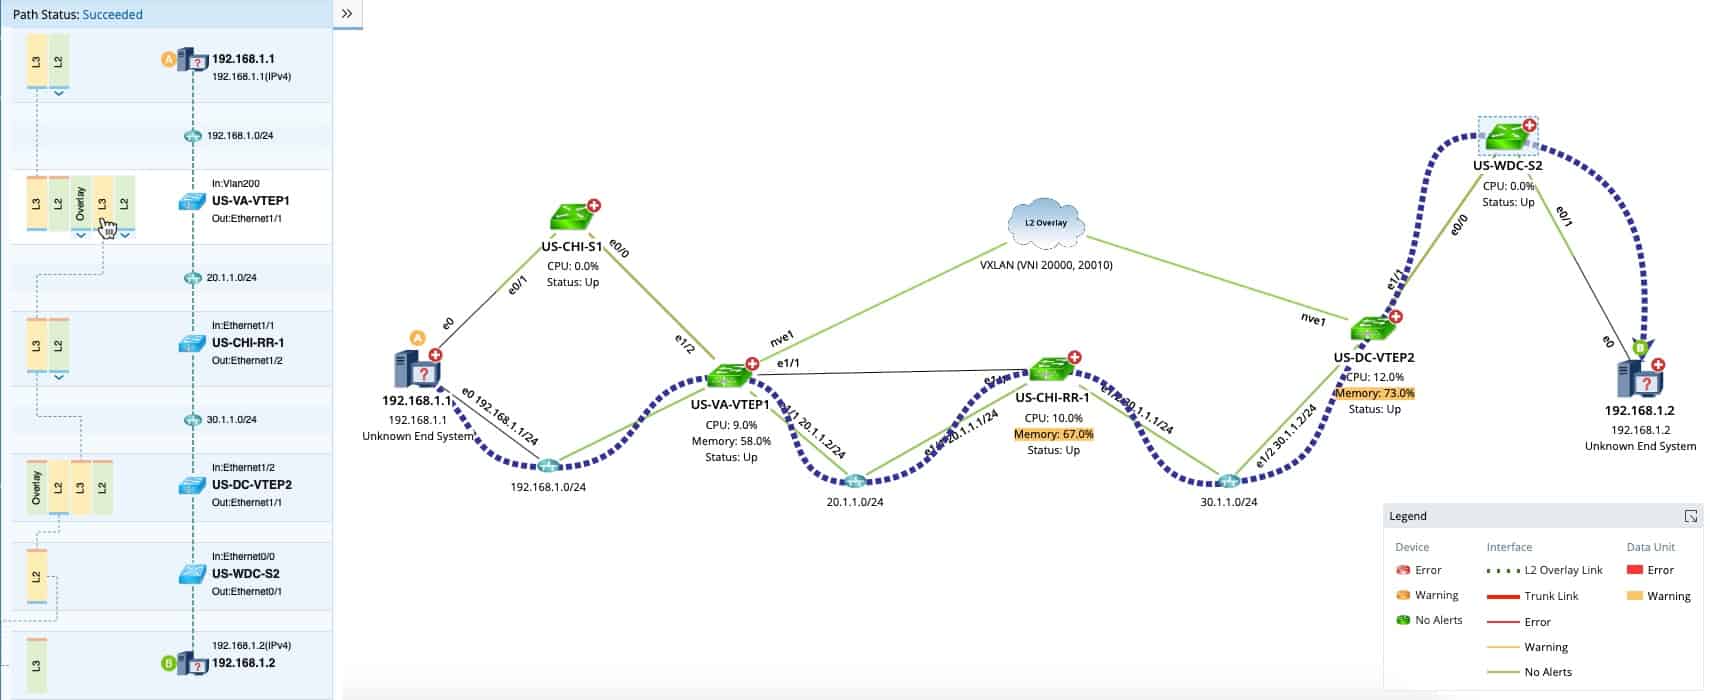
NetBrain is a network monitor and SDN monitoring tool that can monitor Cisco ACI and VMwareNSX environments. NetBrain has an auto-discovery feature that automatically identifies hybrid network infrastructure. Once your network has been discovered you can view it as a Dynamic Map. The Dynamic map shows you how all your devices connect to each other.
Key Features
- Dynamic Mapping: Utilizes auto-discovery to map out network infrastructure, simplifying visualization.
- Path Analysis: Offers detailed path tracing for troubleshooting and optimization.
- Automated Diagnostics: Generates root cause analysis automatically, enhancing problem resolution.
Why do we recommend it?
NetBrain is a network automation platform and its functions can include data gathering for the monitoring of hybrid systems, such as SD-WANs that connect sites and cloud services. The service provides assistance for connection optimization through traffic management as well as triggered solutions to network problems.
The visibility doesn’t stop at the surface and you can also view the performance of applications on the infrastructure you’re monitoring. You’ll be able to see what infrastructure an application relies upon in order to function.
With the diagnostic capabilities of NetBrain, you aren’t limited to running manual troubleshooting. Whenever a performance issue is detected NetBrainautomatically starts to run diagnostics to find the cause of the problem. You will be sent an alert as well to make sure that you don’t miss out on anything important.
Who is it recommended for?
NetBrain is a good choice for businesses that are setting up virtual networks. The system can automate a range of tasks, such as configuration management, security monitoring, and performance tracking. The system lets you set up workflows for quick adjustments to systems, such as a Cisco ACI.
Pros:
- Clutter-Free Design: Employs straightforward graphics for an uncluttered, efficient user interface.
- Comprehensive Discovery: Automatically detects a wide range of devices, including Cisco ACI components, for a thorough network overview.
- Proactive Troubleshooting: Initiates diagnostic scans automatically upon detecting performance issues, minimizing downtime.
- Versatile Mapping: Excellently suited for illustrating complex network environments, aiding in both planning and troubleshooting.
Cons:
- Pricing Transparency: Pricing details are not readily available, requiring potential users to contact sales for information.
- Feature Set: There’s a desire for more immediate, out-of-the-box functionality to enhance user experience.
- Data Analysis: The tool could benefit from more advanced capabilities in historical data analysis for deeper insights.
Overall if you’re looking for Cisco ACI monitoring software that cuts straight to the point, NetBrain is an excellent choice. Features like Dynamic maps really help to make sense of abstract networks. If you want a quote for NetBrain you’ll have to contact the company directly. There is also a demo you can sign up for.
4. SevOne
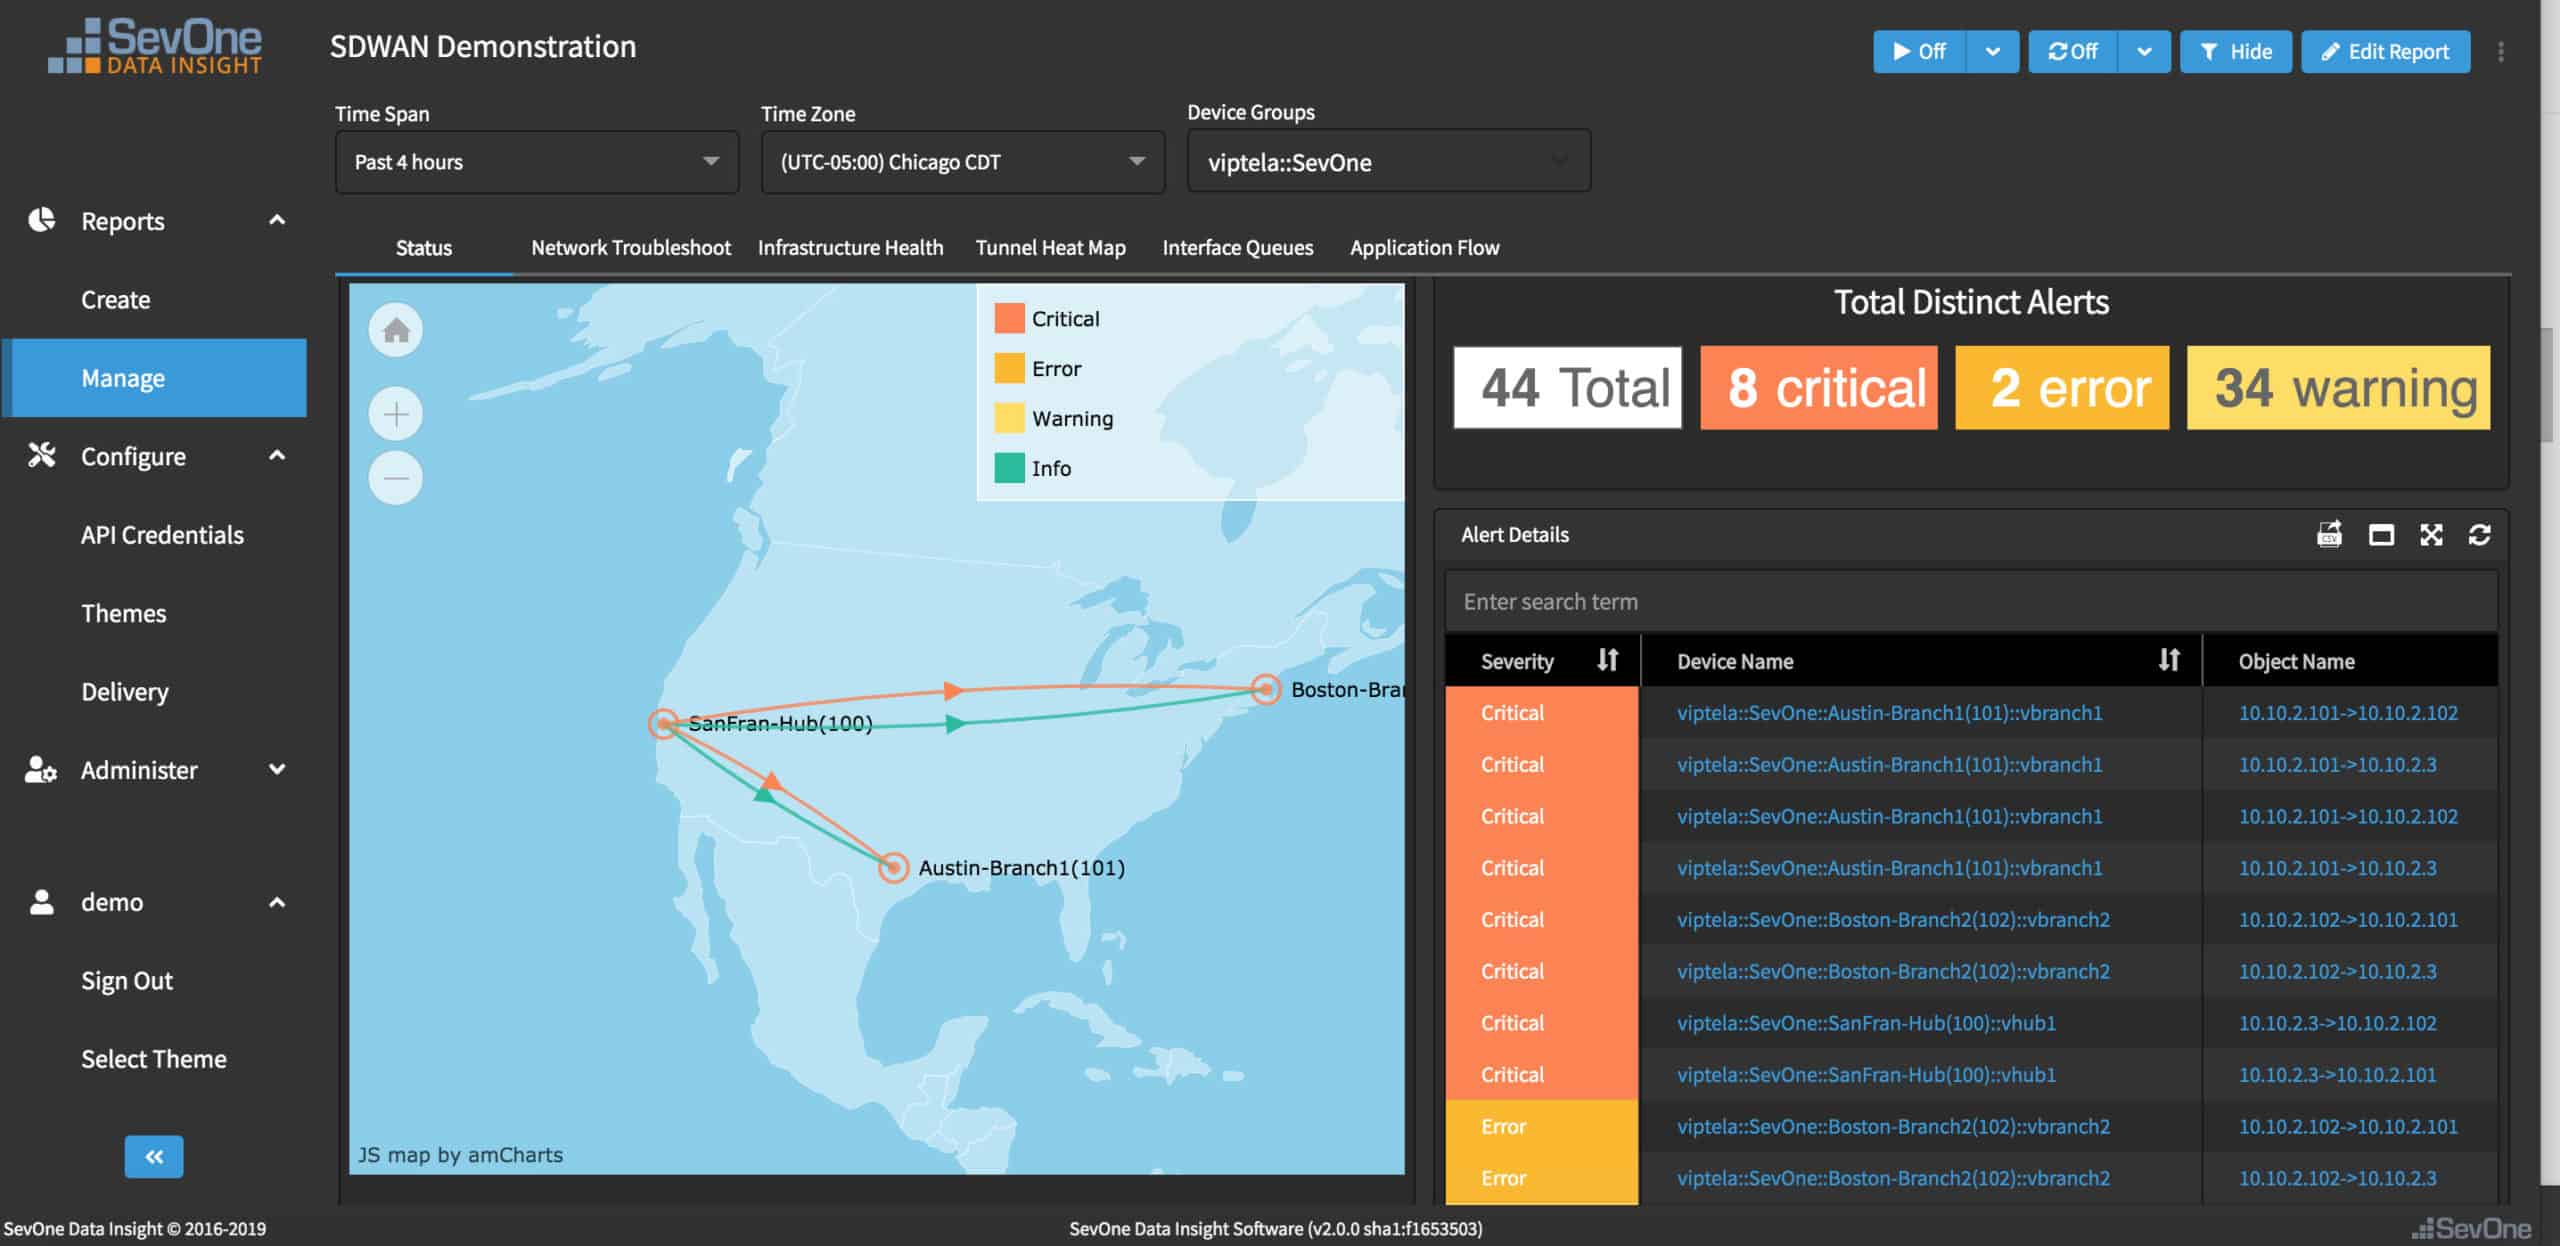
SevOne is a piece of infrastructure monitoring software that works with Cisco ACI. SevOne has ten dashboards that you can use to monitor the health and performance of Cisco ACI infrastructure. For example, you can view the health scores of endpoints and multi-cluster deployments. The platform is designed to allow you to monitor a legacy-based network alongside the SDN in one platform.
Key Features
- Diverse Views: Offers multiple perspectives on network performance, enhancing diagnostic capabilities.
- Network Visualization: Automatically maps out the network, simplifying the understanding of its structure.
- Performance Alerts: Notifies users of any issues, ensuring quick response times.
Why do we recommend it?
IBM SevOne Network Performance Manager is a connection tracking and management system to provide optimized traffic flows for applications. This system is designed to enhance application bundles that involve components hosted on multiple servers and cloud platforms – the type of system that would run over a Cisco ACI network.
The use of SevOne complements Cisco ACI very well with respect to performance transparency. Through the dashboard, you can view the performance data of multiple APIC clusters in real-time. In addition, there are performance baselines which the program uses to send you an alert when something out of the ordinary happens.
Who is it recommended for?
This package is a monitoring system as well as a management tool. You would need to be constructing and running a hybrid application workload in order to justify using this package. The IBM system is very similar to the NetBrain and ScieneLogic packages so you should compare these three services before buying.
Pros:
- Unified Monitoring: Seamlessly combines traditional and SDN monitoring in a single platform for comprehensive oversight.
- ACI Focused: Tailored specifically for Cisco ACI environments, enabling targeted monitoring and management.
- Cluster Tracking: Efficiently monitors multiple ACI clusters, utilizing performance baselines for proactive alerts.
- User-Friendly Interface: Features a clean dashboard with easy-to-use widget customization for tailored monitoring.
Cons:
- Pricing Transparency: Requires direct contact with sales for pricing information, limiting upfront cost assessment.
- Limited Reporting: Could benefit from more intuitive reporting features to enhance data analysis and decision-making.
SevOne gives you a mix of automation and control that offers an excellent SDN monitoring experience. The dashboard offers enough visibility to eliminate the opacity of Cisco ACI. In order to view the price of SevOne, you’ll have to contact the sales team directly. You can also sign up for a demo.
5. SolarWinds Network Performance Monitor
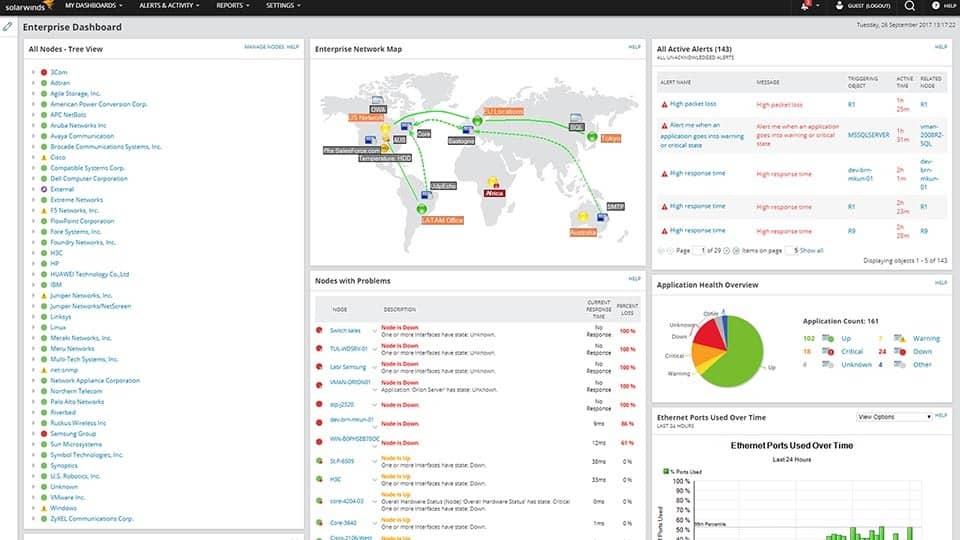
SolarWinds Network Performance Monitor is a network monitoring tool that can access Cisco ACI. You can view health scores for components like APIC tenants, spines, and leaves through PerfStack Performance Analysis Dashboards.
Key Features
- Comprehensive Monitoring: Offers a unified view from network services to applications, enhancing visibility.
- Device Tracking: Monitors the status of all network devices for timely updates.
- Geographic Insights: Displays the geographical locations of network resources for better planning.
Why do we recommend it?
The SolarWinds Network Performance Monitor will track the statuses of all your network devices, not just those of Cisco or those that connect your virtual network. This system is based on the Simple Network Management Protocol (SNMP) to contact all devices. This enables the system to create a map that can include SD-WAN structures.
There is also more detailed visibility into the health of Nexus switches. For example, you can view a chart on Interfaces with High Percent Utilization to see if there’s a problem with your network.
You also have access to alert systems that can alert you when the health scores of tenants endpoints, applications, or physical hardware drop below an acceptable level. The notifications system is great because it keeps you updated on changes to your environment automatically.
To help increase visibility, SolarWinds Network Performance Monitor allows you to visualize ACI relationships in Orion Maps. Orion Maps are essentially topology maps and allow you to view your ACI fabric from a geographical perspective. From here you can see how elements like APIC tenants, EPGS and application profiles connect to each other. These are color-coded so that you can easily monitor the health of these components.
Who is it recommended for?
You don’t need to be constructing a virtual network in order to use this tool. The service is particularly strong at discovering and documenting networks. The system will continuously check on all network devices and identify any status problems. This is a good choice for large companies with complicated networks.
Pros:
- Wide-Ranging Access: Seamlessly integrates with Cisco ACI, offering broad monitoring capabilities across your network infrastructure.
- Real-Time Topology: Dynamic auto-discovery generates up-to-date network maps and inventory, enhancing operational awareness.
- Enhanced Visibility: Combines SNMP monitoring with packet analysis for a comprehensive network oversight.
Cons:
- Complexity: Its extensive feature set requires a steep learning curve, which might be challenging for new users.
- Price Consideration: The starting price point may be prohibitive for smaller organizations without substantial IT budgets.
If you’re looking for a Cisco ACI monitoring tool that doubles as an infrastructure monitoring platform, you can’t go wrong with SolarWinds Network Performance Monitor. The product starts at a price of $2,995 (£2,464). You can download the 30-day free trial.
6. ScienceLogic SL1
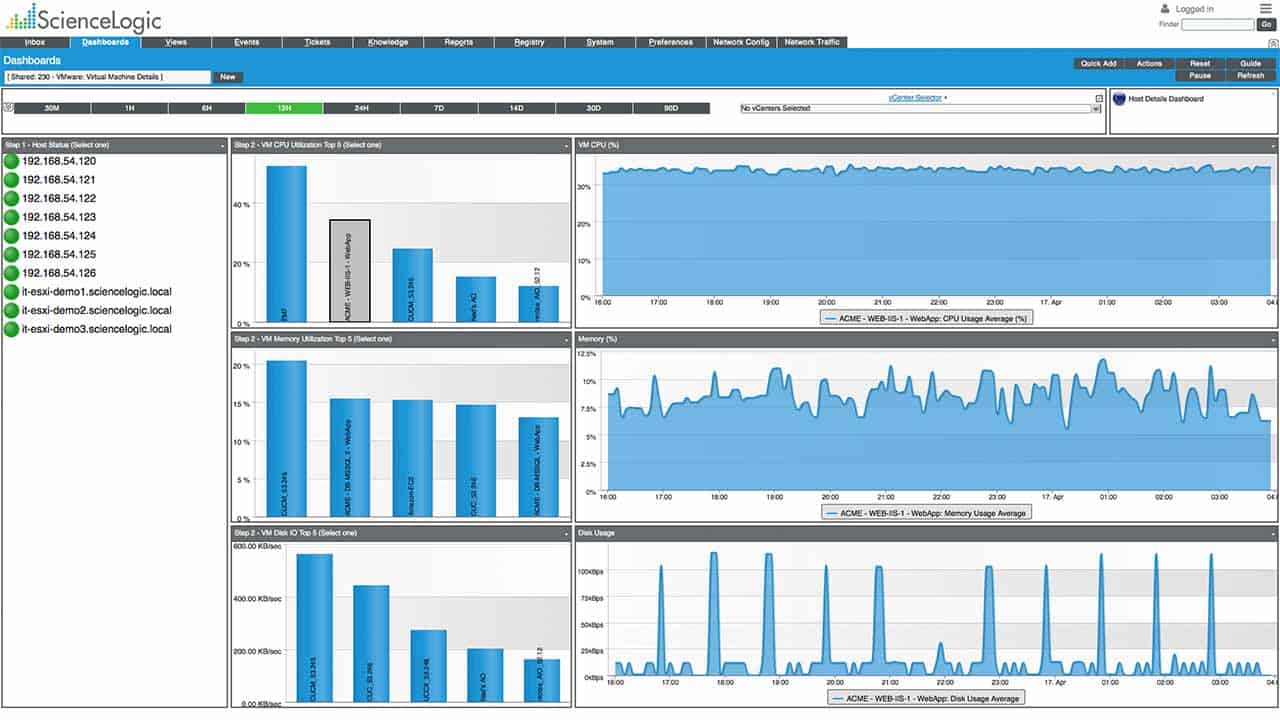
ScienceLogic SL1 is a network monitor with the ability to monitor Cisco ACI performance. The tool has customizable dashboards for the user to monitor ACI performance. Autodiscovery automatically discovers APICs, spines, leaves, applications, tenants, applications, EPGs, bridge domains, and more. Once these have been discovered the program collects data on Health Scores, Fault Counts, Configuration Information, and more to measure performance.
Key Features
- Comprehensive Discovery: Automatically identifies and maps ACI components like APICs, spines, leaves, and more.
- Custom Dashboards: Allows for personalized monitoring views, catering to specific user needs.
- ACI Element Tracking: Pinpoints key ACI elements and their performance metrics for detailed oversight.
Why do we recommend it?
ScienceLogic SL1 is a platform that monitors and maintains hybrid networks. Virtual systems need to be adjusted periodically to ensure that all capacity is available for critical applications. The many components involved make capacity calculations complicated. The AI mechanism in SL1 is able to ripple calculations through all elements to keep the network running.
Like other top ACI monitors, ScienceLogic SL1 creates dynamic maps of your SDN so you can see how applications and services connect to each other. If a certain application is experiencing performance difficulties you’ll be able to see very easily from this perspective.
Monitoring in ScienceLogic SL1 also covers traditional networking very well. You can view metrics like network traffic and packet loss that affect the availability of your network. The ACI-centric monitoring features and general network monitoring features give you a 360-degree view of network performance.
Who is it recommended for?
The AI-based automatic system adjustments in the SL1 package provide automated management of virtual networks. So, this is a high-end system that would only be needed by large hybrid systems. Small businesses probably wouldn’t need all of the features of this system. The package also provides network performance monitoring.
Pros:
- Hybrid Network Mastery: Offers advanced visibility and mapping for both cloud-native and on-premise applications, ideal for complex environments.
- AI-Driven Management: Utilizes AI for automatic network adjustments, ensuring optimal performance across all elements.
- Visual Insights: Provides highly visual dashboards, facilitating effective monitoring by NOC teams.
Cons:
- Access to Pricing: Requires engagement with sales to obtain pricing details, hindering immediate evaluation.
- Demo Requirement: Lacks a free download option, necessitating a scheduled demo to explore the tool’s capabilities.
- Interface Complexity: The dashboard may become cluttered in extensive enterprise network monitoring scenarios, potentially complicating user experience.
ScienceLogic SL1 offers an ACI monitoring experience that provides all the detail you could possibly need to manage your virtual environment. However, you’ll have to contact the company directly to view a quote. You can request a demo version.
7. Zenoss
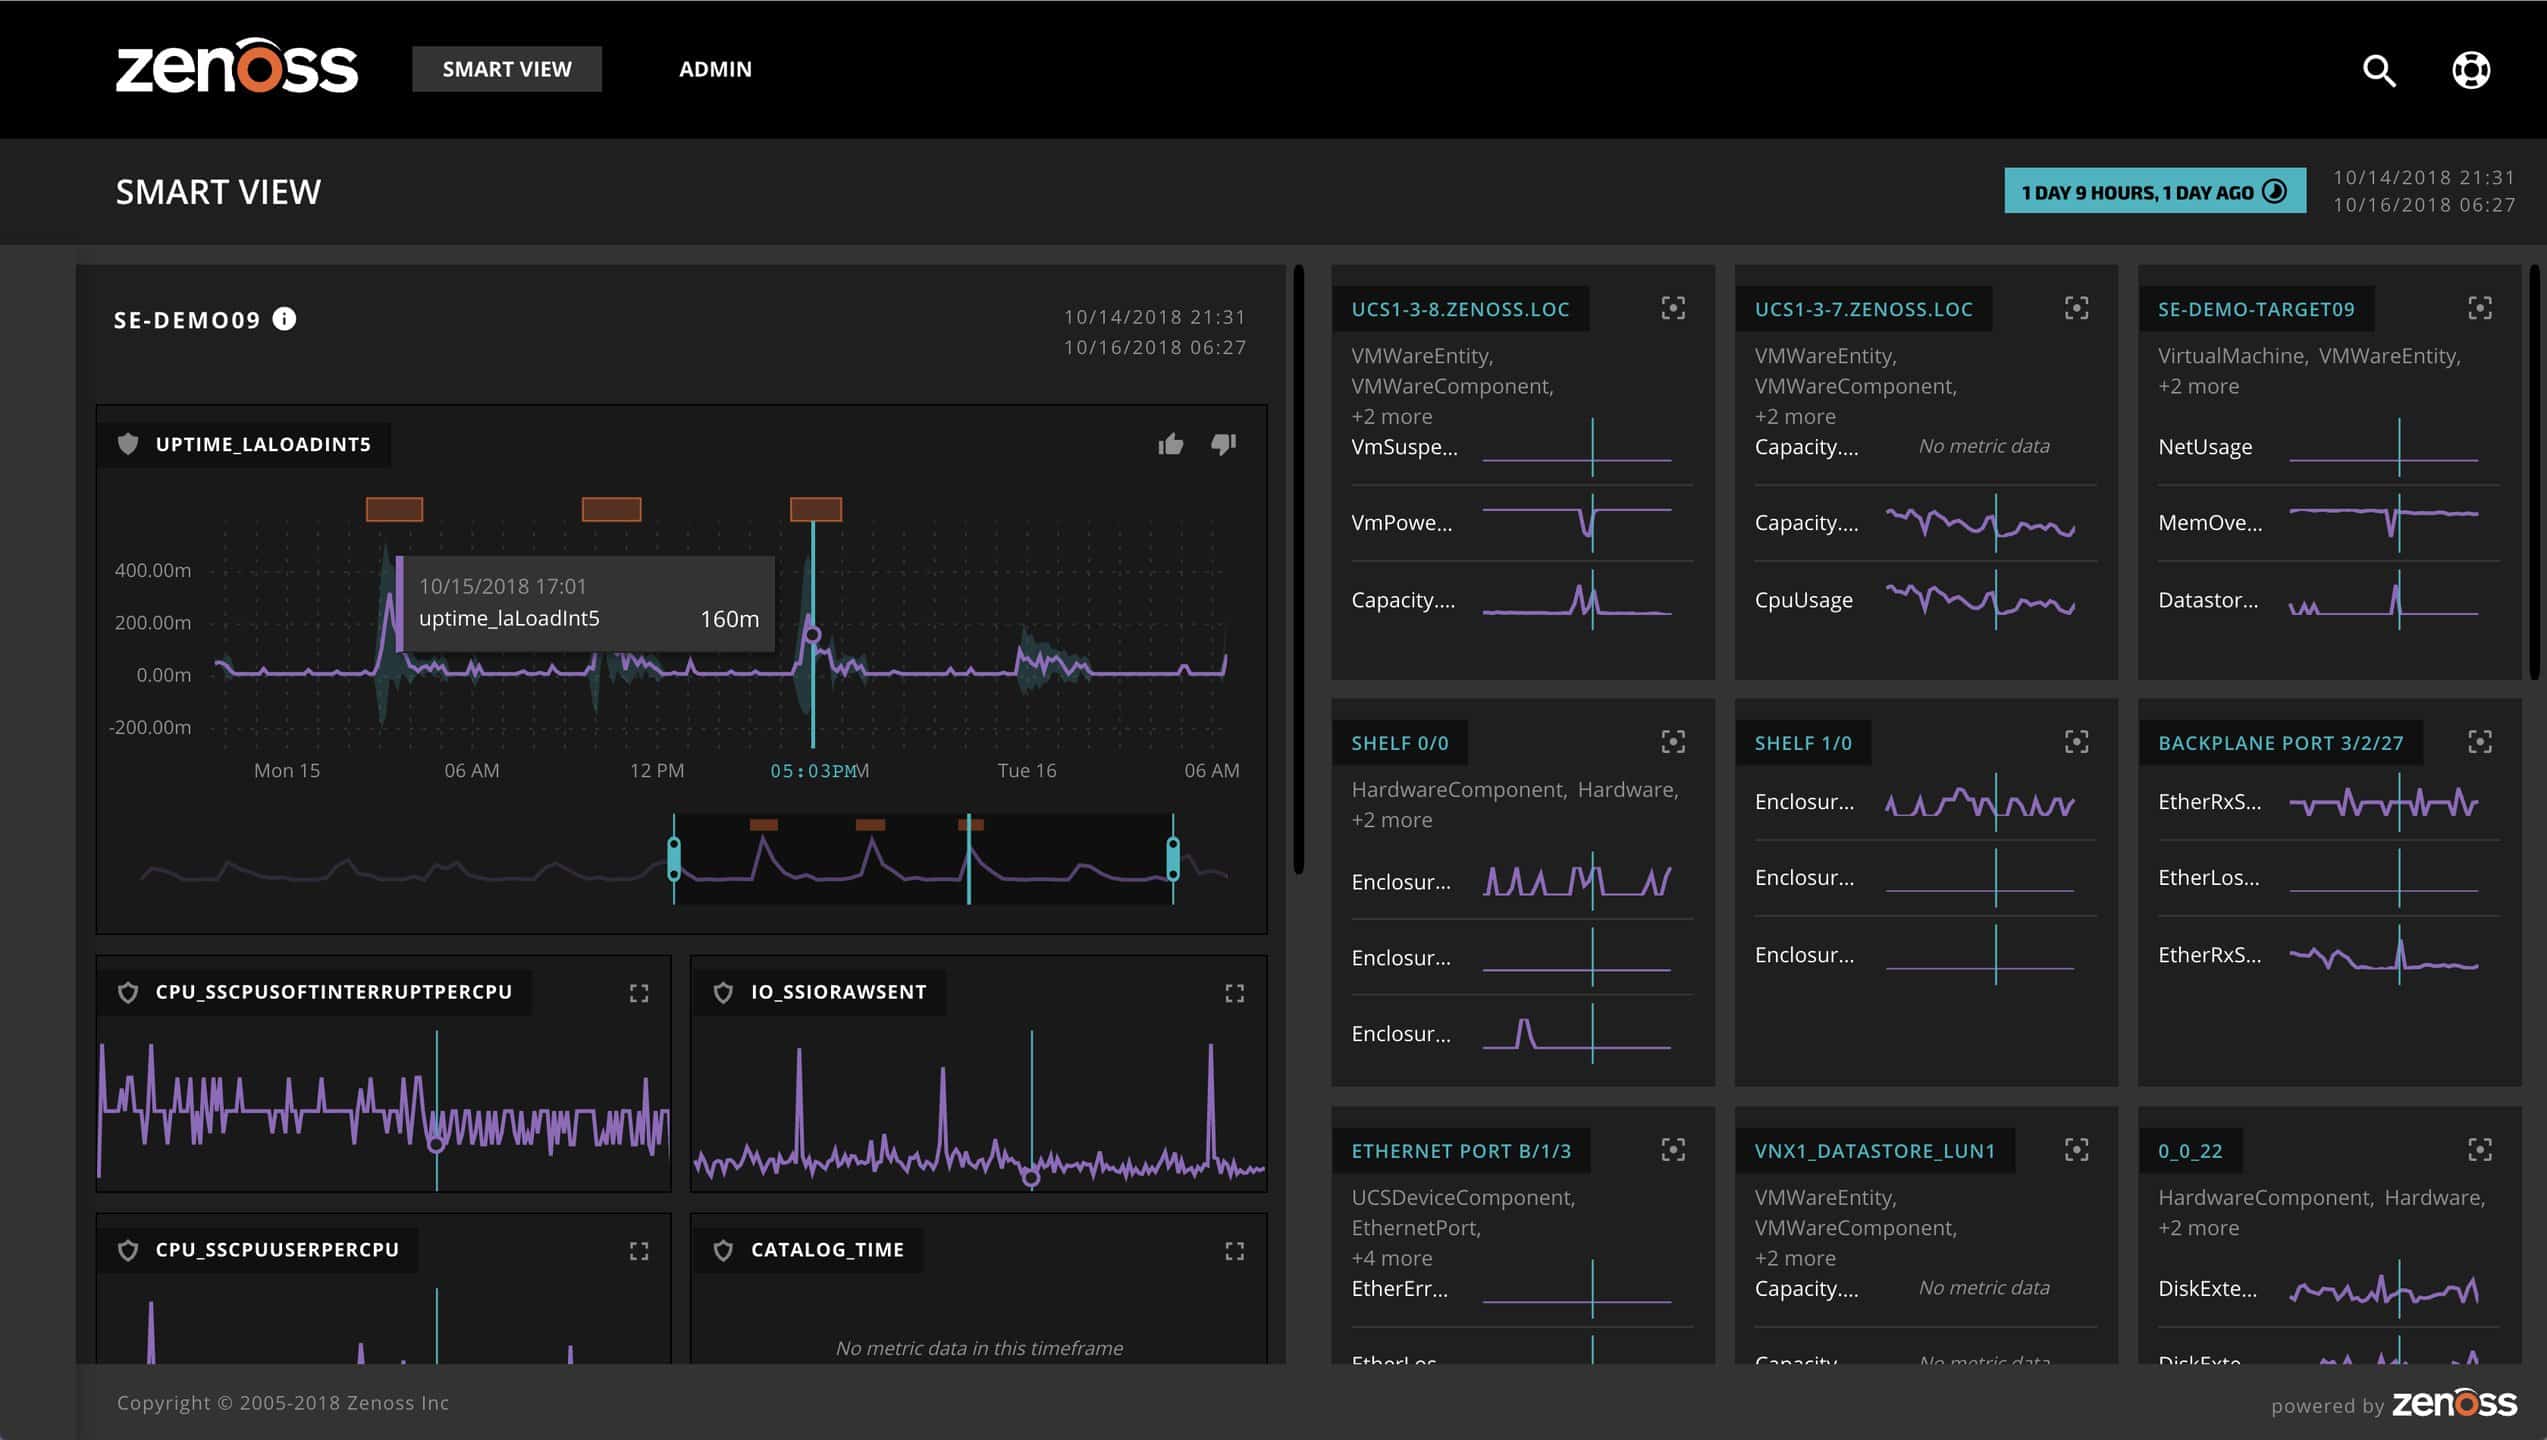
Zenoss Cloud is a cloud-based monitoring solution that also acts as an ACI monitor. This unified platform allows you to monitor Cisco ACI performance in real-time.
Key Features
- Flexible Pricing: Offers options for both free and premium users, accommodating various budgetary needs.
- Full-Stack Monitoring: Provides comprehensive monitoring capabilities across infrastructure layers, all from a cloud-based platform.
- Cloud-Native: Designed as a cloud-based solution, facilitating scalable and remote monitoring capabilities.
Why do we recommend it?
Zenoss is an expandible full-stack monitoring tool and its ability to monitor networks, applications, and services makes it ideal for keeping track of software-based infrastructure, such as the virtual networks that you can set up with a Cisco ACI package. It will track straightforward on-premises systems as well.
The platform monitors network health and events for ACI tenants and applications. The dependency map helps show users the structure of their virtual environment and highlights the status and logical relationships between tenants and applications.
To speed up the resolution of performance problems and events, Zenoss uses deep analytics. Deep analytics automate the diagnostic process and enable the user to find the root cause of issues much faster.
There is a list of problems ranked with additional details like Confidence, Status, Severity, Resource, Component, Event Class, Summary and more. When put together all this information helps you to keep a close eye on network events.
Who is it recommended for?
Zenoss is available as a cloud platform and as an on-premises system. The Zenoss Cloud version includes storage space for metrics but with the on-premises version, you need to sort that out yourself. The free version, called Zenoss Core, has been discontinued. Zenoss Cloud is available in an architecture for managed service providers.
Pros:
- Versatile Monitoring: Capable of overseeing networks, applications, and services, making it suitable for complex infrastructures.
- Automated Discovery: Efficiently identifies and integrates new devices into the network monitoring setup without manual intervention.
- Community Support: Benefits from a wide array of Cisco ACI plugins developed by the Zenoss community, enhancing its functionality.
- Multi-Site Capability: Excellently supports extensive networks, including both LAN and WAN environments, for broad operational coverage.
Cons:
- Support Limitations: Only available for paying customers, which could restrict access to assistance for users of the free version.
- User Interface: The dashboard could be more user-friendly, with improvements needed for easier navigation and access to features.
There are two versions of Zenoss Cloud available to purchase: Zenoss Cloud Professional and Zenoss Cloud Enterprise. The Professional version includes 40k data points per day per resource and 3 months of data retention. The Enterprise version includes 120k data points per day per resource and 15 months of data retention. You can request a demo of the product.
The SDN of this Generation
As an SDN, Cisco ACI has helped many users to chart more abstract computing models. The policy-based philosophy of ACI has simplified the process of managing virtualized services dramatically.
The days of administrators drawing up ACLs are long gone as more companies resort to automation to manage modern networks and cloud computing environments. Despite ACI’s accomplishments, it still needs to be coupled with a performance monitor to manage service performance. All of the tools mentioned on this list are fit for that purpose.
Cisco ACI Monitoring FAQs
How do I monitor Cisco ACI?
The Cisco ACI can be monitored by accessing the APIC user interface. However, it is far easier to get an automated monitoring tool that can cover all layers of hardware, software, and services that support the ACI.
What are the three main components of Cisco ACI?
There are three elements that create the Cisco ACI. These are:
- The Cisco Application Policy Infrastructure Controller (APIC), which is a centralized policy management system
- Cisco ACI Fabric hardware
- A Cisco Application Virtual Switch (AVS)
What are the benefits of Cisco ACI?
Cisco ACI is an intent-based networking framework. It enables you to maintain an apparent network while being free to alter the underlying resource supporting that structure. It is a virtualization of a network that minimizes disruption when you need to make changes to improve performance and expand capacity.

