
A virtual environment offers a way to extend the utilization of onsite resources. It’s a common solution on most business networks thanks to the ease of using VMWare and Microsoft’s Hyper-V virtual machine (VM) software. However, when it comes to resource monitoring, the extra layer of traffic that is inevitable with VM setups can make resource mapping complicated. Once your business grows, keeping track of that VM solution can quickly get out of hand.
Here is our list of the Best VM Monitoring Tools:
- NinjaOne EDITOR’S CHOICE This cloud platform provides remote monitoring and management (RMM) tools that include Hyper-V and VMware monitoring utilities. Get a 14-day free trial.
- Paessler PRTG Network Monitor (FREE TRIAL) A wider network, server, and application monitoring suite that includes specialized monitoring functions for Citrix Xen, Microsoft Hyper-V, VMWare, Parallels Virtuozzo Containers, and Amazon EC2. Get a 30-day free trial.
- eG Enterprise VM Monitoring (FREE TRIAL) Monitoring system for VMware vSphere, Citrix XenServer, Microsoft Hyper-V, Oracle VM Server, Red Hat Enterprise Virtualization, AIX LPARs, Solaris Container virtualizations. Access a 30-day free trial.
- Site24x7 Virtualization Monitoring (FREE TRIAL) Cloud-based service that enables you to monitor Hyper-V and VMWare virtualization performance plus AWS and Azure Cloud VM implementations. Access a 30-day free trial
- ManageEngine OpManager (FREE TRIAL) A package of monitoring tools for networks and servers that includes tracking services for VMWare, Hyper-V, Nutanix, and Citrix hypervisors. Available for Windows Server and Linux. Start a 30-day free trial.
- Acronis Cloud Manager (FREE TRIAL) This tool, formerly 5Nine Cloud Manager, monitors Microsoft-based VMs run with Azure and Hyper-V. Access the free trial.
- LogicMonitor Cloud-based network monitoring service that includes coverage for VMware vCenter, ESXi, Microsoft Hyper-V, and Citrix XenServer.
- Veeam One Resource monitoring tool that monitors all of the hardware, software, and services that contribute to VMWare vSphere and Hyper-V virtualization.
- Quest Foglight Virtualization monitor for Citrix Xen, VMWare, and Hyper-V that runs on Windows, Linux, and Solaris.
- Sematext Infrastructure Monitoring This cloud platform is able to track the performance of JVM, containers, and other services as well as physical servers.
- SolarWinds Virtualization Manager This on-premises monitoring package is able to track the performance of cloud-based virtual servers as well as network-located hypervisors.
- Progress WhatsUp Gold Virtualization Monitoring Add-on Addition to the core WhatsUp Gold network monitoring system.
- ESXi Embedded Host Client Free ESXi client monitor provided by VMWare.
- Turbonomic This tool monitors onsite VMware, Hyper-V, and XenServer implementation and offsite Cloud resources.
Virtual machine monitoring helps you stay on top of resource issues when allocating resources from one virtual machine to another. Network traffic issues are inevitable when making remote resources available instantly and locally. You need to track demand and adapt resources to keep network users happy. Capacity planning is a key part of VM management, and monitoring utilization helps you stay ahead of demand and keeps response times low.
The integration of cloud-based resources is a standard feature of business systems nowadays. Traditional virtualization methods formed the foundation of communication between onsite terminals and offsite applications and file servers. So, getting a VM monitoring tool that recognizes your servers, whether they be onsite or in the cloud is an essential requirement for any system tool.
The best VM monitoring tools and software
We have put together an analysis of the best VM monitoring solutions and produced a list of utilities that you should consider when shopping for software.
Our methodology for selecting VM monitoring software
We reviewed the market for VM monitoring software and analyzed the options based on the following criteria:
- A system that can analyze physical server resource usage as well as the activities of the virtual environment
- A live monitor with graphical data interpretations for instant performance comprehension
- Analysis tools for performance assessments based on saved statistics
- Performance thresholds that raise alerts when performance drops or resources run low
- Support for remapping VMs to servers and adjusting resource allocations
- A free trial period for a no-cost assessment or a free tool
- A system that saves time and money in VM monitoring, repaying its purchase price
These VM monitoring tools are industry leaders and will save you time when tracking your virtual device environment. The following section gives you information on each of these VM monitoring tools.
1. NinjaOne (FREE TRIAL)
NinjaOne is a remote monitoring and management (RMM) package that is delivered from the cloud. This system includes automated monitoring services that track the performance of VMware and Hyper-V implementations.
Key Features:
- Monitors VMs: Hyper-V and VMware
- Part of an RMM: Monitors networks, servers, services, and software
- Part of Endpoint Monitoring: Notes host resource availability
Why do we recommend it?
NinjaOne is a comprehensive package that isn’t limited to monitoring VMs. It will also monitor networks, servers, and applications other than virtualizations. This RMM can monitor cloud services as well as on-premises resources. This system has a high degree of automation to improve the productivity of technicians and provide value for money.
The package implements a discovery service that populates the monitoring console with all of the virtualization instances that it identifies. The discovery process repeats continuously to spot new instances and changes in the configurations of existing implementations.
The inventory of VMs includes static details, such as the brand, the version number, and the license conditions. The tool also records the most recent continuous uptime period.
The types of performance metrics that this package assesses include those related to the physical hosts, such as power, battery status, temperature, and fan speed. Looking at the interaction between the virtual host and its supporting server, the system records memory, CPU, and disk usage with respect to the total availability of those resources.
The system shows VM allocations and activity that enables a network administrator to adjust allocations according to heavy demand or inactive units. All of the statuses can be stored as reports and so can historical usage data.
While noting total available resource capacity and current usage, the system is able to trip thresholds, which can be adjusted. These raise alerts if they are crossed. The purpose of the thresholds is to give advanced warnings about possible resource shortages.
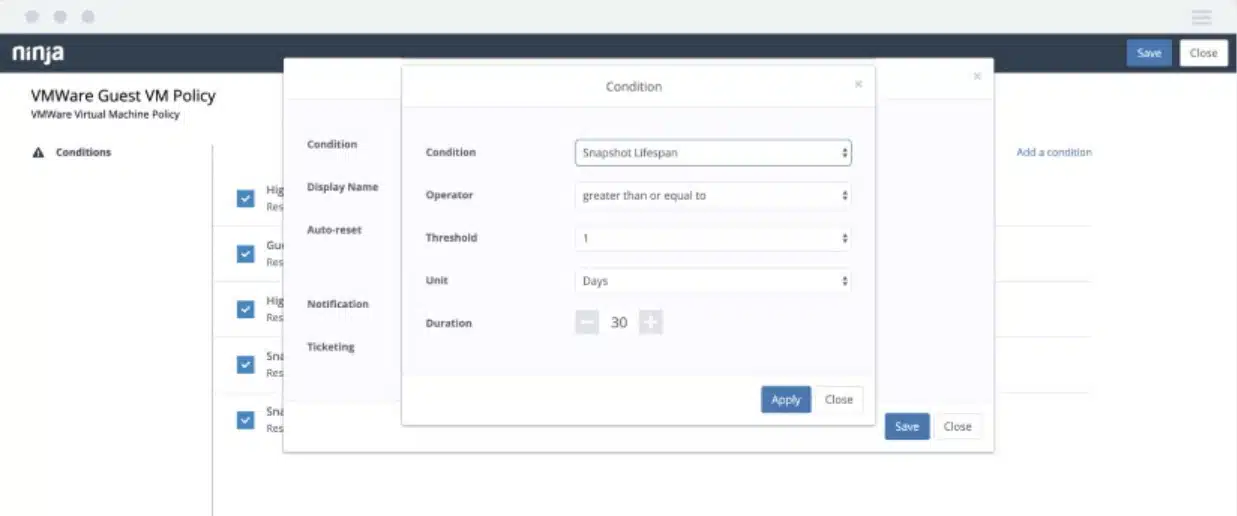
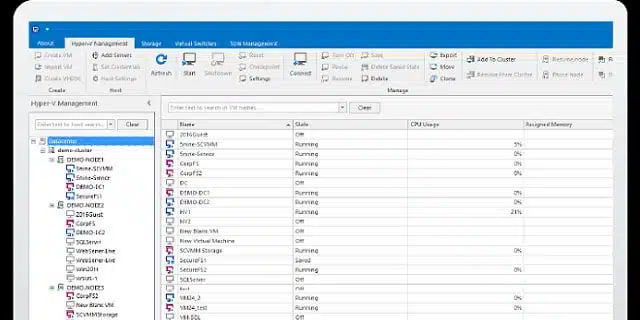
VM management functions in the package include the ability to create, store, and delete snapshots. Administrators can also use the NinjaOne interface to start, stop, and reset VMs. All of the functions of the NinjaOne system can be applied equally to Hyper-V and VMware and the screens can show statistics from both simultaneously – if anyone uses both bands on one site.
Who is it recommended for?
This system is available in a multi-tenanted architecture for managed service providers (MSPs). This enables the MSP to set up sub-accounts to keep the data of their clients separate. The cloud-based package includes a Help Desk ticketing system, which is useful for both MSPs and IT departments. An IT support team could also use the RMM and its Help Desk service.
Pros:
- Watches Virtualization Resource Usage: Identifies physical resource shortages
- Snapshot and Checkpoint Management: Assesses space availability for snapshot storage
- Virtualization Controls: Start, stop, and reset VMs
Cons:
- VM Monitoring not an Independent Service: Only available as part of an RMM
This cloud-based system is able to manage multiple sites simultaneously across the internet through the installation of an agent on each site. You can assess the NinjaOne package with a 14-day free trial.
EDITOR'S CHOICE
NinjaOne is our top pick for a VM monitor tool because this package monitors Hyper-V and VMware hypervisors as part of its remote monitoring and management (RMM) package. This system will simultaneously also monitor networks and servers, which enables you to follow the resource usage of your VMs and possibly identify the root cause of VM performance problems. The value of this cloud-based package is that it increases the productivity of support technicians by removing the need for them to watch the monitoring console. This gives them the opportunity to get on with system management tasks and communications with users. The package also includes a Help Desk ticketing system. The RMM includes a system of alert thresholds that will flash a warning in the console if a component, such as a VM develops a problem. The existence of alert triggers at every level of the system monitoring tool will automatically give you a root cause analysis when problems need to be investigated quickly and fixed.
Download: Get a 14-day free trial
Official Site: https://www.ninjaone.com/freetrialform
OS: Cloud based
2. Paessler PRTG Network Monitor (FREE TRIAL)
Paessler produces a great network monitoring solution that covers both network device monitoring and traffic analysis. This service integrates functions to track VM performance. Although Paessler PRTG Network Monitor is a full-service network monitor, it does come in a free version. Paessler sets its prices on the number of sensors that the system monitors. A “sensor” is a service aspect, such as network speed, or a monitoring point, such as a port. PRTG is aimed at large networks, but the free version would be suitable for small businesses.
Key Features:
- Monitors Multiple Virtualizations: VMware, Hyper-V, and Citrix
- Full Stack Monitoring: Also monitors networks, servers, services, and cloud platforms
- Correlates VM Activity with Server Resources: Checks on CPU, memory, and disk usage
Why do we recommend it?
Paessler PRTG Network Monitor is a bundle of monitoring tools that cover software and servers as well as networks. This full-stack capability is great for monitoring the activities of virtualizations. The tool has specific monitoring sensors for tracking the performance of Hyper-V, Citrix, and VMware as well as cloud platforms and containers.
The VM application monitoring capabilities of Paessler PRTG extend to the following platforms:
- Citrix Xen
- Microsoft Hyper-V
- VMWare
- Parallels Virtuozzo Containers
- Amazon EC2
The capabilities of the monitor give you the ability to monitor your whole network with this tool, not just the virtual environment. The underlying network traffic analysis works on typical messaging systems that are part of the firmware of the major network equipment manufacturers. Physical network devices are monitored via the SNMP system. PRTG extends network monitoring across sites and into the cloud.
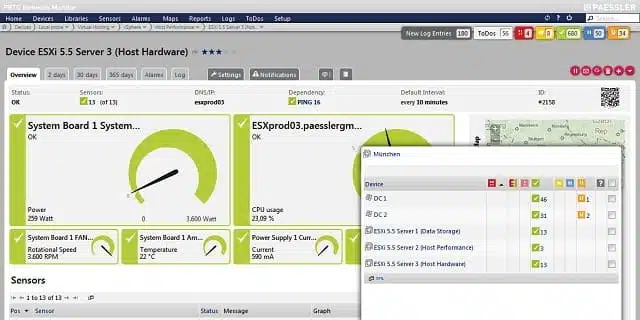
Server performance monitoring focuses on CPU load, disk usage, and network transmission speeds. Physical aspects of host machines that PRTG monitors include the server’s temperature, current power consumption, battery voltage, and fan speed.
Those server metrics lead to service highlighting that will warn you of overloaded servers. With this knowledge, you can redistribute VMs across servers to gain a fairer load and better performance. You can set your performance warning levels across server attributes. These custom alerts let you see which servers are overloaded. Warnings appear in the dashboard, but you can also have them sent by SMS, email, or through an API.
Both the dashboard and notifications can be filtered to create custom views with limited controls for different team members. You can send notifications to different recipients according to warning source or severity.

Who is it recommended for?
Paessler PRTG is a software bundle for Windows Server. However, if you don’t have that operating system, you can opt to access the service as a SaaS package. The tool’s price depends on how many sensors you want to activate and if you only use 100, the system costs nothing.
Pros:
- Alarms for Performance Problems: Sent as notifications by email or SMS
- Displays internal Virtualization Performance: Shows the host activity alongside all dependent VMs
- Examines Supporting Platforms: Windows, Linux, and AWS
Cons:
- Requires Multiple Sensors: Pick a sensor for your VM brand but you will also need to activate server monitoring sensors
The free PRTG is limited to 100 sensors. You can also get a 30-day free trial of the full system, which has no limit on the number of sensors that you can monitor.
3. eG Enterprise VM Monitoring (FREE TRIAL)
The eG Enterprise monitoring system, from eG Innovations, covers VMware vSphere, Citrix XenServer, Microsoft Hyper-V, Oracle VM Server, Red Hat Enterprise Virtualization, AIX LPARs, Solaris Container virtualizations and their supporting infrastructures. The big selling point behind eG Enterprise’s VM monitoring is that checking on server memory and CPU utilization doesn’t give you the whole picture of virtualization health. You also need to see issues that arise on the network, on the storage server, in the database, or within the virtualization platform software.
Key Features:
- Monitors Multiple Virtualizations: VMware, Citrix, Hyper-V, Nutanix, Oracle VM Server, Red Hat Enterprise Virtualization, and AIX LPARs
- Also Monitors Container Technologies: Docker, Red Hat OpenShift, and Kubernetes
- Relates VMs to Applications: Documents the application and the supporting VM together
- Root Cause Analysis: Identifies whether the VM, the network, the server, or the application is to blame for performance problems
Why do we recommend it?
eG Enterprise VM Monitoring has the edge over the SolarWinds tool in that it can monitor more hypervisor brands. It has the capability to monitor VMware vSphere, Citrix XenServer, Microsoft Hyper-V, Oracle VM Server, and Red Hat Enterprise Virtualization. It can also track containers and AIX logical partitions.
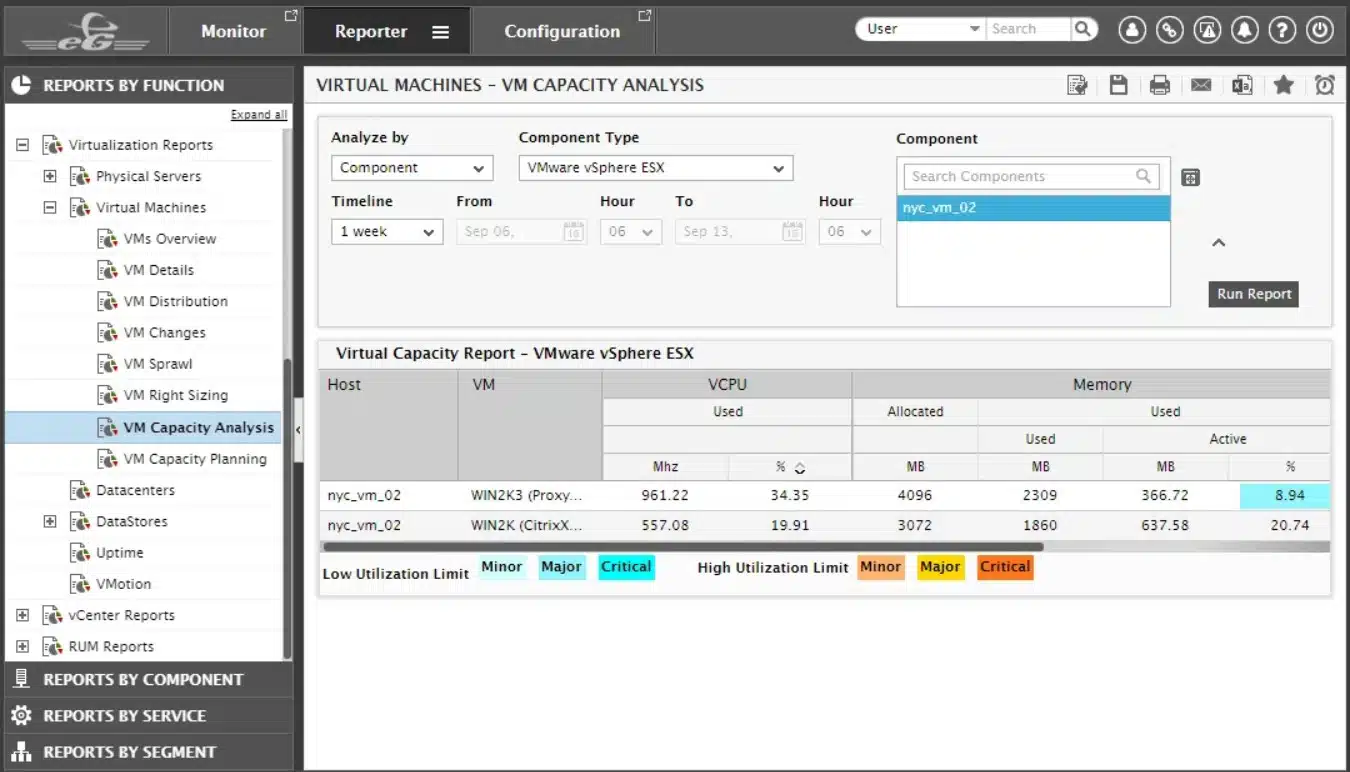
The interface for the system is browser-based. It includes graphical displays, lists of live data and alerts, and sections to assist with capacity planning. The links between resources are mapped in the dashboard when you install the system. eG Enterprise is particularly strong at identifying resource interdependence. Examples of these relationships include application and VM platform interaction and the underlying physical infrastructure needs of the VM software. That baseline informs the rule base of eG Enterprise on alert conditions that impair the performance of the environment.

Not only will you receive alerts that the response times of a particular VM is slow, for example; you will be notified if the database is overloaded and whether that is causing a particular VM to perform poorly.
The ability to identify the root cause of performance issues at the lowest levels gives eG Enterprise its power. This means you don’t have to waste time back-chaining through stack layers to work out what is going wrong. Multi-vendor environments are common and eG Enterprise unifies the monitoring of the provision stack for a wide range of possible combinations of virtualization systems. So, you will see each of the platforms individually, but the underlying resources that support several environments are monitored for total demand, not on a platform-by-platform basis.
The benefit of the unified stack approach is that it lets you see which VM hogs resources and makes the going tough for the rest of the network. The dashboard includes a great color-coded stack diagram that shows the coexistence of platforms at the supporting levels. EG calls this its in-n-out monitoring. The outside view shows all of the VMs in bands sized in proportion to each service’s resource usage. The inside view shows each layer of the stack with each VM’s usage at that level side by side, again, in proportion.
Another nice visualization feature of eG Enterprise is a workflow-style diagram that traces all of the resources needed by a virtual machine and, in turn, the resources that each supporting feature requires. Each element in the chain shows its status. So, if one of those nodes shows an alert, then you know exactly where to go to get that VM back in good health.
Who is it recommended for?
If you use a virtualization system that isn’t covered by the SolarWinds tool, you should consider eg Enterprise. Another advantage of this tool is that it will run on Linux as well as Windows Server and it is also available as a SaaS package. The tool’s VM activity visualizations are hard to beat.
Pros:
- Watches the Resources Used by VMs: Includes CPU ready time and balloon memory
- Migration Analysis: Compares performance before and after migration
- Web-Based Dashboard: The console has high-quality graphics with charts and maps
- VM Activity Displays: Highlights VMs that go offline
Cons:
- Alert Fatigue: One error can trigger a large number of alerts from different levels of service
The VM monitoring market is crowded with some very powerful tools provided by some huge software houses. The eG Enterprise package has some handy features that many of its rivals lack. A big attraction of the eG Enterprise monitoring service is that it is priced per physical server, so you can monitor as many virtualizations as you like without worrying about cost. There isn’t a free version of eG Enterprise, but you can access a 30 day free trial to asses your network requirements.
4. Site24x7 Virtualization Monitoring (FREE TRIAL)
Site24x7 Virtualization Monitoring is offered online on a Software-as-a-Service model. There is no on-premises version. The tool is a product of Zoho Group, which also owns ManageEngine.
Key Features:
- On-Premises and Cloud VMs: Hyper-V, VMware, Nutanix, and Azure VM
- Registers VM to Servers: Monitors load on each virtual server
- Tracks Resource Usage: Correlates physical server resource usage with virtual system activity
Why do we recommend it?
Site24x7 provides packages of monitoring tools from its cloud platform and these all include network and server monitoring. The platform also provides application performance monitoring, including virtualization monitoring for VMware, Hyper-V, and Nutanix and also Docker containers. The system simultaneously checks resource usage on servers and identifies the root cause of virtualization problems.
This monitoring system is offered in several specialist Editions, which cater to regular businesses, MSPs, and web-based enterprises. Its competence covers servers, networks, and applications – a combination that is ideal for the monitoring of virtualizations. The system is capable of monitoring Microsoft Hyper-V and VMWare virtualizations onsite and AWS and Microsoft Azure-based Cloud servers.
As well as covering virtualizations, Site24x7’s monitoring package covers supervision of containers run by Docker or Kubernetes. It is also able to monitor the Nutanix hyper-converged infrastructure system.
The console for the service is accessed through a browser and you can also install an app on mobile dives to get access. The fact that the system is based on remote servers liberates its abilities so that it can monitor networks anywhere in the world. Tools in the service include live status monitoring and analysis of performance based on historical data.
The system begins its service by discovering and logging all of your infrastructure. It will detect your virtualizations and map all contributing resources. Once that initial discovery phase is complete, the system continues to check on the topology of your network and virtualizations, automatically adjusting its records if you change any aspect of your implementation.

The visualization screens are very clearly set out. The simplicity of each monitor for VM is helpful because it gives you great visibility on what can sometimes seem to be an extremely complicated technology.
The system view is spread out over several screens and you can drill down to see the mappings of VMs to hosts, the performance of each server, and the activity on the network that delivers your virtualizations. Statuses are color-coded for instant problem identification and resource alerts give you a constant status update on each contributing element of your virtualization implementation.
You can customize alert levels and head off any potential threat to your VM environment before a resource shortage occurs. Reports in the package include SLA management reporting and resource utilization logs.
Analysis features help you remap VMs to hosts if any single server looks overloaded. You can use the reports in the pack to demonstrate resource requirements to stakeholders.
This is a great tool for team-driven VM monitoring. It is charged for on a subscription basis and you pay for the number of servers that you need to monitor, not the number of technicians that you want to have access to the monitor. Price plans for infrastructure monitoring are very scalable. You take out a Starter plan, which covers up to 10 servers and add-on capacity if you need to watch more servers.
Who is it recommended for?
Site24x7 provides packages of its modules that are sized to be suitable for small businesses. Larger businesses pay for extra capacity add-ons. The problem with this structure is that bigger companies can end up with a subscription charge that is a great deal higher than the advertised price.
Pros:
- Manages Snapshots: Tracks available space against snapshot size
- Identifies Resource Shortage: Notes performance impairments
- Adjust VM resource Allocation: Examines exactly how much space and memory each VM needs
Cons:
- No On-Premises Version: This is a cloud-based SaaS platform
Virtualization monitoring capabilities are offered as part of the Site24x7 Infrastructure package. This is a very comprehensive system that is suitable for large corporations. However, small enterprises can use it too. What’s more, Site24x7 is free to use if you only need to monitor up to five servers. So, Site24x7 is a good choice of all business sizes. You can get a 30-day free trial of the system. Your subscription will automatically switch over to the Free edition at the end of the trial period if you choose not to pay. That service can be upgraded to the wider paid service at any time.
5. ManageEngine OpManager (FREE TRIAL)

ManageEngine OpManager monitors networks and servers, which is a great combination of services if you want to monitor virtualizations.
Key Features:
- Monitors Multiple Virtualization Brands: VMwre, Hyper-V, Citrix, and Nutanix
- Manages VM Sprawl: See which VMs are almost inactive
- VM Maps: discovers and depicts the relationships between virtual hosts and VMs
Why do we recommend it?
ManageEngine OpManager provides monitoring for servers and networks. Its remit extends to the supervision of virtualization activity with the ability to track Citrix, VMware, Hyper-V, and Nutanix systems. The combination of server and network monitoring works well in conjunction with VM monitoring because it provides immediate root cause analysis.
The system is able to monitor virtualizations created with:
- VMWare vSphere and ESXi
- Microsoft Hyper-V
- Citrix XenServer
- Nutanix HCI
The service includes monitoring systems to watch over the performance of operating systems, network interfaces, and server resources, such as CPU availability, memory, and disk space. So, it has all of the supporting infrastructure for hypervisors covered.
The OpManager system includes a system discovery service. This extends to the entire network, identifying all network devices and endpoints and logging them in an inventory. The service performs the same task for virtual infrastructure.
The VM tracking system in OpManager identifies all of your virtual servers and discovers all of the links through virtual switches to the dependent virtual machines. Both the physical and virtual network discovery services are constant, so if you make any changes to your infrastructure, OpManager will instantly spot them and adjust its system maps.
The ongoing VM monitoring of OpManager identifies the resource usage of each VM on a virtual server – particularly that vital metric of memory usage. You can see which VM is eating up the most available memory on a system and watch each VM’s performance with live usage statistics. This enables you to head off disaster by altering allocations or examining why a particular VM is using so much memory.

The tracking of physical server resources allocated to a hypervisor is also going on at the same time as the monitoring of virtual system activity. So, you can see whether one particular virtual server is consuming a lot of memory or CPU. The OpManager service tracks all activity on each server so you will be able to spot if a completely unrelated process could be about to endanger the successful performance of your virtualizations by consuming all available server resources.
The OpManager system will monitor every level of your virtualization – both within the hypervisor and beneath it and also watch all of the services that run on top of them. These tasks create a lot of live information, all displayed on different screens in the system dashboard, which would be impossible to watch manually.
Fortunately, OpManager includes a system of performance thresholds and each will trigger an alert if a resource runs short or an element’s performance drops. These alerts can be forwarded to technicians as emails or SMS messages. So, no one needs to sit and watch the screens because OpManager will take care of monitoring the regular performance of your physical and virtual infrastructure.
Who is it recommended for?
This package is available in a limited Free edition but that doesn’t include VM monitoring. However, the standard package is sized to suit small businesses and there are capacity expansions and higher plans to suit mid-sized and large organizations. The software for OpManager will run on Windows Server, Linux, AWS, and Azure.
Pros:
- Performance Impairment Alerts: By email, SMS, or Webhooks
- Physical Server Resource Monitoring: Alerts for shortages
- Deploy on Premises or on a Cloud Account: Windows Server, Linux, AWS, or Azure
Cons:
- Cloud Option isn’t a SaaS Offering: You install the software on your own cloud account
OpManager is delivered as on-premises software that is available for Windows Server and Linux. ManageEngine offers the system on a 30-day free trial.
6. Acronis Cloud Manager (FREE TRIAL)
Acronis Cloud Manager aims at data center implementations on the Microsoft Cloud Platform. So, if you want to use VMWare, then this product probably won’t be for you. If your virtual environment is all Hyper-V, then read on. Acronis integrates cloud-based Azure servers into your VM infrastructure seamlessly. This is a good solution if you manage data for other companies because you can identify demand down to the tenant, examine the performance of each host, and track user activity.
Key Features:
- Monitors Microsoft Virtualizations: Hyper-V and Azure
- Manage User Activity: Limit virtual resources per user
- Watch Physical Server Resources: Track memory, CPU, and disk usage
Why do we recommend it?
Acronis Cloud Manager is aimed at MSPs and SaaS providers and it links together Microsoft virtual platforms – which means Hyper-V and Azure. The service is one of a number of modules that Acronis acquired when it bought 5nine. Other units provide security monitoring and cloud migration utilities.
The dashboard of this service is highly customizable, which allows you to create different user accounts with different access rights. This is another feature that appeals to businesses that host services. You can give a limited dashboard to customers and enable them to manage their own VM allocation. Other views can be given to team members at different levels of seniority in your own group, and it lets directors and other interested parties within your company see live views of performance data. Customizable reports enhance the data-sharing features of this package.
Acronis has tailored its product so that it specifically checks all of the boxes needed by a service provider. However, if you run an in-house facility, the resource allocation monitoring features certainly won’t harm any SLA and cost-center policies that your company operates.
Buyers can choose to combine the Acronis Cloud Manager system with a subscription to Acronis Cyber Protect Cloud. Acronis Cloud Manager streamlines the backup and disaster recovery processes. With built-in Acronis Backup integration, users can automate backup tasks and protect critical data across cloud environments. The platform also offers comprehensive disaster recovery capabilities, allowing businesses to quickly restore data and maintain business continuity in case of unexpected disruptions.

Security features in that package include encryption and compliance with industry standards, ensuring that sensitive data is always protected, regardless of where it is stored. The package merges on-premises and cloud-based virtual systems, but only those that are composed of Azure and Hyper-V.
This package is ideal for companies that need to manage hybrid environments, keeping control of data as it passes between VMs and ensuring that data and settings are kept safe from malicious or accidental damage.
Who is it recommended for?
The strategy behind this product is a clever one because it constructs a “hyperconverged” system like Nutanix AHV out of Microsoft products. The merging of cloud and on-premises systems means that you can choose to move services to the cloud without disrupting user access. This has implications for application fencing, storage provision, and backup services.
Pros:
- Optimizes Resource Pools: Adjusts resource allocations
- Create, Configure, and Manage VMs: Control VM creation
- Live VM Monitoring: Looks for performance problems
Cons:
- Only Hyper-V: No monitoring for other virtualization brands
The Acronis Manager is a paid service, but you can get a 30-day free trial.
7. LogicMonitor
LogicMonitor is a network performance management system, but it integrates the monitoring of virtual server environments. So, you can use it as a system-wide monitor or just limit it to monitoring your virtual machine implementations. The LogicMonitor system offers VMware vCenter monitoring, ESXi hosts monitoring, and also covers individual VMs, including ESX and ESXi.
Key Features:
- Monitors Major Virtualization Brands: Hyper-V, VMware, Citrix, and Nutanix
- Cloud Virtual Server Monitoring: AWS and Azure
- Virtualization Mapping: Based on an autodiscovery cycle
Why do we recommend it?
LogicMonitor watchers over physical and virtual assets, including Hyper-V, VMware, and Citrix systems. The tool can also track the performance of the AWS and Azure cloud platforms. This package is able to simultaneously watch the VMs, the resources that they rely on, and the applications that run on top of them.
LogicMonitor performs Microsoft Hyper-V performance tracking at both the hypervisor and individual VM levels. This system can also interact with Citrix XenServer technology.
The software for this monitor is accessed in the cloud. It is platform-neutral and can monitor cloud-provided VM services as well as onsite systems. However, it’s not an utterly offsite implementation because you need to install collectors on your servers and network devices. These collectors route through your gateway up to the central LogicMonitor server. All communications over the internet are encrypted, as is stored data on the LogicMonitor server. Information is decrypted in real time when accessed through a valid user account, which requires access credentials.
The monitor starts with an autodiscovery process, which maps your entire network, including your XenServer, VMWare and Hyper-V implementations. The system extends to Amazon cloud servers and Microsoft Azure.
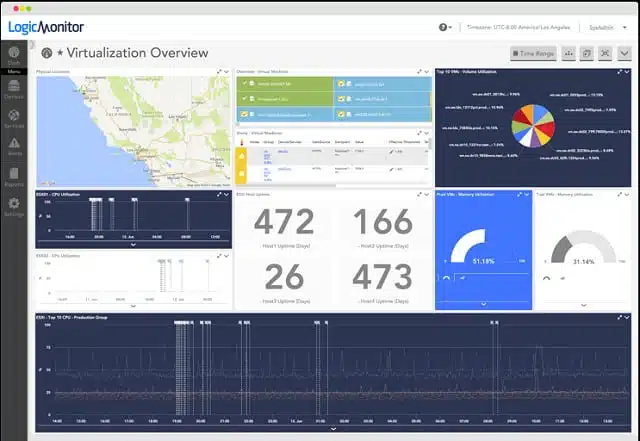
The underlying technology of VM systems engenders a wide range of monitoring topics. In fact, to keep a VM system running, you need to watch hardware, operating systems, network performance, application and service execution, and, above all, resource utilization. You’ve got virtual switches to contend with, and you need to make sure storage and application servers do not overload and are accessible at acceptable delivery speeds. The LogicMonitor dashboard covers all of these issues.

Hardware performance attributes that the VM monitor tracks include the overall health of your servers. They focus on memory usage, CPU load, disk latency, disk data rates, disk IO/ s, and VMkernel swap rates to keep the service level chugging along.
System alerts can be sent out by email, SMS, or Slack notifications. You can specify which team members receive alerts by classification and by source. If you outsource part of your virtual environment, the support team of the provider can be notified automatically. The dashboard can be tailored according to role as well, so you can safely share consoles with all team members, even junior staff. A data-only view can be created to let finance and c-Suite members view events in the VM system.
Who is it recommended for?
LogicMonitor offers editions that match the needs and the budgets of small, mid-sized, and large organizations. The full-stack monitoring capabilities provide all the tools that any business would need to ensure that all systems are running smoothly. This is a reliable brand with an excellent support team.
Pros:
- VM Activity Monitoring: Registers internal resource usage
- Physical Server Observations: Monitors physical resource availability
- Link Performance to Requirements: Track SLA goals
Cons:
- Only Available as a SaaS Package: No on-premises package
LogicMonitor is not free, but you can get a 14-day free trial to give it a spin. The package is available in three editions: Starter, Pro, and Enterprise versions. This scalability means that LogicMonitor is suitable for all sizes of businesses.
8. Veeam One
Veeam One monitors network resources and examines the system utilization by VMWare vSphere and Hyper-V virtualization implementations. The monitoring power of the tool extends to cloud-based services. Veeam is particularly strong on system backup and recovery. The Veeam One service was designed to integrate with the company’s Backup and Replication Manager.
Key Features:
- Focused on Backups: Will backup Hyper-V and VMware environments
- Forecasts Resource Requirements: Performs trend analysis
- Automated Responses: Links remediation actions to alerts
Why do we recommend it?
Veeam One offers a free edition that provides just about all of the features of its paid version. Both package include VM monitoring for Hyper-V and VMware. The platform is a cloud-based system and can track assets anywhere. You get a correlation between virtualization performance and the availability of physical resources.
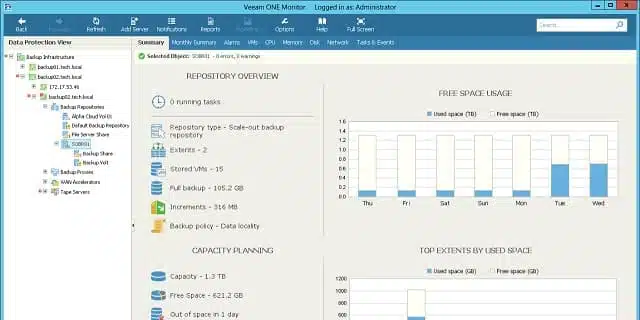
The Veeam One system uses real-time monitoring round the clock. Those monitors check on 200 preset sensors, and you can add your own customized monitoring conditions and alert rules. A capacity module gives you insights into ongoing resource utilization as well as trend analysis based on historical data. The data gathering components cover all of the physical infrastructure that supports the virtualization and checks for capacity limit warnings.
You don’t have to rely on the interpretations of the dashboard visualizations and reports provided by Veeam One because you also get access to raw data. This enables you to build your own customized reports, apps, and alert rules.
Veeam One is a paid product. However, there is a free version. Veeam One Free includes all of the virtual machine monitoring capabilities of the paid system. There is no capacity limit on the free version of the system, which is rare in the industry. Veeam One Free doesn’t have the capacity functions included in Veeam One, in any case. The free version also lacks charge tracking and billing features.
Both the free and paid versions display alert notifications on the screen. These can also be sent by email, but only paid users can customize alert conditions.

Who is it recommended for?
Veeam provides a backup and recovery service, which isn’t free, so you would have heightened interest in the Veeam One package if you are also in the market for a backup system because the two services slot together. The free Vaan One is appealing to small businesses.
Pros:
- Malware Scanning: Looks for ransomware
- Monitors Cloud Platforms: AWS, Azure, GCP, and Oracle Cloud
- Customizable: Create your own alerts and automated responses
Cons:
- Limited Free Version: Restricted to backing up ten resources
Veeam One is particularly effective for customers of the company’s backup server software. Tenant tracking also makes this an excellent choice for service providers, both for cloud storage provision and for software-as-a-service. If you think you would be better served by the full, paid Veeam One service, you can test it on a 30-day free trial.
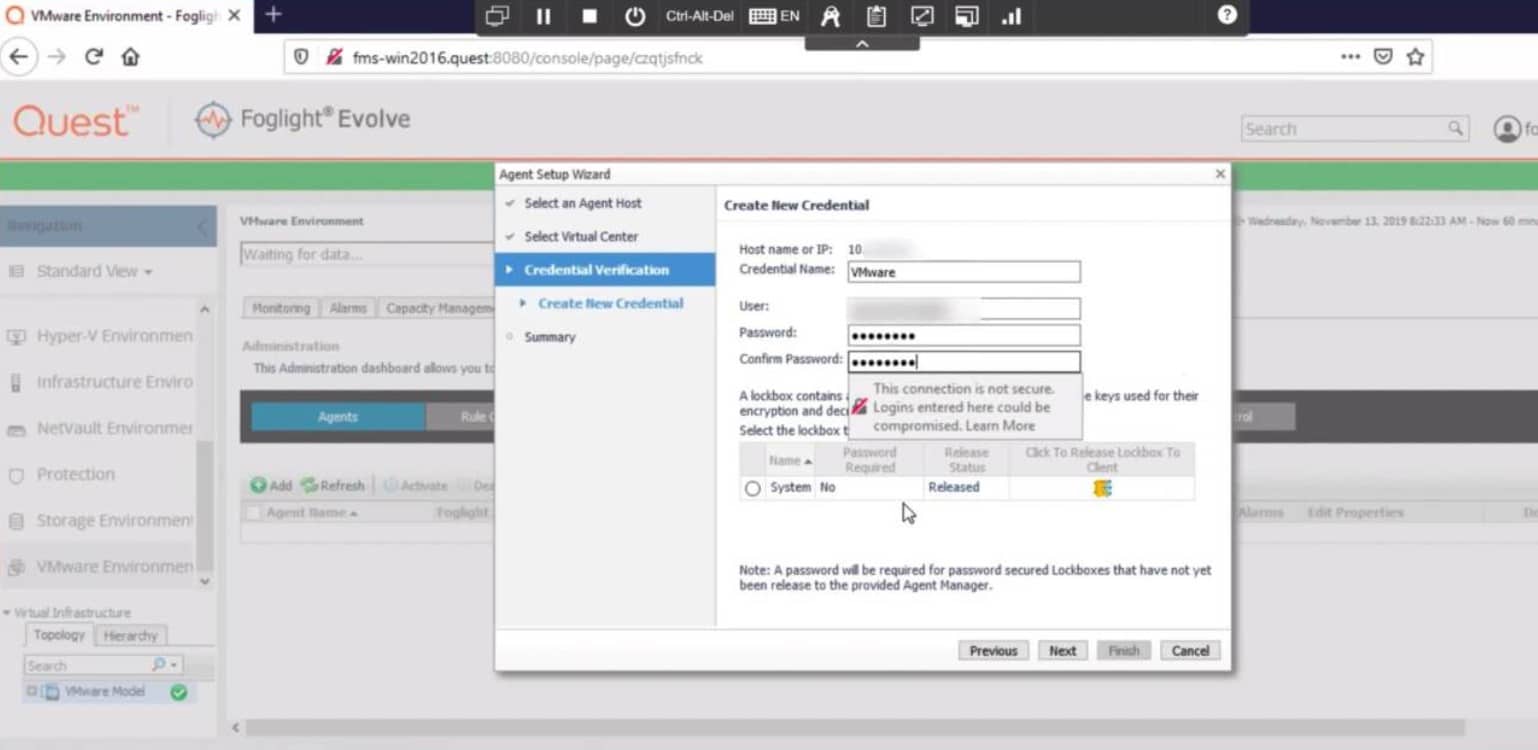
9. Quest Foglight
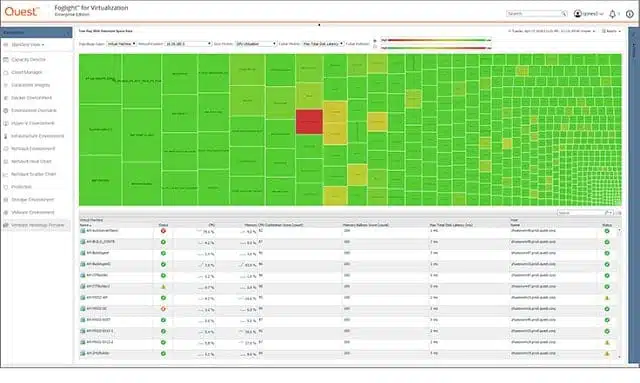
Foglight is a system monitoring system that has versions for cloud monitoring and VM environment management. The system works with VMWare and Hyper-V, focusing on the information gathered at the vSwitch, combined with physical performance data from the server.
Key Features:
- Monitors Multiple Virtualization Types: VMware, Hyper-V, and Citrix
- Multiple Technologies: Also monitors containers, cloud platforms, and physical servers
- Balance Workloads: Include VMs in workload distribution
Why do we recommend it?
Quest Foglight is similar to SolarWinds SQL Sentry because it combines database and virtualization monitoring. You can track the performance of VMware, Hyper-V, and OpenStack systems with this tool, cloud platforms, including AWS, Azure, and GCP, and OpenShift, Docker, and Kubernetes containers. The system also observes activity on servers running Windows and Linux.
The system sets itself up through an autodiscovery function. It identifies servers and their client virtual machines, and it examines the traffic that passes between them to highlight network performance. The traffic analysis data gathering section of this tool examines packet-level data to identify which VMs and applications generate the most traffic.
The Foglight system can also monitor Citrix XenApp and XenDesktop environments. The application monitoring dashboard gives you a display of all the elements in the Citrix VDI stack, highlighting strained infrastructure that could impact performance delivery. The system cleverly maps the topology of your virtual environment to help visualize the locations of each VM and monitor the physical traffic flows between servers and VMs.
The monitor extends into management functions as well. You can set it to dynamically adjust resources allocated to each application or VM to account for underutilization or over-capacity in different areas of the network. The monitor dashboard gives you a range of views on Citrix user session activity from overall VM count summaries through to application activity.
The Foglight monitoring system closely tracks NetScaler performance and network latency. The load on physical devices and virtual switches are other considerations. The Foglight monitor identifies inactive VMs and lets you remove zombie processes to free up resources. This is an excellent feature because, unfortunately, the VM environment is prone to hanging processes and abandoned sessions that leave locks on resource allocations behind.
The Foglight system explores and stores data to build up a testbed. The dashboard will show trend and variant performance and isolate data for each hardware element of your system. This helps discover bottlenecks and resource misallocation.
The data patterns and regular usage statistics give you a capacity planning function. With this tool, you can identify where to adjust the allocation of resources to improve performance and work out the effects of increased demand. The Foglight monitor includes predictive capabilities that suggest actions to resolve alert conditions. This will also work with live data to help adjust network utilization on the fly.
If you operate a multi-vendor environment with both VMWare and Hyper-V software operating onsite, you can unify your monitoring and management tasks in one place with the Foglight system. The monitor extends to cloud storage, so you can vary capacity by adjusting extra offsite provisions, such as additional storage.
Who is it recommended for?
This is an on-premises package that will run on Windows or Linux. The tool simultaneously watches over VMs and the servers that support them. It is good at providing alerts for resource shortages and performance problems so you get to see exactly which asset is causing problems.
Pros:
- Create or Destroy VMs: Reduce resource wastage
- Estimate Costs: Track resource usage and forecast trends
- Option for MSPs: Manage data center resources
Cons:
- No SaaS Option: Available for Windows Linux, and Solaris
Quest Foglight is not free. However, you can access a free trial to get a feel for the system. Foglight runs on Windows, Linux, and Solaris operating systems.
10. Sematext Infrastructure Monitoring

Sematext Infrastructure Monitoring is a cloud-based server and services monitor that scours log records for system performance information. This tool tracks the capacity and utilization of server resources plus Java Virtual Machine and container activities.
Key Features:
- JVM Monitoring: Track issues in Java Virtual Machines
- Delivered from the Cloud: Monitors both cloud and on premises resources
- Examines Garbage Collection: Looks at memory recovery
Why do we recommend it?
Sematext Infrastructure Monitoring is a SaaS package that watches over on-premises resources and cloud assets. The system includes monitoring capabilities for JVM and containers but not for standard hypervisors, such as Hyper-V and VMware. The system is particularly concerned with memory usage and cleanup, which are important issues for the efficient operations of JVM.
As it is based in the cloud, Sematext isn’t limited to monitoring servers on just one site. You can include any server anywhere in the monitoring program. That includes cloud services. In order to bring a server into the Sematext monitoring system, you need to install an agent program on it. Once the server is enrolled, all of the services operating on it are monitored. That includes JVM instances and containers.
The container monitoring part of Sematext Infrastructure Monitoring focuses on Docker and Kubernetes. It can track the activities of each container and log its resource usage. That performance can be related to the resource usage of the supporting server.

JVM monitoring watches over Java activities and monitors its resources. This includes garbage collection activities and memory usage. Memory metrics tracked in the Sematext Infrastructure Monitoring service include heap size and usage for each memory pool. You can also use the Sematext system to adjust memory allocations, so it isn’t just a monitoring service. The system counts JVM threads and records file interactions.
The Sematext Infrastructure Monitoring service provides overviews of server and service activities that consolidate performance data. So, you start off with a collective view of server or JVM performance and then drill down to individual instances. The system gives you live performance data and lets you filter and sort performance reports for analysis. You can also call in historical data for activity analysis.
Other features in the Sematext Infrastructure Monitoring platform include transaction tracing for APIs, which track over the internet to the hosts of the services that lie behind those API interfaces. It is also able to monitor databases.
Who is it recommended for?
This service is a good choice for businesses that have resources on numerous sites and cross into cloud platforms as well. The JVM and container systems lend themselves to DevOps teams that create and manage applications for use by others. The lack of hypervisor monitoring is a problem with this tool.
Pros:
- Records Activity Metrics: Number of open files, thread count, memory pool sizes
- Track External Connections: See whether linked technologies are holding up performance
- Container Monitoring: Docker and Kubernetes
Cons:
- Doesn’t Monitor Traditional Virtualizations: No monitoring for VMware or Hyper-V
You can get Sematext Infrastructure Monitoring for free by accessing the Basic package, which is limited to monitoring three servers. There are two paid plans: Standard and Pro. Each paid plan is a metered service with a rate per host per hour. You can get a 14-day free trial of Sematext Infrastructure Monitoring.
11. SolarWinds Virtualization Manager
If your VM system is a little more complicated than one server, you will probably need to step up to the SolarWinds Virtualization Manager. Not only does this tool cover more than one server, it offers much deeper monitoring of conditions in the virtual device environment. You are not limited to onsite VM servers with this package because it can also integrate Amazon EC2 and Azure virtual servers into the monitoring environment.
Key Features:
- Monitors Multiple Virtualization Brands: Hyper-V, VMware, and Nutanix
- Monitors Cloud Virtual Servers: AWS EC2 and Azure
- VM Sprawl Management: Assess the expansion of your virtualizations
- Capacity Planning: Estimate the resources that VM usage trends show you will need
- Performance Monitoring: Color-coded alerts for problems
Why do we recommend it?
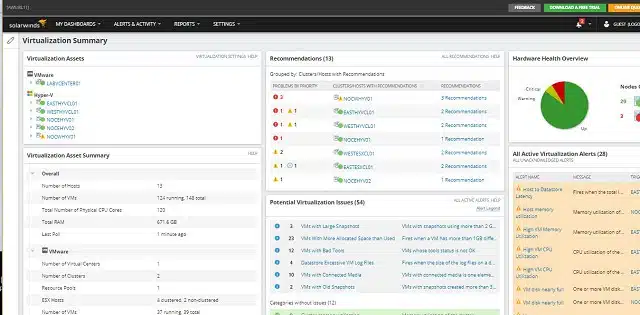
SolarWinds Virtualization Manager provides analysis and monitoring for VMware vSphere, Hyper-V, and Nutanix virtualizations. This system discovers and maps all hypervisors on your system and adds in the new ones as they are created. It generates a dependency map that shows you what resources each is using.
The dashboard of the Virtualization Manager software shows detailed performance metrics and includes data visualization elements, such as dials and live performance line graphs. The system will show both VMWare and Hyper-V environments, keeping separate lists of the metrics on each supporting OS type if you have a mix of both systems running on your network. Alerts are color-coded: yellow indicates warnings and red highlights critical conditions. A list of potential alert situations stands ready in a separate panel of the dashboard. This utility watches out for service conditions that have reached a point of performance impairment and approach a Warning condition.

Key upgrades that this tool has over the VM Monitor include capacity planning assistance and “sprawl management“. A combination of these two tools gives you predictive recommendations. Thanks to this planning feature, you are better armed to head off overcapacity in one area of the environment and reallocate under-utilized resources in other areas of the system.
A simulation module lets you test the effects of adding more users or applications to the network. This models CPU usage, memory availability, storage capacity, and network demands for a given scenario. The sprawl feature shows you where VMs are idle and allows you to power them off and reallocate the resources assigned to them.
This is a handy feature that helps get the most out of your budget and stop you from mistaking dead processes for resource demand. At the other end of the spectrum, the sprawl monitor shows you which VMs are gobbling up all of your resources. This allows you to limit allocations to those nodes and also provides a starting point for investigations into inefficient software or system abuse.
The dashboard includes an Application Stack that simply shows layers of resources and the status conditions present on each. The stack is represented by lines of alert condition symbols for user groups, applications, databases, transactions, servers, and hosts. This enables you to quickly see where capacity issues impact application performance and quality of service.
The Perf Stack feature of the Virtualization Manager is a utility available in a number of SolarWinds infrastructure management tools. So, if you have already used a different SolarWinds product, you may be familiar with PerfStack. This is a graphical equivalent of the Application Stack. It shows live data in a line graph for each resource in the virtual environment. You select each of the graphs that interest you and drag and drop them onto a board. This enables you to create your own stack showing how peaks and troughs in demand for one resource, such as a database or the network, impact the performance of other resources, such as application response times or CPU usage.
The Virtualization Manager software contains a lot of information and the summary views come in handy to prevent you from being overwhelmed by data. You will soon become accustomed to the presentation format of the virtual machine monitoring dashboard and build your own working practices. These will see you switching between summaries and details and hopping over to planning tools to keep the virtual environment ticking over.
Who is it recommended for?
You don’t need to be running all three of the VMware, Hyper-V, and Nutanix systems to benefit from this system. Businesses that rely on virtualizations for resource efficiency need to ensure that they still have enough resources to feed into their VM structure. This package provides capacity planning and live resource usage monitoring.
Pros:
- Automated VM Monitoring: Technicians don’t have to watch the dashboard but just need to respond to performance alerts
- Overall Status Reports: Drill down to individual servers
- VM to Server Mapping: See how many virtual machines each virtual server supports
- See the Effects of Configuration Changes: Track performance over time
- Compare Configuration Changes Over Time: Flip between snapshots with the Virtual DNA feature
Cons:
- No Monitoring for GCP: AWS and Azure: Yes; Google Cloud Platform: No
SolarWinds Virtualization Manager doesn’t come cheap — prices start at $2,995. However, you can try the system out for 30 days free of charge.
12. WhatsUp Gold Virtualization Monitoring Add-on
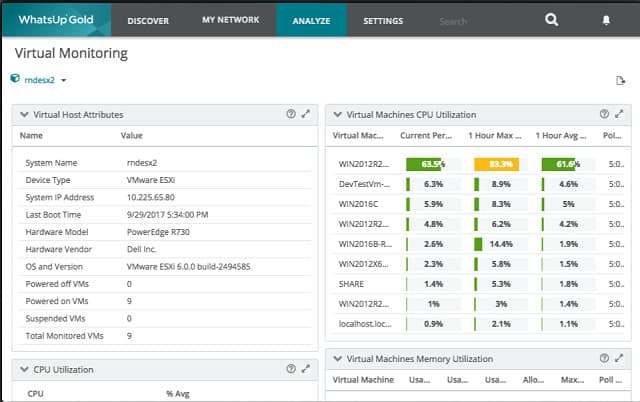
Monitoring VM environments is complicated. You need to check on both infrastructure and software and monitor every element constantly in order to prevent performance impairment. Progress WhatsUp Gold covers all of the angles that you need to watch in order to successfully maintain virtualization.
Key Features:
- Addition to a Network Monitor: An add-on module to the core device monitoring service
- Monitors Major Virtualizations: Hyper-V and VMware
- Virtualization Mapping: Derived from an autodiscovery process
Why do we recommend it?
Progress WhatsUp Gold offers a core network performance monitor that can be extended by add-on modules. One of these extensions is the Virtualization Monitoring package. This service watches VMware and Hyper-V virtualizations, discovering and mapping each virtual system. It tracks the physical server resources that are allocated to each virtual environment.
The core WhatsUp Gold software implements network performance monitoring, keeping an eye on the devices that connect your network links together. However, there is a lot more that needs to be tracked to keep your VM system up and running. The Virtualization Monitoring add-on will cover those extra tasks.
A vital feature of the add-on is an extension of the network discovery function of WhatsUp Gold. This will apply to all VM components the processes of mapping connections and dependencies that the main package applies to network devices. The system check gives WhatsUp Gold a baseline and from that, the add-on builds a map that shows the application stack that supports each VM. You will be able to see which servers support which VMs and the status of server attributes and virtualization server software.

As your VM system proceeds into normal operations, the add-on will continue to monitor performance, looking out for potential failure in software, servers, and the network. Data collected by WhatsUp Gold is shown in real-time in the dashboard and it also gets saved as source information for analysis functions. With those planning tools you can work out whether any of your servers are overloaded and take appropriate action.
Who is it recommended for?
Progress WhatsUp Gold is an on-premises package that runs on Windows Server. Although the system offers a Cloud Monitoring add-on, you would primarily get this package to watch over your on-premises physical assets. All of the other capabilities of WhatsUp Gold, such as the Virtualization Monitor are paid add-ons.
Pros:
- Resource Monitoring: Connects virtualization activity to physical server resource usage
- Root Cause Analysis: Identifies the true cause of virtualization performance problems
- Alerts for Performance Problems: Notifications by SMS, email, or Slack
Cons:
- No SaaS Option: Download the software onto Windows Server
WhatsUp Gold and the Virtualization Monitoring Add-on can be bought together with the Progress Application Performance Monitoring Add-on in the Systems Admin’s Bundle. The WhatsUp Gold Total Plus package gives you the core application together with all of its add-ons. Whichever way you choose to acquire WhatsUp Gold and the Virtualization Monitoring add-on, you can get them on a 30-day free trial before you commit to buy.
13. ESXi Embedded Host Client
VMWare produces a free environment to its ESXi systems, which is the ESXi Embedded Host Client. The client’s interface is browser-based, and so it is operating system-neutral. Also, you need to have the VMWare software installed and operating to use this monitoring tool. It won’t work with Citrix or Hyper-V systems. This utility is not feature-rich and it won’t give you the full system monitoring capabilities of the other options on this list. However, it would be suitable for small-business virtualization implementations and lab scenarios.
Key Features:
- Native Monitoring System: Supplied by VMware
- Free Tool: Included with the ESXi package
- Supports Labs: Better at tracking test systems than live virtualizations
Why do we recommend it?
ESXi Embedded Host Client is the VM monitoring solution offered by VMware for its ESXi product range. The monitor runs within the ESXi environment. It doesn’t work for vSphere systems and you can’t monitor any other virtualization brand with this tool. However, the service is free.
The tool offers an enhanced interface to your ESXi clients. You can set up new VMs through this utility and configure the hosting for each. The monitoring aspect of the tool gives you insight into host statuses. It will also list live data on events occurring in the VM environment.
Who is it recommended for?
If you are using VMware’s ESXi system, this monitoring tool is an obvious choice, not least because it is free. A monitoring tool works best when it is able to get inside the system that it is monitoring to collect data and you can’t get closer to the ESXi structure than this tool.
Pros:
- Runs Inside ESXi: Gathers statistics and sends them out to the console
- Create and Destroy VMs: Manually manage VMs
- Host Performance: Tracks the response time of the virtual hosts
Cons:
- Only ESXi: Doesn’t monitor vSphere
This is a simple tool, but the fact that it is free and that it comes directly from VMWare will tempt you to install it.
14. Turbonomic
The growth of the cloud in the provision of virtual environments can be seen by the product presentation of Turbonomic. Until recently, VM products prioritized on-site resources and then maybe dealt with Cloud-based services. In Tubonomic’s case, the tool is headlined as a utility to monitor Cloud resources. Oh, and by the way, it can also watch any onsite VM servers you might have.
Key Features:
- Monitors Cloud Systems: Tracks virtual server performance
- VM Monitoring: VMware, Hyper-V, and Nutanix
- Virtualization Mapping: Fed by a continuous discovery process
Why do we recommend it?
IBM Turbonomic is an application monitor that traces through to underlying service until it has mapped and logged all resources right down to physical assets. This drill-down path encounters all visualizations where they exist and it crawls through the virtual environment as well. The tool tracks Hyper-V, VMware, and Nutanix virtualizations.
Turbonomic doesn’t skimp on onsite VM monitoring, and the system can cope very well with hybrid implementations. This very comprehensive VM performance monitoring tool for virtual environments comes in three packages: Essentials, Advance, and Premier.
Although this monitoring software is not free, you can get a 30-day free trial of the Premier package. Pricing is based on the number of workloads that the monitor covers. The Essentials package has a limit of 750 workloads, but the other two editions have unlimited capacity. The monitor integrates controlling mechanisms and integrates AI into its action recommendation processes. You get more automation with the higher plans, but all editions include capacity planning capabilities.
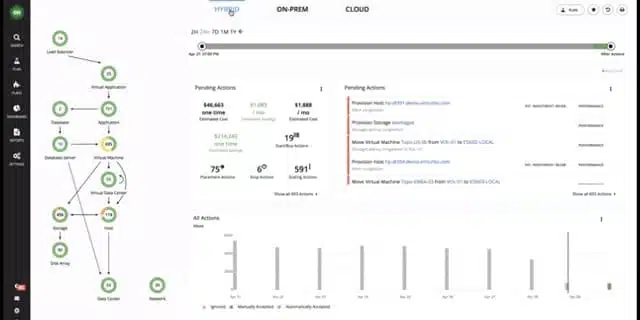
Turbonomic’s straightforward monitoring module includes great visualization features like charts and graphs. The tool can interact with VMware, Hyper-V, and XenServer environments. The setup process is automated and finishes with a system health check. This scan by the Turbonomic engine maps all of your virtual environment. It finishes its onboarding with a list of recommendations on where your system problems lie and how you should resolve them. Once that initial phase completes, Turbonomic continuously monitors the environment, producing alerts on the dashboard, backing them up with action recommendations.
You can set an action rule base in the higher editions of Turbonomic to automatically perform resolution when specific alerts arise. That automation is optional and you can launch recommended actions manually, or ignore them if you wish.
This is a good tool for departments or services that adhere to service level agreements. Those SLAs can be translated directly into the monitoring system as quality of service requirements. You can set alert levels for aspects of service including response times for delivery and transaction throughput for billing.
The monitor allows you to reallocate resources to different applications or user groups and highlights areas where an expansion of cloud resources is inevitable. On the flip side, the Turbonomic AI engine will show you where you have over-provisioned, allowing you to scale back online services and cut costs. That capacity visualization also extends to planning functions. The interface provides a capacity testing section where you can preview the effects of extensions to the user base or the inclusion of new applications and services. This is a great planning tool for bidding processing because it will enable you to plan out your extra services more effectively.
Who is it recommended for?
IBM’s presentation for Turbonomic talks extensively about cloud monitoring, cloud migration, and all other things “cloud,” so, it seems that the company is shifting this product away from monitoring on-premises systems. The tool will monitor your on-premises systems but that fact could change as the product evolves.
Pros:
- Resource Requirements Predictions: Forecasts upcoming needs
- Can Integrate SLAs: Link performance with SLA obligations
- Capacity Planning Support: Includes historical analysis and trend predictions
Cons:
- More of a Cloud Platform Monitor: Monitors AWS, Azure, and GCP
The dashboard for the monitor is customizable and you can allocate different views and controls to members of your team. The ability to create a user interface that does not include any controls at all gives you the option of letting clients or directors access the system without risking damage to your VM setup.
VM performance monitoring tool selection
This review has given you a wide range of VM monitoring tools to choose from. Which is the best for you? Your circumstances will dictate that. Some VM monitoring tools are really system-wide infrastructure management systems that feature great virtualization functions. Other tools in the list are just small utilities that enhance your view of VM data or improve just one aspect of VM performance.
As you will glean from the statements in this report, the network monitoring industry is in transition at the moment. Ten years ago, virtualization was in its infancy and cloud services were a new trend. Both concepts now dominate networked services. It is not impossible to predict that, very soon, cloud services and the virtualization technology that makes them possible will be the standard method of network provisioning. The complexities of on-site server and application management will be a thing of the past.
Do you have recommendations for VM monitoring tools? Do you use a virtualization monitoring system that we’ve overlooked? How do you think the job of a systems administrator will change as cloud services grow? Leave a message in the comments section below and share your thoughts with the community.
VM Monitoring FAQs
How do I monitor network traffic in VMWare environments?
In order to monitor network traffic in VMWare, you first need to enable promiscuous mode on a vSwitch that operates within the environment. The function to activate promiscuous mode on a vSwitch is found in the vCenter Server dashboard of vSphere.
- In vCenter Server, go to the Configuration tab.
- Look at the Hardware section and select Networking.
- Go to vSwitch properties. Assign a port group.
- Switch to the Security tab.
- Activate promiscuous mode for your chosen port group.
Once the vSwitch is able to listen to all network traffic you can install a free packet capturing system to channel through network traffic for analysis. Try Wireshark for this.
What is Type 1 and Type 2 virtualization?
Type 1 and Type 2 virtualizations rely on Type 1 and Type 2 hypervisors. A hypervisor is also known as a virtual machine monitor (VMM). The Type 1 virtualization uses a Type 1 hypervisor, which runs on a bare metal server. That is because the Type 1 includes its own operating system. The Type 2 virtualization with a Type 2 hypervisor should be installed on a server that already has an operating system.
How do I check disk space on Hyper-V host?
How do I check disk space on Hyper V host?
In order to check the disk space of a Hyper-V host, follow these steps.
- Connect to the host in PowerShell
- Find the drive that holds the Hyper-V instance with these two commands:
$VMPath = Get-VM <virtual machine name> | Select-Object -ExpandProperty HardDrives
$VMPath.Path
- Look at the results of the Path enquiry. The drive letter is at the front of the path.
- Set up the structure to hold disk information:
$disk = Get-WmiObject Win32_LogicalDisk -Filter "DeviceID=‘F:’" | Select-Object *
- Output the total disk size in gigabytes:
$disk.Size/1GB
- Output the free disk space in gigabytes:
$disk.FreeSpace/1GB
Why is my VM running slow?
Page swapping is the main cause of a slowdown in VM response times. In this scenario, your VM is so slow because the hypervisor is occupied with moving data in and out of files on the disk because there is not enough room available in memory. Check on the memory utilization of the VM and see if it is hitting its limit. On the other hand, it is possible to allocate too much memory to the VM and leave the host’s operating system with insufficient space. So, check that as well.
Why do I monitor VM to VM traffic?
To monitor VM to VM traffic, you need to set up a connection monitor. The terminology and creation method for connection monitors is different from virtualization brand to virtualization brand. However, the connection monitor should be an option that you can set up under the services creation system of your VM manager. For example, in Azure, a connection monitor is a type of “network watcher.” The creation of a network monitor usually requires you to specify two VMs and all traffic between them will then be monitored.

