
In an era where enterprises are looking to leverage the power of big data, Apache Hadoop has become a key tool for storing and processing large datasets efficiently. However, like all pieces of infrastructure, it needs to be monitored.
Here is our list of the best Hadoop monitoring tools:
- Site24x7 Infrastructure Monitoring EDITOR’S CHOICE This cloud-based package can be expanded by plugins and there is one available for Hadoop monitoring. This package also examines server resource utilization. Get a 30-day free trial.
- ManageEngine Applications Manager (FREE TRIAL) This package of monitoring systems specializes in examining the performance of servers and the software that runs on top of them. Runs on Windows Server, Linux, AWS, and Azure. Start a 30-day free trial.
- Datadog Cloud monitoring software with a customizable Hadoop dashboard, integrations, alerts, and more.
- LogicMonitor – Infrastructure monitoring software with a Hadoop Package, REST API, alerts, reports, dashboards, and more.
- Dynatrace – Application performance management software with Hadoop monitoring with NameNode/DataNode metrics, dashboards, analytics,, custom alerts, and more.
What is Apache Hadoop?
Apache Hadoop is an open-source software framework that can process and distribute large data sets across multiple clusters of computers. Hadoop was designed to break down data management workloads over a cluster of computers. It divides data processing between multiple nodes, which manages the datasets more efficiently than a single device could.
How to Monitor Hadoop: Metrics You Need to Keep Track of to Monitor Hadoop Clusters
Like any computing resource, Hadoop clusters need to be monitored to ensure that they keep performing at their best. Hadoop’s architecture may be resilient to system failures, but it still needs maintenance to prevent jobs from being disrupted. When monitoring the status of clusters, there are four main categories of metrics you need to be aware of:
- HDFS metrics (NameNode metrics and DataNode metrics)
- MapReduce counters
- YARN metrics
- ZooKeeper metrics
Below, we’re going to break each of these metric types down, explaining what they are and providing a brief guide for how you can monitor them.
HDFS Metrics
Apache Hadoop Distributed File System (HDFS) is a distributed file system with a NameNode and DataNode architecture. Whenever the HDFS receives data it breaks it down into blocks and sends it to multiple nodes. The HDFS is scalable and can support thousands of nodes.
Monitoring key HDFS metrics is important because it helps you to: monitor the capacity of the DFS, monitor the space available, track the status of blocks, and optimize the storage of your data.
There are two main categories of HDFS metrics:
- NameNode metrics
- DataNode metrics
NameNodes and DataNodes
HDFS follows a master-slave architecture where every cluster in the HDFS is composed of a single NameNode (master) and multiple DataNodes (slave). The NameNode controls access to files, records metadata of files stored in the cluster, and monitors the state of DataNodes.
A DataNode is a process that runs on each slave machine, which performs low-level read/write requests from the system’s clients, and sends periodic heartbeats to the NameNode, to report on the health of the HDFS. The NameNode then uses the health information to monitor the status of DataNodes and verify that they’re live.
When monitoring, it’s important to prioritize analyzing metrics taken from the NameNode because if a NameNode fails, all the data within a cluster will become inaccessible to the user.
Prioritizing monitoring NameNode also makes sense as it enables you to ascertain the health of all the data nodes within a cluster. NameNode metrics can be broken down into two groups:
- NameNode-emitted metrics
- NameNode Java Virtual Machine (JVM) metrics
Below we’re going to list each group of metrics you can monitor and then show you a way to monitor these metrics for HDFS.
NameNode-emitted metrics
- CapacityRemaining – Records the available capacity
- CorruptBlocks/MissingBlocks – Records number of corrupt/missing blocks
- VolumeFailuresTotal – Records number of failed volumes
- NumLiveDataNodes/NumDeadDataNodes – Records count of alive or dead DataNodes
- FilesTotal – Total count of files tracked by the NameNode
- Total Load – Measure of file access across all DataNodes
- BlockCapacity/BlocksTotal – Maximum number of blocks allocable/count of blocks tracked by NameNode
- UnderReplicated Blocks – Number of under-replicated blocks
- NumStaleDataNodes – Number of stale DataNodes
NameNode JVM Metrics
- ConcurrentMarkSweep count – Number of old-generation collections
- ConcurrentMarkSweep time – The elapsed time of old-generation collections, in milliseconds
How to Monitor HDFS Metrics
One way that you can monitor HDFS metrics is through Java Management Extensions (JMX) and the HDFS daemon web interface. To view a summary of NameNode and performance metrics enter the following URL into your web browser to access the web interface (which is available by default at port 50070):
http://<namenodehost>:50070
Here you’ll be able to see information on Configured Capacity, DFS Used, Non-DFS Used, DFS Remaining, Block Pool Used, DataNodes usage%, and more.
If you require more in-depth information, you can enter the following URL to view more metrics with a JSON output:
http://<namenodehost>:50070jmx
MapReduce Counters
MapReduce is a software framework used by Hadoop to process large datasets in-parallel across thousands of nodes. The framework breaks down a dataset into chunks and stores them in a file system. MapReduce jobs are responsible for splitting the datasets and map tasks then process the data.
For performance monitoring purposes, you need to monitor MapReduce counters, so that you view information/statistics about job execution. Monitoring MapReduce counters enables you to monitor the number of rows read, and the number of rows written as output.
You can use MapReduce counters to find performance bottlenecks. There are two main types of MapReduce counters:
- Built-in Counters – Counters that are included with MapReduce by default
- Custom counters – User-defined counters that the user can create with custom code
Below we’re going to look at some of the built-in counters you can use to monitor Hadoop.
Built-In MapReduce Counters
Built-in Counters are counters that come with MapReduce by default. There are five main types of built-in counters:
- Job counters
- Task counters
- File system counters
- FileInputFormat Counters
- FileOutput Format Counters
Job Counters
MapReduce job counters measure statistics at the job level, such as the number of failed maps or reduces.
- MILLIS_MAPS/MILLIS_REDUCES – Processing time for maps/reduces
- NUM_FAILED_MAPS/NUM_FAILED_REDUCES – Number of failed maps/reduces
- RACK_LOCAL_MAPS/DATA_LOCAL_MAPS/OTHER_LOCAL_MAPS – Counters tracking where map tasks were executed
Task Counters
Task counters collect information about tasks during execution, such as the number of input records for reduce tasks.
- REDUCE_INPUT_RECORDS – Number of input records for reduce tasks
- SPILLED_RECORDS – Number of records spilled to disk
- GC_TIME_MILLIS – Processing time spent in garbage collection
FileSystem Counters
FileSystem Counters record information about the file system, such as the number of bytes read by the FileSystem.
- FileSystem bytes read – The number of bytes read by the FileSystem
- FileSystem bytes written – The number of bytes written to the FileSystem
FIleInputFormat Counters
FileInputFormat Counters record information about the number of bytes read by map tasks
- Bytes read – Displays the bytes read by map tasks with the specific input format
File OutputFormat Counters
FileOutputFormat counters gather information on the number of bytes written by map tasks or reduce tasks in the output format.
- Bytes written – Displays the bytes written by map and reduce tasks with the specified format
How to Monitor MapReduce Counters
You can monitor MapReduce counters for jobs through the ResourceManager web UI. To load up the ResourceManager web UI, go to your browser and enter the following URL:
http://<resourcemanagerhost>:8088
Here you will be shown a list of All Applications in a table format. Now, go to the application you want to monitor and click the History hyperlink in the Tracking UI column.
On the application page, click on the Counters option on the left-hand side. You will now be able to view counters associated with the job monitored.
YARN Metrics
Yet Another Resource Negotiator (YARN) is the component of Hadoop that’s responsible for allocating system resources to the applications or tasks running within a Hadoop cluster.
There are three main categories of YARN metrics:
- Cluster metrics – Enable you to monitor high-level YARN application execution
- Application metrics -Monitor execution of individual YARN applications
- NodeManager metrics – Monitor information at the individual node level
Cluster Metrics
Cluster metrics can be used to view a YARN application execution.
- unhealthyNodes – Number of unhealthy nodes
- activeNodes – Number of currently active nodes
- lostNodes – Number of lost nodes
- appsFailed – Number of failed applications
- totalMB/allocatedMB – Total amount of memory/amount of memory allocated
Application metrics
Application metrics provide in-depth information on the execution of YARN applications.
- progress – Application execution progress meter
NodeManager metrics
NodeManager metrics display information on resources within individual nodes.
- containersFailed – Number of containers that failed to launch
How to Monitor YARN Metrics
To collect metrics for YARN, you can use the HTTP API. With your resource manager, host query the yarn metrics located on port 8088 by entering the following (use the qry parameter to specify the MBeans you want to monitor).
Resourcemanagerhost:8088/jmx?qry=java.lang:type=memory
ZooKeeper Metrics
ZooKeeper is a centralized service that maintains configuration information and delivers distributed synchronization across a Hadoop cluster. ZooKeeper is responsible for maintaining the availability of the HDFS NameNode and YARNs ResourceManager.
Some key ZooKeeper metrics you should monitor include:
- zk_followers – Number of active followers
- zk_avg_latency – Amount of time it takes to respond to a client request (in ms)
- zk_num_alive_connections – Number of clients connected to ZooKeeper
How to Collect Zookeeper Metrics
There are a number of ways you can collect metrics for Zookeeper, but the easiest is by using the 4 letter word commands through Telnet or Netcat at the client port. To keep things simple, we’re going to look at the mntr, arguably the most important of the four 4 letter word commands.
$ echo mntr | nc localhost 2555
Entering the mntr command will return you information on average latency, maximum latency, packets received, packets sent, outstanding requests, number of followers, and more. You can view a list of four-letter word commands on the Apache ZooKeeper site.
Hadoop Monitoring Software
Monitoring Hadoop metrics through JMX or an HTTP API enables you to see the key metrics, but it isn’t the most efficient method of monitoring performance. The most efficient way to collect and analyze HDFS, MapReduce, Yarn, and ZooKeeper metrics, is to use an infrastructure monitoring tool or Hadoop monitoring software.
Many network monitoring providers have designed platforms with the capacity to monitor frameworks like Hadoop, with state-of-the-art dashboards and analytics to help the user monitor the performance of clusters at a glance. Many also come with custom alerts systems that provide you with email and SMS notifications when a metric hits a problematic threshold.
In this section, we’re going to look at some of the top Hadoop monitoring tools on the market. We’ve prioritized tools with high-quality visibility, configurable alerts systems, and complete data visualizations.
Our methodology for selecting Hadoop monitoring tools
We reviewed the market for Hadoop monitors and analyzed tools based on the following criteria:
- A counter to record the log message throughput rate
- Alerts for irregular log throughput rates
- Throughput of Hadoop-collected system statistics
- Collection of HDFS, MapReduce, Yarn, and ZooKeeper metrics
- Pre-written searches to make sense of Hadoop data
- A free tool or a demo package for a no-obligation assessment
- Value for money offered by a thorough Hadoop data collection tool that is provided at a fair price
With these selection criteria in mind, we selected a range of tools that both monitor Hadoop activities and pass through the data collected by Hadoop on disk and data management activity.
1. Site24x7 (FREE TRIAL)
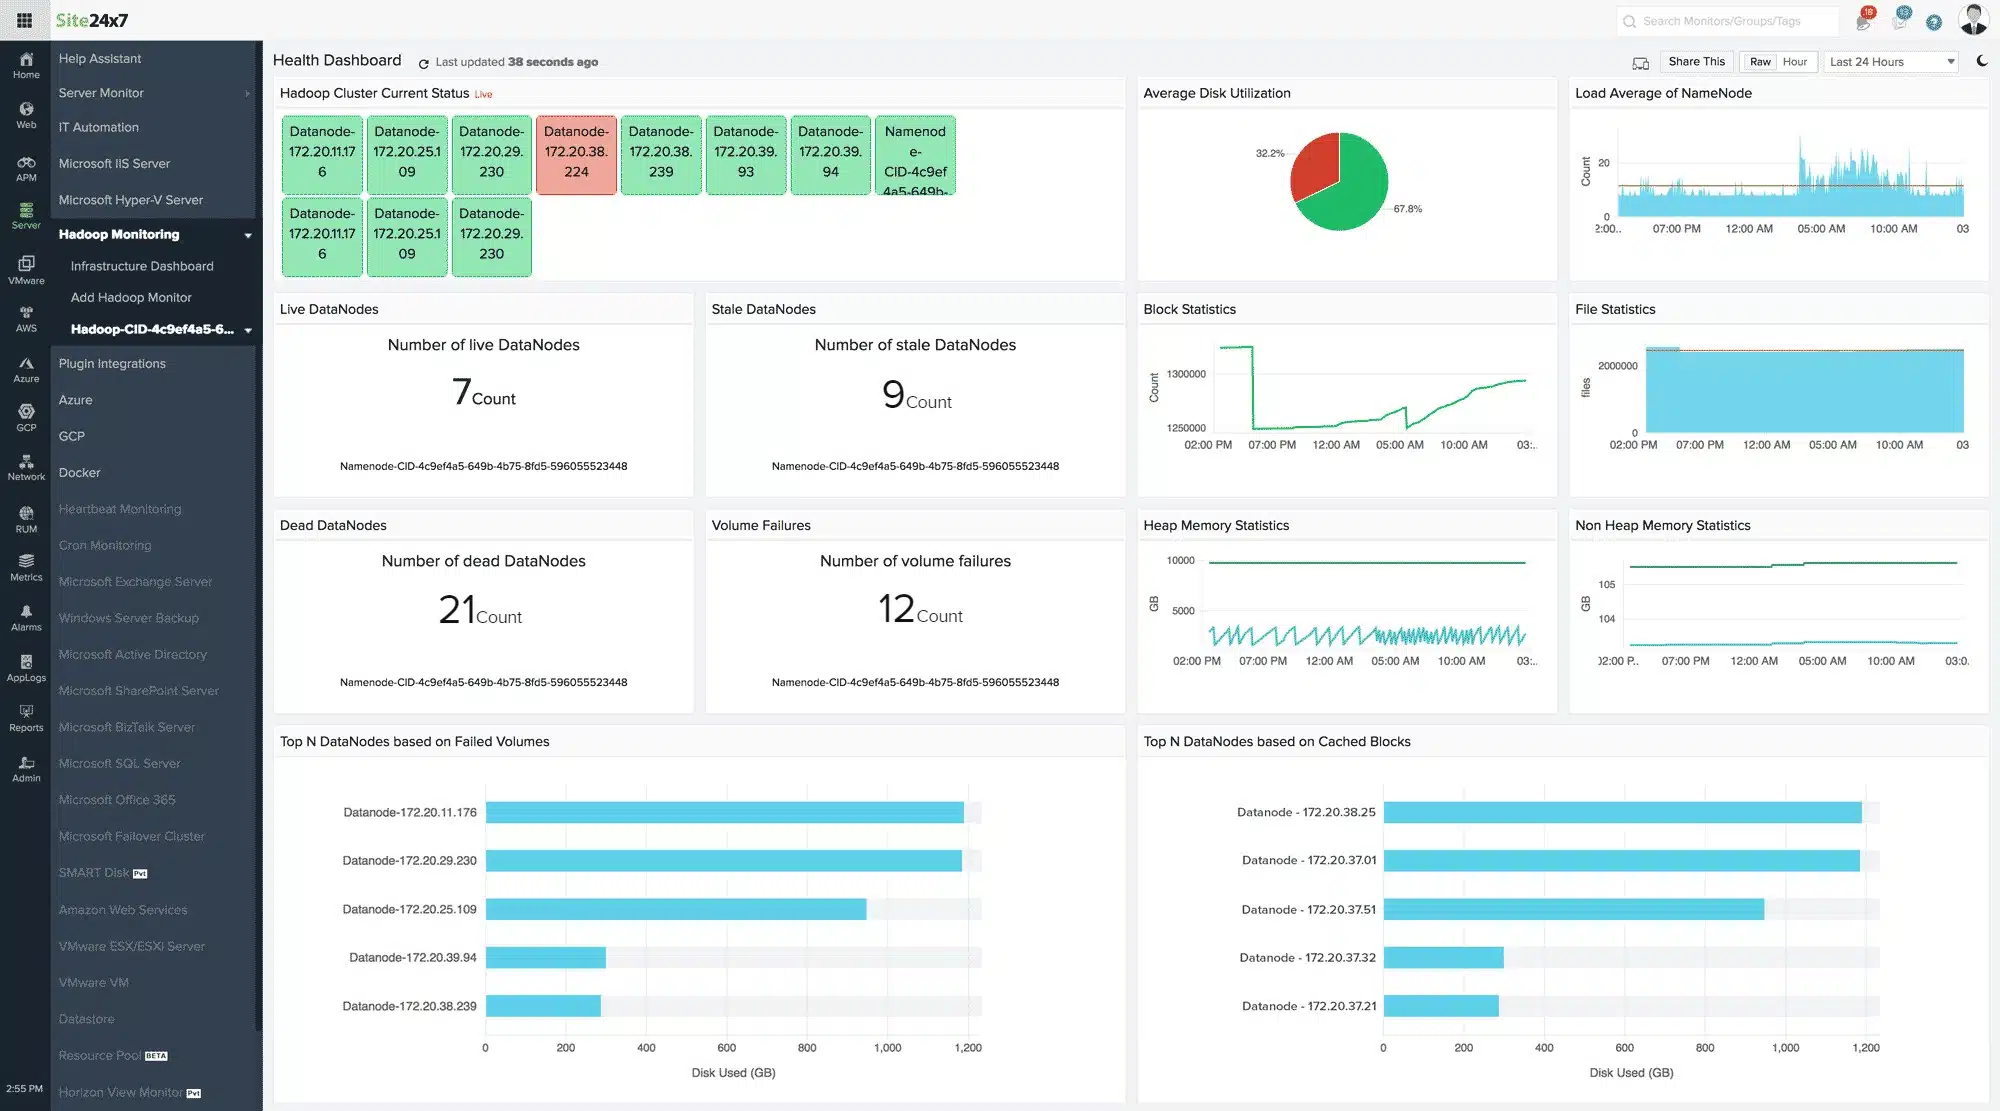
Site24x7 Infrastructure Monitoring is an extensible package that covers resources between servers and user-facing applications. Hadoop is one of the services that this package was designed to monitor. The Hadoop monitoring capabilities of the system are not built into the core package. Instead, the function is available as a plugin. The Infrastructure package has a library of hundreds of plugins that add sensors, search tools, and screens to the Site24x7 system.
Key features:
- Software monitoring
- Hadoop performance
- Server monitoring
- Network monitoring
- Response times
Why do we recommend it?
Site24x7 bundles all of its modules into plans, so when you sign up for the Infrastructure Monitoring service, you also get server and network monitoring services. If you also use containers, you will find plugins for the specific brand that you use in the Site24x7 plugins library.
Hadoop manages multiple storage servers and so the availability of space on those computers and the speed of connections between them are just as important monitoring topics as the running of the Apache Hadoop software. The Hadoop plugin adds a screen to the Site24x7 but it doesn’t block all of the other functions that you get from the platform.
By combining the Hadoop Monitoring capabilities of the plugin with the server and network monitoring services in the platform, you get full-stack observability and can identify the root cause of any performance problems as soon as they arise.
The Hadoop Monitoring service installs an agent on each of the Linux servers that you include in your storage cluster. This notes block usage and can improve access performance by reorganizing disk usage. The tool keeps track of free space on each server, warning ahead of time when space starts to run short.
Site24x7 combines all of its modules into plans and so, you don’t just sign up to the Hadoop Monitoring service. The Infrastructure plan is very affordable with a starting price of $9 per month. The system sets itself up by installing agents on the site and implementing an autodiscovery routine.
Who is it recommended for?
That base plan is sized to suit small businesses. Larger businesses can pay for capacity expansions. The client list of Site24x7 includes some very large multinationals, including SAP, NASA, and GoDaddy. This means that small companies can get the same quality of service as the biggest organizations in the world.
Pros:
- Provides Apache Hadoop software performance tracking
- Scans cluster servers during usage
- Optimizes storage usage
- Tracks activity on links between servers and the Hadoop system
- Full-stack observability
Cons:
- No on-premises version
You can start with a 30-day free trial.
EDITOR'S CHOICE
Site24x7 Infrastructure Monitoring is our top pick for a Hadoop monitoring tool because it also gives you performance tracking cluster servers and the connections between them and the data management application. This system will simultaneously track all of your other applications and you can also use it to monitor websites and Web applications. The Infrastructure plan includes storage for statistics so that you can analyze them for capacity planning as well as see them live in the Site24x7 dashboard.
Download: Get a 30-day free trial
Official Site: https://www.site24x7.com/
OS: Cloud based
2. ManageEngine Applications Manager (FREE TRIAL)

ManageEngine Applications Manager provides monitoring services to track all assets from server resources all the way up to the interfaces that are presented to users. This means that it watches all of the software systems that work together to create an application. Those components could be operating on your servers or on cloud platforms. Hadoop is one of the technologies that this package can monitor.
Key features:
- Physical server monitoring
- Storage systems monitoring
- HDFS statistics gathering
- Records file and directory growth
Why do we recommend it?
ManageEngine Applications Manager is able to monitor all of the systems that interact with your Hadoop data stores. That means the applications that access the data stored in Hadoop as well as the resources that enable Hadoop to function. Resource shortages are a major cause of performance impairment, so constant tracking provides immediate root cause analysis when problems arise.
The ManageEngine system detects how different services and applications interact and draws up an application dependency map to assist in performance monitoring. This record of interdependencies enables the system to monitor applications as a package or as individual components. The package also identifies potential problems when multiple unrelated applications are all running on the same server and accessing the same resources.
Hadoop isn’t the only application that the Applications Manager will monitor. It can track all of the applications on your system simultaneously and it lifts a lot of work off the shoulders of your support technicians by raising alerts if one of the many applications under management experiences problems.
The full Applications Manager package includes a number of important add-ons. These include a Synthetic Monitoring unit that can check on the availability of remote resources and test Web applications. Another useful extra is the APM, which provides distributed tracing to track the performance of third-party functions.
There are three editions for Applications Manager. The first of these is the Free edition. This is limited to monitoring five assets. The Professional edition has a starting price of $395 per year. The top plan, called Enterprise, is designed for very large organizations and its starting price is $9,595 per year.
Who is it recommended for?
The Free edition sounds like it would be good for small businesses. However, its limit of five assets is just too low to be useful for any enterprise, no matter how small. The Professional edition is accessibly priced and the majority of companies that are interested in the Applications Manager will probably go for that plan.
Pros:
- Deployment options include Windows Server and Linux
- Cloud hosting is possible on AWS and Azure accounts
- Multi-layer observability from the server up
- Simultaneous automated monitoring for multiple applications
Cons:
- The cost of add-ons can rack up the bill
You can test the ManageEngine Applications Manager package by accessing a 30-day free trial.
3. Datadog
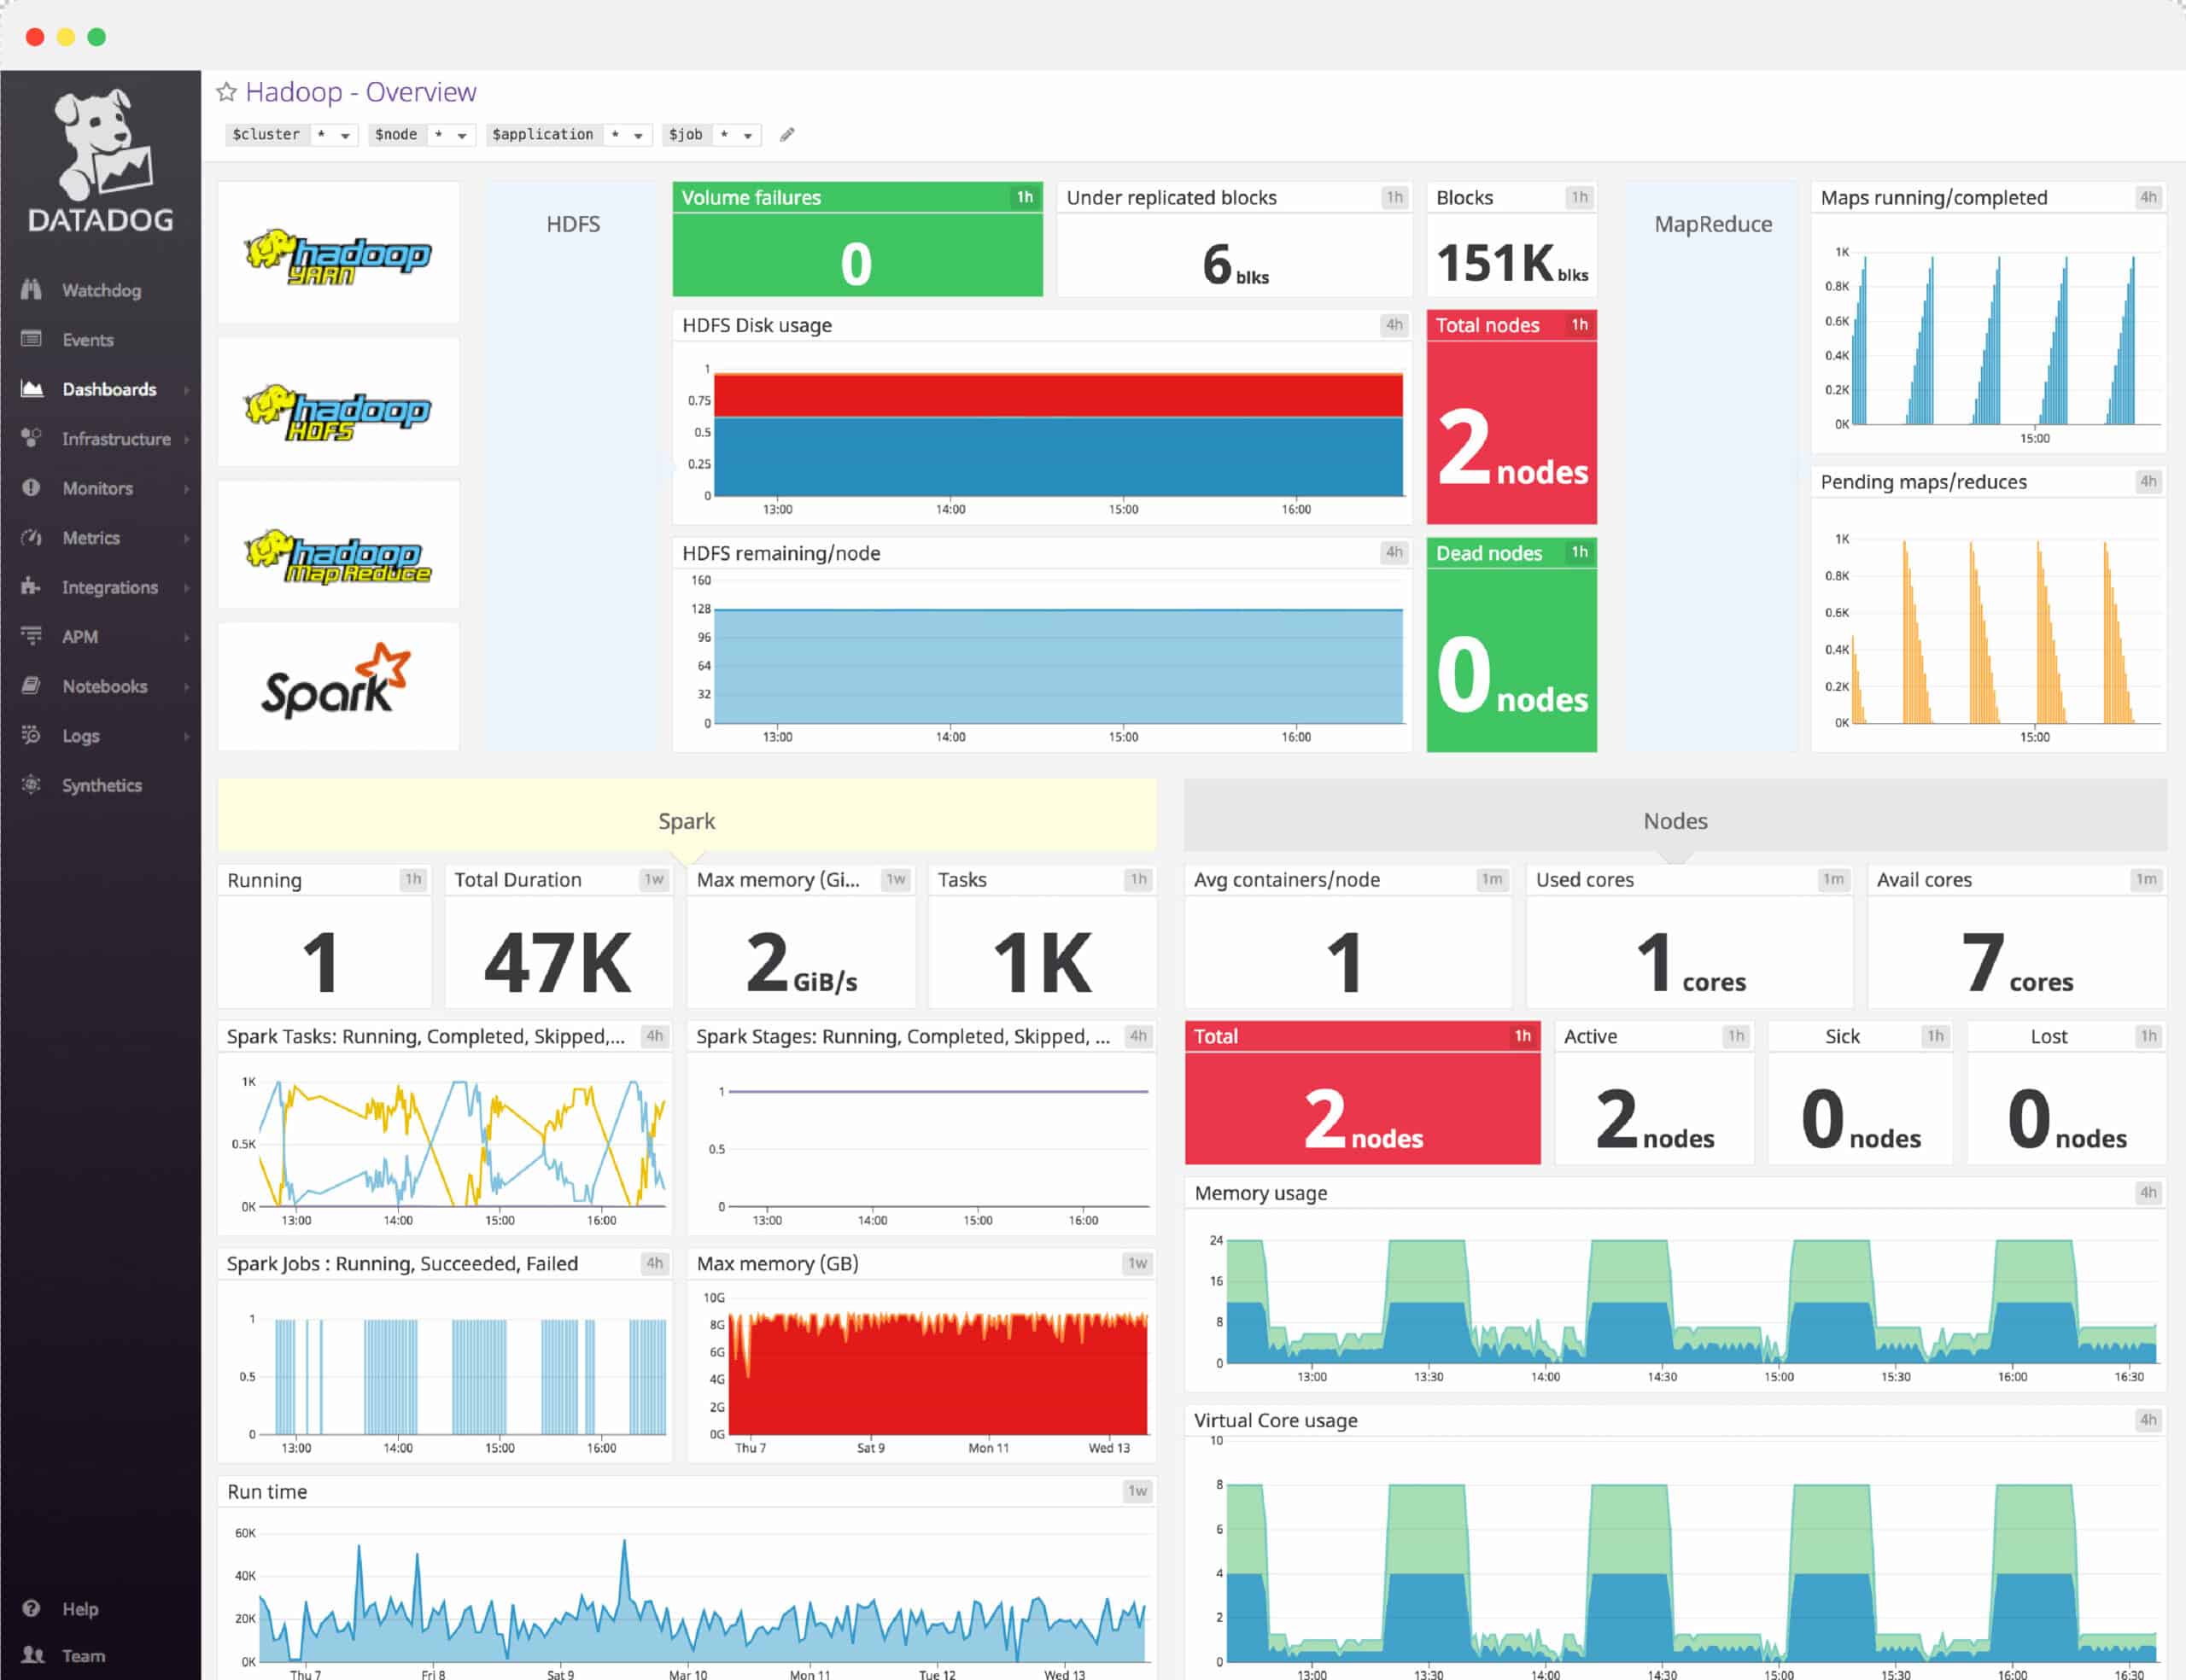
Datadog is a cloud monitoring tool that can monitor services and applications. With Datadog you can monitor the health and performance of Apache Hadoop. There is a Hadoop dashboard that displays information on DataNodes and NameNodes.
Key features:
- Hadoop monitoring dashboard
- Integrations for HDFS, MapReduce, YARN, and ZooKeeper
- Alerts
- Full API Access
Why do we recommend it?
Datadog Infrastructure provides a collection of integrations which tie together to monitor Hadoop. These are for HDFS, MapReduce, YARN, and Zookeeper. Meanwhile, the Infrastructure system also monitors server metrics, which in the case of Hadoop involves monitoring multiple servers simultaneously. You can also add on Network Performance Monitoring.
For example, you can view a graph of Disk remaining by DataNode, and TotalLoad by NameNode. Dashboards can be customized to add information from other systems as well. Integrations for HDFS, MapReduce, YARN, and ZooKeeper enable you to monitor the most significant performance indicators.
The alerts system makes it easy for you to track performance changes when they occur by providing you with automatic notifications. For example, Datadog can notify you if Hadoop jobs fail. The alerts system uses machine learning, which has the ability to identify anomalous behavior.
To give you greater control over your monitoring experience, Datadog provides full API access so that you can create new integrations. You can use the API access to complete tasks such as querying Datadog in the command-line or creating JSON-formatted dashboards.
Datadog is a great starting point for enterprises that want comprehensive Hadoop monitoring with wider cloud monitoring capabilities. The Infrastructure package of Datadog starts at $15 (£11.47) per host, per month. You can start the free trial version via this link here.
Who is it recommended for?
Datadog is a cloud platform but it can reach out to sites that run Hadoop through agents. Activating the four integrations for Hadoop amends that agent to collect specific Hadoop metrics. The Hadoop framework is complicated and very few monitoring packages can cover all of the elements of the system as successfully as Datadog.
Pros:
- Offers templates and prebuilt monitors for Hadoop monitoring and security enforcement
- Easy-to-use customizable dashboards
- Supports auto-discovery that builds network topology maps on the fly
- Changes made to the network are reflected in near real-time
- Allows businesses to scale their monitoring efforts reliably through flexible pricing options
Cons:
- Would like to see a longer trial period for testing
EDITOR'S CHOICE
Datadog is our top pick for a Hadoop monitoring tool because it is able to interface directly to the Hadoop platform and extract the activity metrics that are recorded by the system. The Datadog package is a platform of many tools and there is also a log collection and management service in there, so, not only can you process the data that Hadoop collects on its activities but also store the status messages created by the service and identify unusual variations in activity.
Download: Get a 14-day free trial
Official Site: https://www.datadoghq.com/free-datadog-trial/
OS: Cloud based
4. LogicMonitor
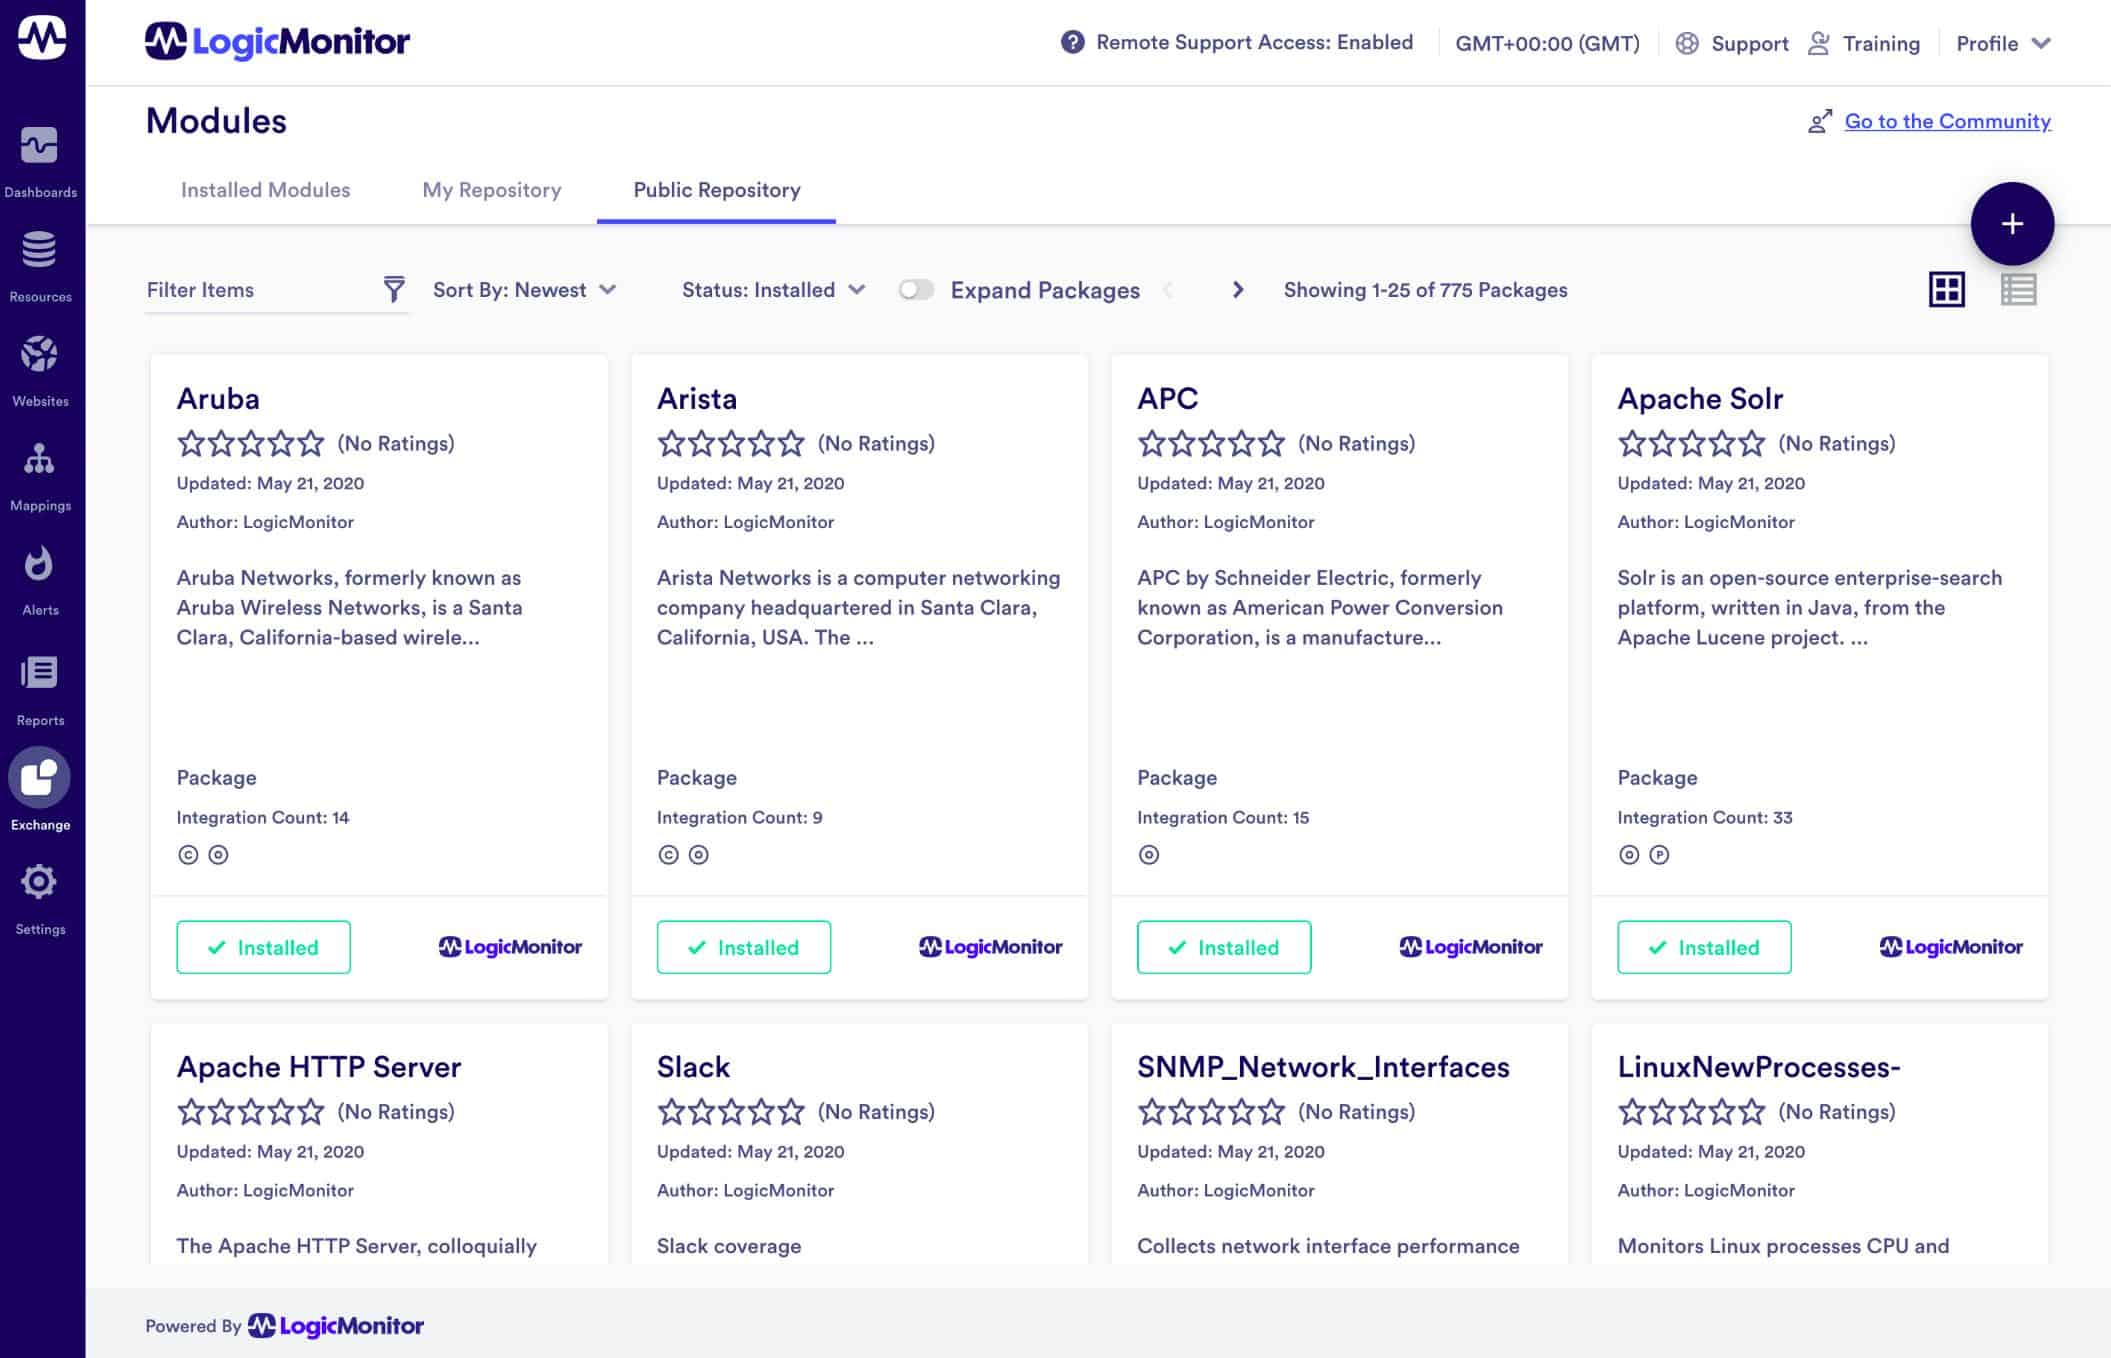
LogicMonitor is an infrastructure monitoring platform that can be used for monitoring Apache Hadoop. LogicMonitor comes with a Hadoop package that can monitor HDFS NameNode, HDFS DataNode, Yarn, and MapReduce metrics. For monitoring Hadoop all you need to do is add Hadoop hosts to monitor, enable JMX on the Hadoop hosts, and assign properties to each resource. The tool then collects Hadoop metrics through a REST API.
Key features:
- Monitors HDFS NameNode, HDFS DataNode, Yarn, and MapReduce metrics
- REST API
- Custom alert thresholds
- Dashboard
- Reports
Why do we recommend it?
LogicMonitor offers a number of modules on its platform and you would need the Unified Infrastructure Monitorings systems in order to track the performance of Hadoop clusters, be they on your servers or on the cloud. The package can simultaneously monitor other services that are unrelated to Hadoop.
To monitor these metrics you can set alert trigger conditions to determine when alerts will be raised. Alerts can be assigned a numeric priority value to determine the severity of a breach. There is also an escalation chain you can use to escalate alerts that haven’t been responded to.
For more general monitoring activity, LogicMonitor includes a dashboard that you can use to monitor your environment with key metrics and visualizations including graphs and charts. The software also allows you to schedule reports to display performance data. For example, the Alert Trends report provides a summary of alerts that occurred for resources/groups over a period of time.
LogicMonitor is ideal for enterprises that want to monitor Apache Hadoop alongside other applications and services. The tool has a custom pricing model so you need to contact the company directly to request a quote. You can start the free trial version via this link here.
Who is it recommended for?
Hadoop monitoring is part of the LogicMonitor general system monitoring service, so you aren’t restricted to just tracking Hadoop performance with your installation. Hadoop is a rare application, so if your company uses it, you probably also have a number of other essential data processing applications that need to be monitored as well.
Pros:
- Includes Hadoop monitoring and tailored dashboards
- Monitors application performance via the cloud
- Can monitor assets in hybrid cloud environments
- The dashboard can be customized and saved, great for different NOC teams or individual users
Cons:
- The trial is only 14 days, would like to see a longer testing period
5. Dynatrace
Dynatrace is an application performance management tool you can use to monitor services and applications. Dynatrace also offers users performance monitoring for Hadoop. The platform can automatically detect Hadoop components and display performance metrics for HDFS and MapReduce. Whenever a new host running Hadoop is added to your environment the tool detects it automatically.
Key features:
- Automatically detects Hadoop components
- DataNode and NameNode metrics
- Analytics and Data visualizations
- Dashboards
- Custom alerts
Why do we recommend it?
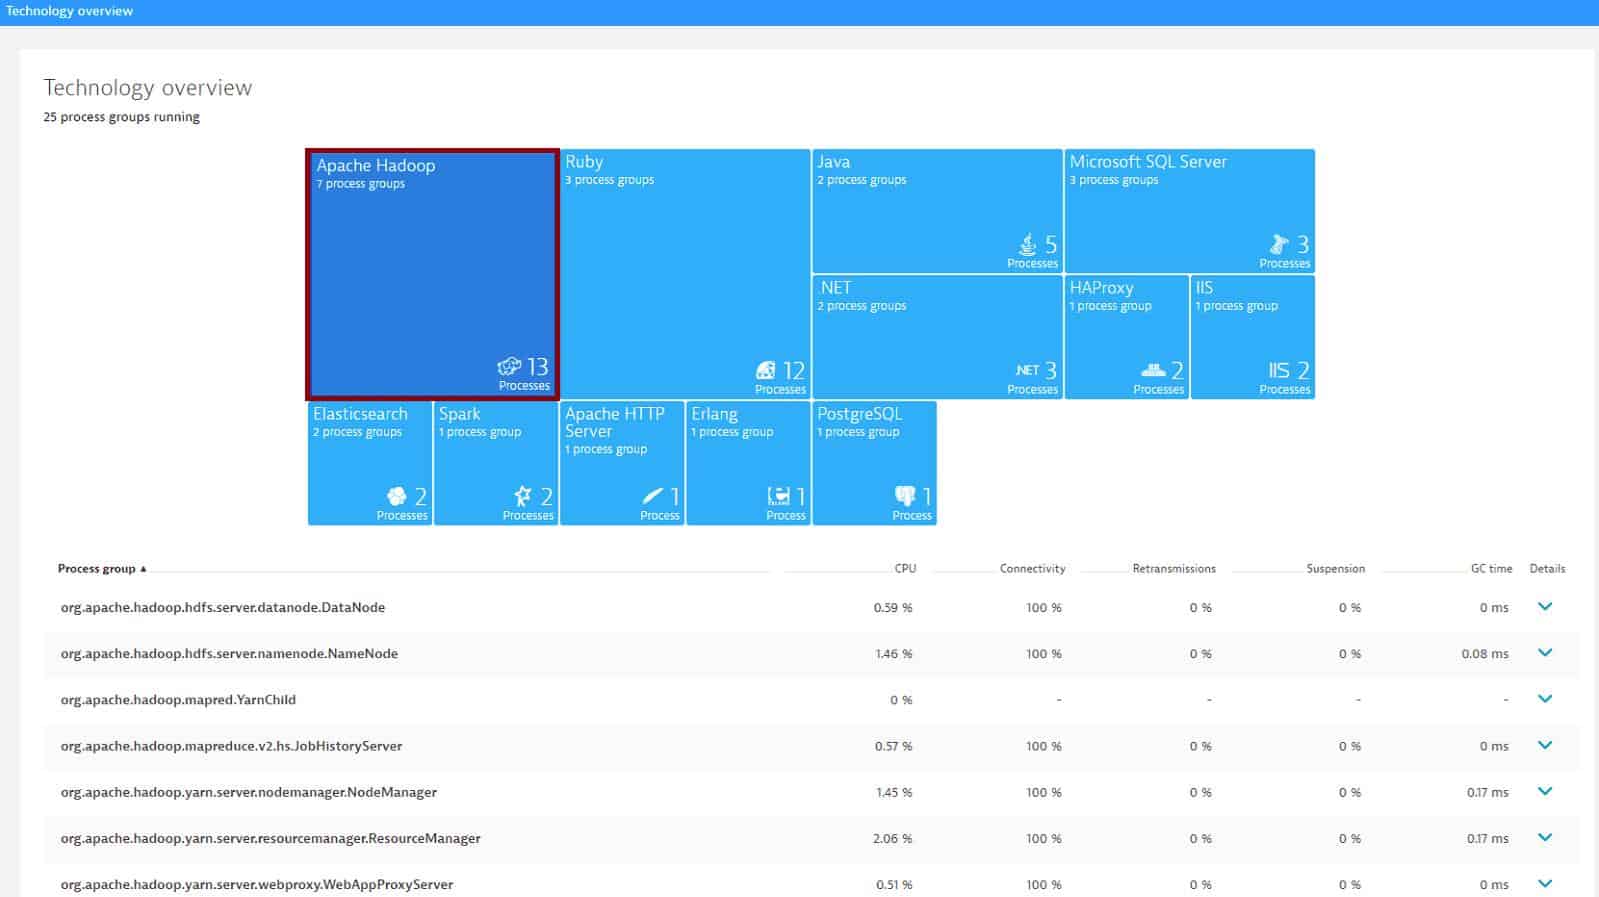
Dynatrace implements Hadoop monitoring as part of its Server Monitoring unit. The autodetection service for applications on a registered server will identify the presence of Hadoop components and group them together for performance tracking in the Dynatrace platform. You can see each element’s metrics is the dashboard screen.
You can monitor a range of NameNode and DataNode metrics. NameNode metrics include Total, Used, Remaining, Total load, Total, Pending deletion, Files total, Under replicated, Live, Capacity, and more. Types of DataNode metrics include Capacity, Used, Cached, Failed to Cache, Blocks, Removed, Replicated, and more.
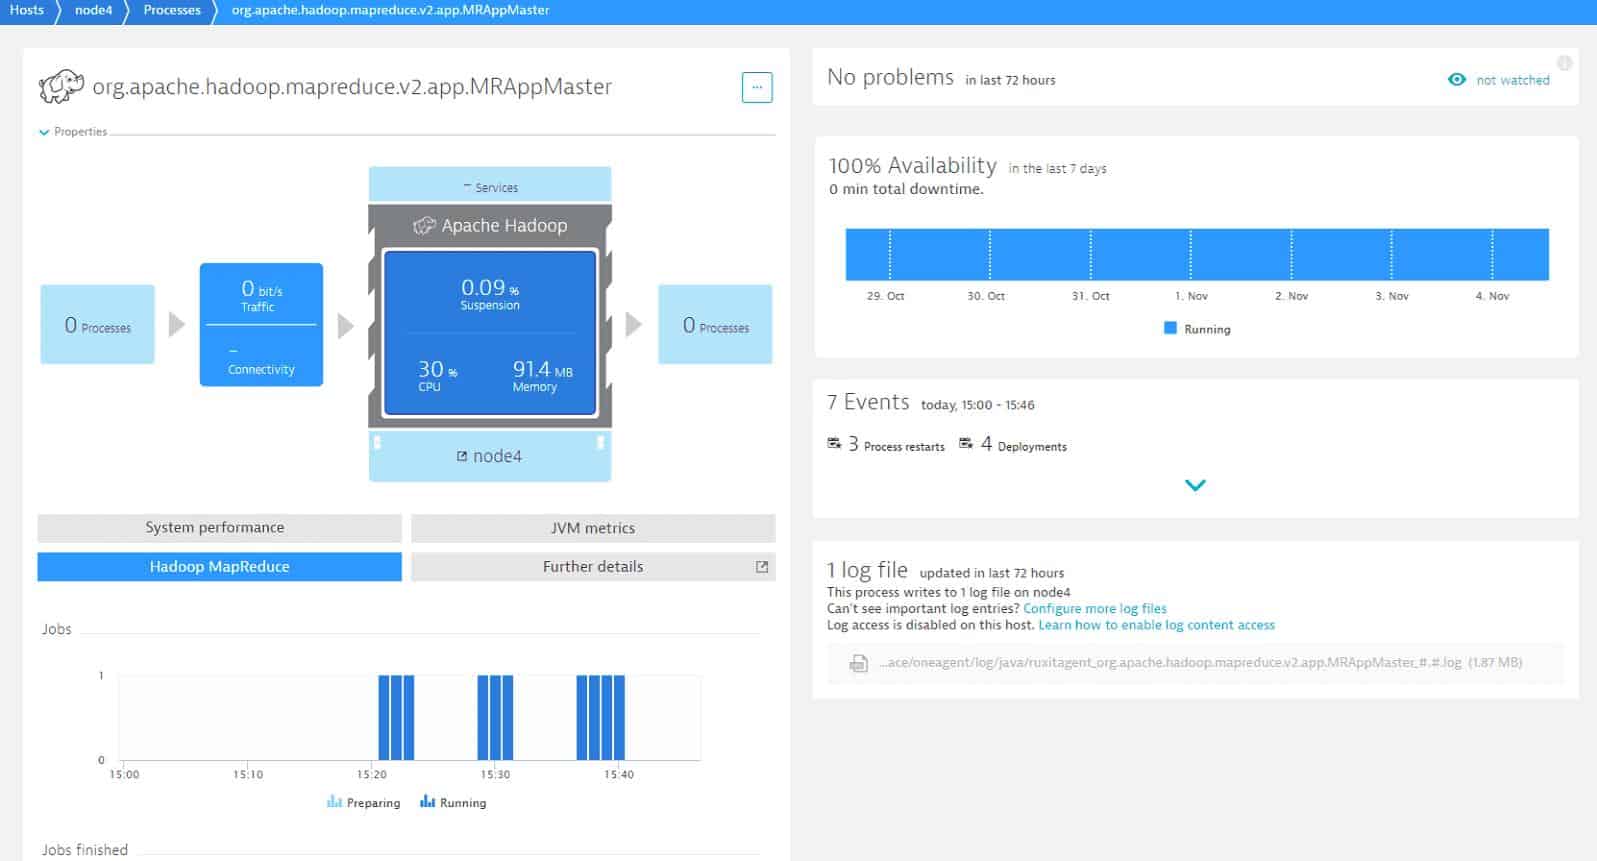
Dashboards provide a range of information with rich data visualizations. For example, you can view a chart of MapReduce maps failed or a bar graph of Jobs preparing and running. Custom alerts powered by anomaly detection enable you to identify performance issues, helping you to make sure that your service stays available.
Dynatrace is not only a top application monitoring tool but a formidable choice for monitoring Hadoop as well. There are a range of packages available including the Infrastructure monitoring package at $2 (£1.53) per month and the Full-stack monitoring package at $69 (£52.78) per month. You can start the 15-day free trial via this link here.
Who is it recommended for?
Dynatrace displays overviews of all servers working for a business and then clusters in detail. You can then choose to drill down to each individual server. In parallel, you can look at a Hadoop reporting overview and then drill down to each element or server instance. Get the Infrastructure Monitoring module or the Full Stack Monitoring package.
Pros:
- Offers support for Hadoop environments including templates dashboards
- Highly visual and customizable dashboards, excellent for enterprise NOCs
- Operates in the cloud, allowing it to be platform-independent
- Can monitor application uptime as well as the supporting infrastructure and user experience
Cons:
- Designed specifically for large networks, smaller organizations may find the product overwhelming
Choosing Hadoop Monitoring Software for Cluster Performance
Monitoring Hadoop metrics is vital for making sure that your clusters stay up and running. While you can attempt to monitor Hadoop metrics through JMX or an HTTP API, it doesn’t offer the complete monitoring experience that many infrastructure monitoring tools like Datadog, LogicMonitor, and Dynatrace do.
These tools offer features like custom dashboards and alerts that provide you with a more holistic perspective of what’s going on. By collecting all of your Hadoop performance data and putting it in one place, you’ll be able to monitor the performance of your systems much more effectively.
Hadoop monitoring FAQs
What are yarn metrics?
YARN stands for Yet Another Resource Negotiator. It is a component of Hadoop and it allocates system resources to processes running within Hadoop clusters. There are three main categories of YARN metrics:
- Cluster metrics
- Application metrics
- NodeManager metrics
What is JMX in Hadoop?
JMX stands for Java Management Extensions. It is a framework that supports monitoring for systems that are built with Java. Hadoop is written in Java and so its metrics collection occurs through JMX.
What are the main component of Hadoop?
Hadoop has three components:
- Hadoop HDFS – Hadoop Distributed File System, which is Hadoop’s storage manager
- Hadoop MapReduce – Hadoop’s processing unit
- Hadoop YARN – Hadoop’s resource management unit

