
The evolution of the modern network has brought many things but simplicity is not one of them. The variety of devices that have come to make up the contemporary networks is jaw-dropping. Computers, servers, switches, routers, and virtual machines are just some of the diverse infrastructure that comprises a modern network.
In this article, we’re going to look at the best infrastructure monitoring tools and software.
Here is our list of the best IT Infrastructure monitoring tools:
- Progress WhatsUp Gold EDITOR’S CHOICE This package of monitoring tools covers networks, servers, and applications, so it will cover all types of infrastructure. Runs on Windows Server. Start a 14-day free trial.
- eG Enterprise IT Infrastructure Monitoring (FREE TRIAL) An infrastructure monitoring package that links together resource dependencies to identify the root cause of performance issues. Runs on Windows Server and Linux, or take it as a SaaS package. Access a 30-day free trial.
- Site24x7 Server Monitoring (FREE TRIAL) Cloud-based tool that monitors networks, servers, and applications, including off-site infrastructure.
- ManageEngine OpManager Plus (FREE TRIAL) SNMP-based network performance manager and server monitor that installs on Windows or Linux.
- Netdata (FREE TRIAL) This infrastructure monitoring package is available as a SaaS platform and as an on-premises package. You can access a free Community edition for Linux, macOS, or Docker.
- Paessler PRTG Network Monitor (FREE TRIAL) All-in-one infrastructure monitor that covers networks, servers, and applications. Runs on Windows Server.
- Datadog Infrastructure Monitoring A cloud-based system monitor that will supervise the operations of networks and servers. This can be combined with an application monitor to gain deeper insights into traffic.
- Nagios XI Network monitor with a browser-based console that installs on Linux. The free version is called Nagios Core.
- SolarWinds Network Performance Monitor Network monitor that checks on device health statuses with SNMP procedures.
- N-able N-sight A remote monitoring and management tool that enables central IT departments to manage IT infrastructure on remote sites.
- Zabbix Free, open-source network monitoring tool that runs on Linux.
- Icinga 2 Highly customizable free, open-source network monitoring system that runs on Linux.
What is infrastructure monitoring?
Infrastructure Monitoring is the process of monitoring network infrastructure for vulnerabilities. Infrastructure monitoring tools monitor the health status, availability, and performance of devices throughout the network.
If an issue is detected the user is sent a notification that a problem has been found. The user can then use the infrastructure monitoring tool to generate a report to look deeper at the causes of the problem.
Using an infrastructure monitoring tool is important because attempting to stay on top of network events manually would be next to impossible. A network administrator could not realistically keep track of all physical and virtual resources.
The abundance of cyber threats online has made it a necessity to protect networks with infrastructure monitoring software. More sophisticated threats have led to a need for more advanced network monitoring.
The best IT infrastructure monitoring tools
Our methodology for selecting IT infrastructure tools
We reviewed the market for IT infrastructure monitoring systems and analyzed options based on the following criteria:
- Infrastructure discovery and documentation
- Stack dependency mapping
- Correlation between software activity and resource usage
- Live activity charts
- Alerts for capacity problems
- A free trial or a demo system for a chance to test the system before buying
- Value for money from a reliable tool that is offered at a fair price
With these selection criteria in mind, we looked for a number of infrastructure monitoring tools that we would be happy to recommend.
1. Progress WhatsUp Gold (FREE TRIAL)

Progress WhatsUp Gold is a package of system monitoring tools that can give you an infrastructure monitoring service or just a network device monitor, depending on which plan you choose. The bundle is an on-premises software package and it is able to monitor both on-site and cloud-based assets.
Key Features:
- Network Discovery: The network device monitor will scan the network, discover, document, and map all devices.
- Full-Stack Monitoring: Higher plans provide network, server, application, and cloud monitoring.
- Performance Alerts: Provides automated monitoring through an alerting system that warns of gathering problems.
- Multiple Environments: Works well across on-premises, cloud, and hybrid environments.
- Action Policies: Enables you to create policies for automated recovery.
Why do we recommend it?
WhatsUp Gold is an easy-to-use monitoring package. The service sets itself up by scanning the network and populating the monitoring dashboard with details of all discovered devices and it will also draw up a network map. Higher plans also provide server and application monitors, which discover assets and provide continuous monitoring.
The WhatsUp Gold package provides automated infrastructure monitoring through a series of modules. Not all buyers get the full package because there are four editions, each with different components. The system includes network traffic monitoring services that allow administrators to measure performance and plan for future capacity requirements.
Who is it recommended for?
This package is probably a little too much for small businesses. However, any mid-sized or large enterprise would benefit from using WhatsUp Gold. The system is able to monitor both cloud-based systems and on-premises assets simultaneously, so it is perfect for the hybrid environments that many businesses operate in the present day.
Pros:
- Infrastructure Monitoring: Networks, endpoints, storage systems, and middle-ware.
- Asset Management: Maintains an inventory of hardware and software assets.
- Configuration Management: Standardize and protect device settings.
- Customizable Dashboards: Enables customization based on roles.
- Real-time Alerts: Generates real-time alerts for quick decisions.
Cons:
- No SaaS Option: Only available as an on-premises software package.
Progress WhatsUp Gold runs on Windows Server and is available in four editions. The first of these, Business, is a network device monitoring package. The other three, called Enterprise, Enterprise Plus, and Enterprise Scale, include multiple modules to cover all types of infrastructure assets. You can test the WhatsUp Gold system by accessing a 14-day free trial.
EDITOR'S CHOICE
WhatsUp Gold is the best IT infrastructure monitoring platform on our list as it can monitor a wide range of networks, endpoints, wireless controllers, storage systems, middleware, virtual machines, and more. It maintains an inventory of both software and hardware assets and even creates a detailed interactive map of your entire network infrastructure. It can automatically detect new assets in Layers 2 and 3 of the OSI model to provide comprehensive visibility. Using this tool, you can log events and also quickly monitor, filter, and search through them. You can even set up action policies to get real-time alerts. All this means you will always have complete control over your infrastructure.
Download: Get a 14-day free trial
Official Site: https://www.whatsupgold.com/
OS: Windows Server 2012 or later
2. eG Enterprise IT Infrastructure Monitoring (FREE TRIAL)
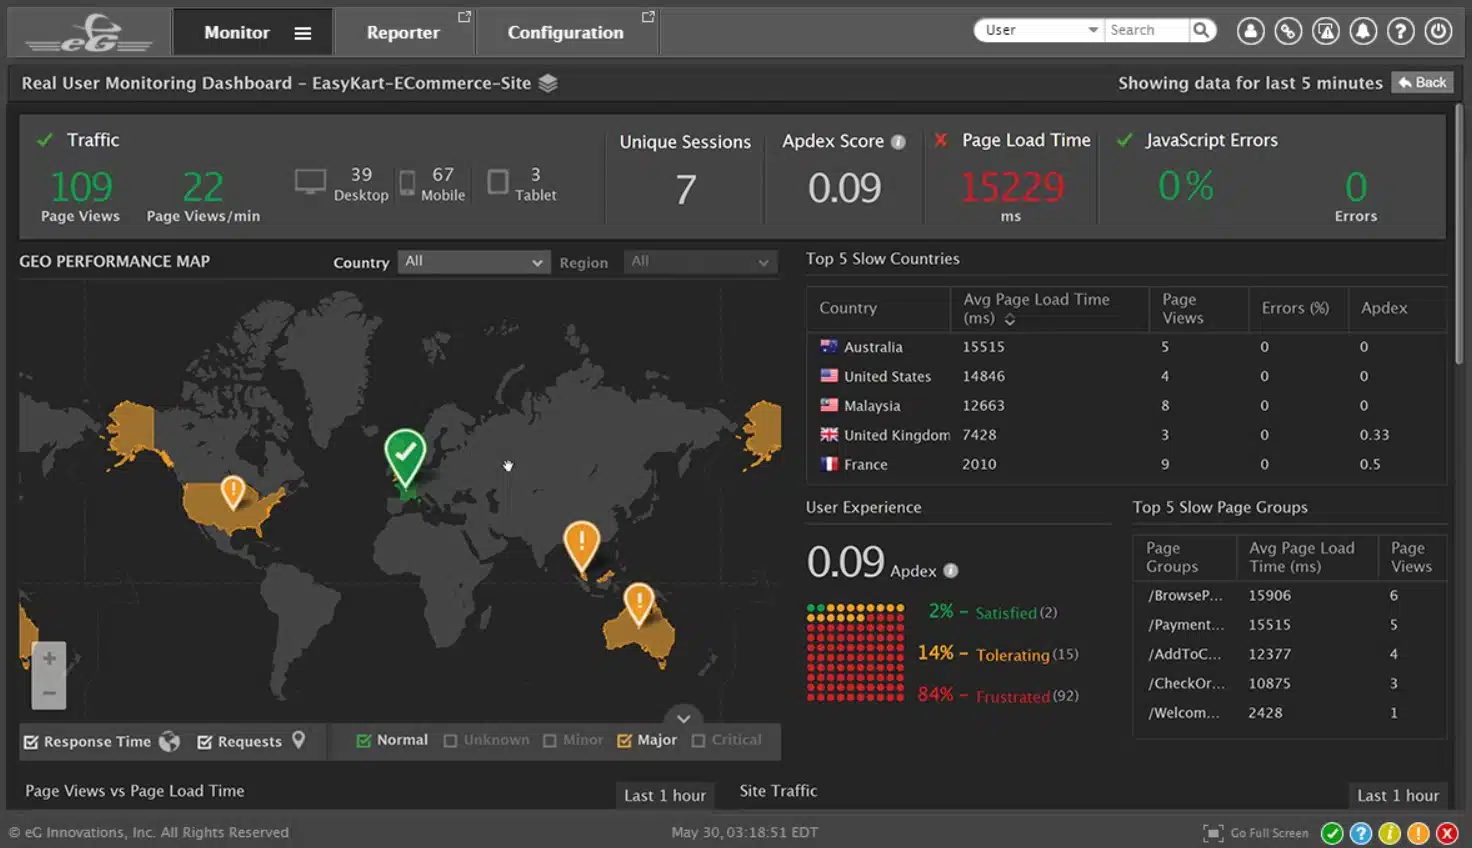
eG Enterprise, from eG Innovations, is an infrastructure and application monitoring package that provides full stack system performance tracking. This live dependency mapping identifies capacity issues with resources that provides immediate root cause analysis when issues arise.
Key Features:
- Full Stack Monitoring: Networks, servers, and applications
- Hybrid Monitoring: Cloud platforms and LANs
- Deployment Options: SaaS package or self-hosted
Why do we recommend it?
The eG Enterprise IT Infrastructure Monitoring package will watch over on-premises systems and cloud services. Those cloud systems can be SaaS packages or bare platform accounts. The tool discovers all equipment and applications on a site and creates hardware and software inventories. The monitoring service watches standard activity and then alerts when anomalies arise.
This is a monitoring service for hybrid systems with capabilities to track the performance of physical, virtual, and cloud resources. The capabilities of this package are vast – it is able to monitor more than 200 technologies. To prevent your console from getting too crowded with trackers for services that you don’t have you can decide which integrations to turn on or off. This customizes your dashboard so that you only get the monitors that you need.
Examples of integrations offered by the eG Enterprise system are AWS, Azure, Exchange Server, DNS servers, NGINX, IIS, and Apache Web servers, and virtualization systems, such as VMWare and Hyper-V. Other integrations enable the eG Enterprise system to exchange data with other applications, such as GitHub, Jenkins, and Microsoft Teams.
The performance issue tracking system in the eG Enterprise package is particularly strong on resource monitoring. For example, the service gathers capacity information on servers, such as the CPU and memory capacity of the computer. The system then watches all of the processes that run on the computer and notes the resource requirements of each. Spotting variations and growth in demand for each application, the service can predict what resource will soon be needed.
If the machine learning process deduces that a resource shortage is on the horizon, the eG Enterprise system raises a warning alert. This gives technicians time to head of shortages that will cause applications to run badly or hang.
Alerts can be channeled into your service desk system. The eG Enterprise notification system not only triggers a ticket to request technician attendance, but it also sends through a closing message to let the team know when the problem has been fixed. The system is able to interface to ServiceNow, AutoDesk, and FreshService, among other ticketing systems.
The extra APM package that is available for eG Enterprise provides extra monitoring services for specific systems. Again, these tools identify potential resource shortages that can damage the performance of applications. The service maps application dependencies so that if problems arise, the root cause of the issue is immediately apparent.
Demand alters over time and so, if you add new resources to your network or servers, the monitor’s calculations on demand are going to be thrown off. The machine learning system in eG Enterprise means that baselining isn’t set in stone, but is constantly updated through each metric gathering cycle.
Who is it recommended for?
This is a good package for mid-sized businesses that run both on-premises and cloud-based resources. The target audience is widened by the deployment options for the system. These are a SaaS subscription service, a software download on a subscription, or a perpetual license for the software package.
Pros:
- AI-Based Assessments: Machine learning provides adjustable performance baselining
- Predictive Resource Shortage Alerts: Buys time for technicians to fix problems before the users notice a performance issue
- Application Dependency Mapping: Aggregates upcoming demand and compares that to available resources
Cons:
- No Price List: You have to inquire for a quote
The eG Enterprise system is available as a software package for Windows Server or Linux and it is also offered as a SaaS platform. Access a 30-day free trial of the infrastructure and APM modules of eG Enterprise for assessment.
3. Site24x7 Server Monitoring (FREE TRIAL)
Site24x7 Server Monitoring is a cloud-based infrastructure monitoring system. It is able to track the performance of networks, servers, applications and websites. As a site monitor, Site24x7 needs to keep track of all of the underlying services that can cause performance issues. This overview also extends out to Cloud-based services.
Key Features:
- Hybrid Observability: Monitor cloud and premises
- Asset Discovery: Creates hardware and software inventory
- Application Dependency Mapping: Helps with predictive alerts and root cause analysis
Why do we recommend it?
Site24x7 Server Monitoring is part of a cloud platform of infrastructure and application tracking tools. The platform provides full stack monitoring for networks, servers, and applications. So, it monitors all of a business’s infrastructure behind the applications and the applications as well.
As it is an online service, you don’t need to install any software on your site in order to use Site24x7. The console is accessed through a browser and all data storage is included with the plan and held offsite. That means you don’t even need to be running your own servers. If you contract in virtual servers and pay for hosting for your websites, those resources can be monitored by Site24x7.
Site24x7 can monitor hosts running Windows, Windows Server, Linux, FreeBSD Unix, and OS X. It can also interact with Microsoft Azure and Amazon Web Services (AWS) cloud servers.
As an integrated infrastructure monitor, Site24x7 is particularly well suited to the management of virtualizations. It will monitor Microsoft Hyper-V and VMware virtualization and also Docker Containers.
Site24x7 is part of the same group of companies as ManageEngine (see below). While ManageEngine is well-established in the infrastructure monitoring tool market, Site24x7 is a relatively new enterprise. However, the parent company, Zoho Group, has been able to apply all of the expertise that it has in its ManageEngine division to the creation of Site24x7. This has the advantage of creating a new and innovative service out of a history of expertise.
There are a lot of similarities between ManageEngine products and Site24x7. One big difference is the charging structure. Site24x7 is Software-as-a-Service. So, it is charged for by monthly subscription, whereas you pay a one-time bill to access ManageEngine software.
Site24x7 is available in five editions. The lowest of these is a restricted Free edition. This will enable you to monitor up to five servers or URLs. The four paid plans are called Starter, Pro, Classic, and Enterprise. All of these plans can be enhanced by add-ons in case the standard editions bundles don’t fully cater to your requirements. You get more services with each progressively more expensive plan and you can bring down the cost of the service by paying annually instead of monthly.
Who is it recommended for?
Site24x7 sells subscriptions to bundles of monitoring modules. Each plan is slightly different and the Infrastructure edition gives you network device, traffic, server, and services monitoring plus log management, and synthetic and real user monitoring for websites. Packages are sized and priced for small businesses and larger companies pay for capacity expansions.
Pros:
- Plans Provide Access to All of the Modules on the Platform: Monitoring for networks, servers, applications, services, cloud systems, and websites
- Customizable Dashboards: Put all of the monitors that are important to you on one screen
- Automated Traffic Analysis: Also ad-hoc system troubleshooting tools
Cons:
- No On-Premises Version: This is a SaaS platform
You can get a 30-day free trial of the system. At the end of the trial period, you have the option of selecting a paid plan and subscribing. If you choose not to pay, your account will be switched over to the Free edition, which you can use in perpetuity without paying anything.
Further Reading: Site24x7 – Full Review
4. ManageEngine OpManager Plus (FREE TRIAL)

ManageEngine OpManager Plus is a server monitoring tool for monitoring IT infrastructure on networks that runs on Windows and Linux. The platform is capable of monitoring physical and virtual IT infrastructure. Virtual infrastructure that you can monitor with ManageEngine OpManager includes VMware, Hyper-V, and Xen.
Key Features:
- A Megapack of ManageEngine Tools: Everything you need to run a network successfully
- Monitor Physical and Virtual Systems: Networks, WiFi, servers, cloud platforms, virtualizations, VPNs, and virtual servers
- Network Management: IP address management and configuration management
Why do we recommend it?
ManageEngine OpManager Plus monitors all of your IT systems, including networks, servers, services, and applications. The network monitoring and management sections of this package are particularly strong. They provide network device status monitoring, device configuration management, IP address management, virtualization monitoring, and traffic analysis. Server monitoring covers storage systems and cloud platforms.
There over 2000 network performance monitors that can be accessed through a customizable dashboard. In terms of customization, ManageEngine OpManager Plus also has more than 200 different widgets that you can use to create your own dashboards.
Automation is another invaluable feature offered by ManageEngine OpManager Plus. With automation, you can configure automated responses for troubleshooting. This is managed via the workflow automation view where you can create automated responses without the need for coding. For example, you can select ‘Execute Windows Script’ to respond once certain activity is recognized.
In addition, OpManager Plus has an alerts system. Notifications are sent to the user via email and SMS. Alerts are shown on the All Alarms page where you can view a list of all alarms with supporting information. You can also view pie charts that categorize active alarms as Critical, Trouble, Attention, or Service Down.
There are three versions of OpManager Plus available: the Free, Essential, and Enterprise versions. The free version supports up to 10 devices with basic network monitoring.
Who is it recommended for?
This is a very large package and all of its components are available for purchase individually. The benefit of buying the package means that you don’t have to shop around for all of your system monitoring needs because you get them all with one purchase. Editions cater to all business sizes.
Pros:
- Utilizes SNMP to Discover network Devices and Constantly Monitor their Statuses: Also creates a network inventory and topology map
- Device Availability Monitoring: Traffic monitoring
- Log Management: Provides opportunities to extend monitoring capabilities
Cons:
- Composed of Modules that are Available Individually: Look through the list of components because you might be able to save some money
The Essential version expands on this by supporting up to 1000 devices with automatic network mapping. The Enterprise version is aimed firmly at larger organizations and supports up to 10,000 devices. Download the 30-day free trial.
5. Netdata (FREE TRIAL)
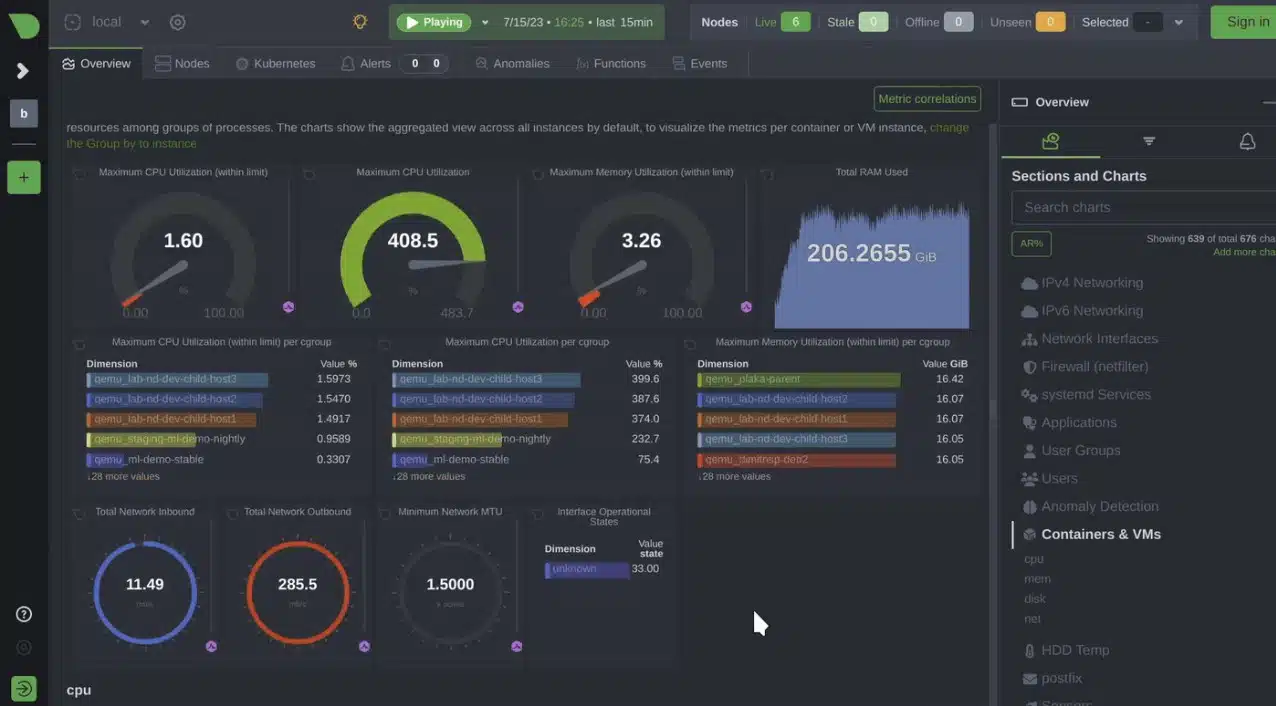
Netdata is a monitoring tool that covers all components of infrastructure plus applications. This service is delivered as a central package that covers networks, servers, and basic services. Users then activate integrations to add on monitoring for specialized infrastructure technologies and applications.
Key Features:
- Cloud System Monitors: Provides platform monitoring as standard and then you select the relevant application integration to add to that
- Extensions for Application Monitoring: Includes databases, AWS services, and Apache products
- Option to Use Free Data Collectors: Skip the paid Netdata package and just use the data collectors to provide inputs to your own custom monitoring system
Why do we recommend it?
Netdata is a system monitoring package that collects data from every element of infrastructure, including servers, cloud platforms, virtual environments, and containers. This package started out as an open source project and now also has fully-supported SaaS and on-premises subscription options. The package includes a console but you can use it as a collector for other monitoring systems.
Despite being called Netdata, this package doesn’t focus on network data; it concentrates its monitoring duties to the server and everything on top of it. However, the service can be expanded by integrations that collect data from network interfaces on each server and can capture net.inet data plus information from wireless APs.
Netdata provides a free data collector for each platform. Those units can be used to collect data and send them to another monitoring system, a custom-built console of your choosing, such as Grafana, or channel data through Elasticsearch to Kibana.
The monitoring unit installs on Linux or macOS. If you have Windows, you can run it over Docker. The console version will accept data feeds from the Netdata agents and you can also choose to use standard data collectors such as fluentd or Systemd Services.
Who is it recommended for?
This is an incredibly flexible package. You can use it as a collector or use the console with Netdata collectors or other data-gathering systems. The console can receive data from Elasticsearch or you can send metrics through Elasticsearch on to other console systems. Get the free Community system or opt for the Cloud or on-premises paid versions.
Pros:
- Monitors Cloud Platforms: AWS, Azure, and Google Cloud Platform
- SaaS Plan: Minimum charge is $540 per year
- On-Premises Plan: Minimum charge is $9034.20 per year
Cons:
- Not Available for Windows: The on-premises plan runs on Linux or macOS
Netdata gives you lots of deployment options and that means there is a lot to investigate before you commit to this tool as your infrastructure monitoring system. The best way to assess its suitability is to sign up for a free trial.
6. Paessler PRTG Network Monitor (FREE TRIAL)
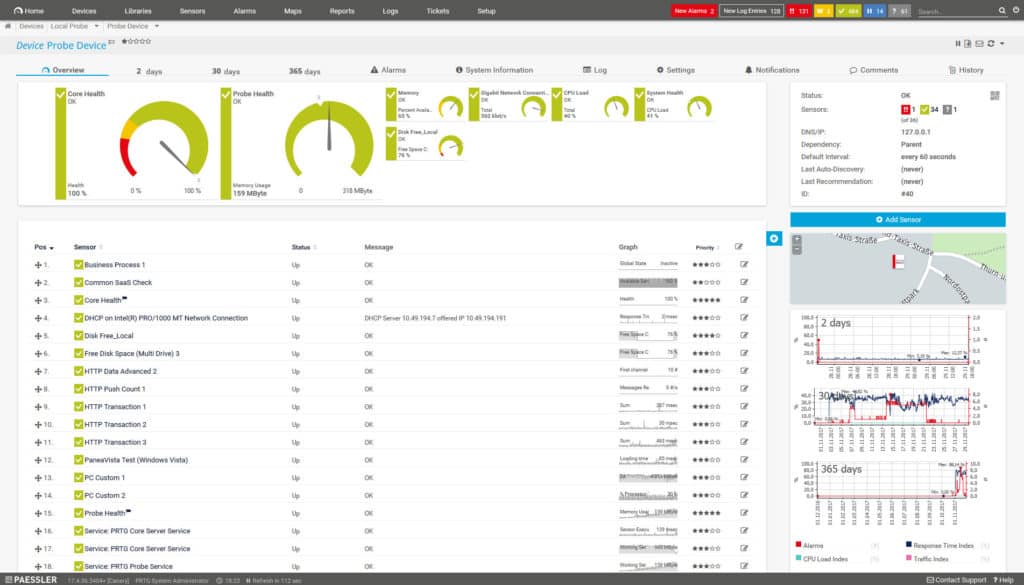
PRTG Network Monitor is an infrastructure monitoring platform that can monitor device health and network usage. Technologies supported by PRTG Network Monitor include SNMP, NetFlow, jFlow, sFlow, SSH, WMI, PING, SQL and more.
Key Features:
- Flexible Package of Sensors: Pay for a sensor allowance and choose which to activate
- Device Discovery: Creates hardware inventory and network topology map
- Free Option: Gives you an allowance of 100 sensors
Why do we recommend it?
Paessler PRTG Network Monitor offers performance tracking for servers, services, and applications as well as networks. Its services include network discovery and mapping and it will also cover wireless systems. The server and applications features can also track could platform performance and the operations of services on those platforms.
The wide variety of technological support provides you with everything you need to have a clear grasp of what is happening on your network. The setup process takes a matter of minutes so that you can deploy quickly.
To keep the monitoring environment up-to-date, PRTG Network Monitor uses automatic network discovery. However, you need to ping IP ranges in order to do this. Once this is done, you are free to start creating sensors to monitor devices throughout your network.
To monitor your network you will need a range of different sensors to monitor different segments of your network. There are over 200 sensors that you can use. For example, there are Bandwidth Monitoring Sensors, SNMP sensors, Linux/Unix/OS X Sensors, and IoT sensors to name a few.
When using PRTG Network Monitor you have complete control over the dashboard. You can use the PRTG map designer to create new dashboards with real-time maps and the status of live devices. You can then generate a link to send so that other key decision-makers can view performance data.
One of the reasons why PRTG Network Monitor is so popular is that it is free for the first 100 sensors. After you exceed the 100 sensor limit you will have to pay for an upgrade.
Who is it recommended for?
The PRTG system is a bundle of tools and every buyer gets the same large package. However, each client decides which of the monitors in the package to turn on. Thus, it is possible to tailor the package so you only pay for the functions that you need.
Pros:
- Network Device and Server Monitoring: Uses a combination of packet sniffing, WMI, and SNMP
- Network Traffic Monitoring: Uses flow protocols, including NetFlow, sFlow, and J-Flow
- Alerts for System Problems: Notifications forwarded by SMS, email, or third-party integrations into platforms like Slack
Cons:
- Weak on Software Monitoring and Management: No software license management or patch management
The paid versions of PRTG Network Monitor start at $1600 (£1,221) for 500 sensors with one server installation and go all the way up to $60,000 (£45,820) for unlimited sensors and five server installations. There is also a 30-day free trial.
7. Datadog Infrastructure Monitoring
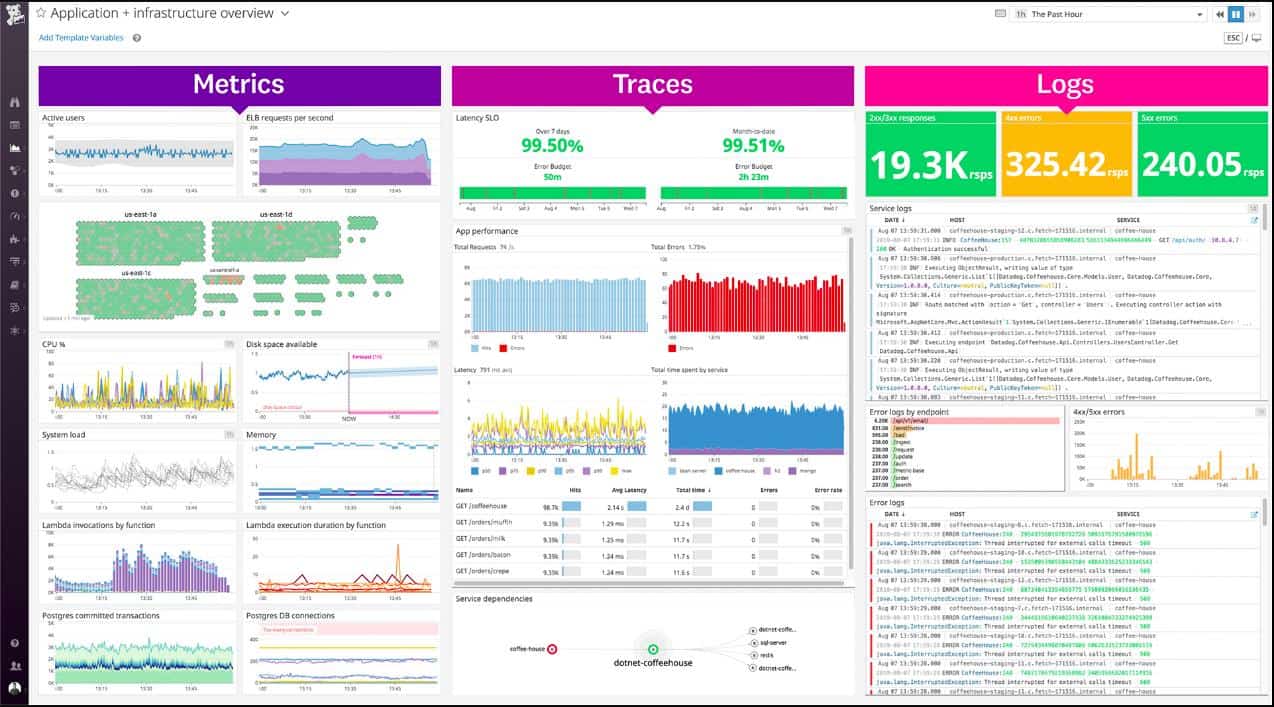
Datadog Infrastructure is a module of a complete systems monitoring service that is available in the cloud. As it is a remote system, the Datadog Infrastructure monitor isn’t limited to monitoring networks and servers on one site. It can easily cover WANs and cloud-based servers as well.
Key Features:
- Constant System Monitoring: Looks for slow or unavailable systems
- Discovers Infrastructure: Creates hardware and software inventories
- Physical and Virtual: Monitor equipment and virtualizations
- Server Capacity Monitoring: Watches processor activity
Why do we recommend it?
Datadog Infrastructure Monitoring discovers and watches the logical infrastructure that lies behind user-facing software. In order to monitor Web applications, you would need to add on the APM module. However, this tool can monitor other applications such as databases, virtualizations, and Web servers. It also monitors physical server resource availability.
The services will map your network automatically and keep network topology maps updated whenever you make changes to your network layout. The system also automatically generates a network device inventory and begins live monitoring as soon as you subscribe to the service. The Datadog Infrastructure monitoring system is easy to set up and includes a wizard to get the right agents installed on your servers to start the monitoring process.
As well as tracking standard network traffic, Datadog has a particular ability to identify containers and virtualizations, tracking all of the supporting services and their performance to ensure smooth delivery of services and data.
There is a Free version of Datadog Infrastructure, which allows you to monitor a system that includes up to five hosts. The paid plans include an alert system, which enables you to get on with other tasks and only switch focus to the network performance when a potential problem is spotted. The lower of the two paid plans, which is called Pro, uses thresholds to identify warning conditions. The higher plan, which is called Enterprise, includes an AI-based machine learning method, called Watchdog, to spot potential problems from combinations of activities and performance indicators.
Network and server performance data is tracked live but is also stored for analysis. A Network Performance add-on gives you the ability to analyze traffic flows and implement traffic shaping.
Who is it recommended for?
This cloud-based system is able to monitor multiple sites. You need to install an agent on each site that is to e monitored. There is a Free edition available for the package. This will monitor five hosts and retains data for one day. Otherwise, it is a very extensive service.
Pros:
- Cloud-Based SaaS Platform: Access the console anywhere through any standard Web browser
- Extendible System: Has a library of more than 700 integrations
- Hybrid Observability: Tracks activity on premises and on the cloud
- Add on Other Modules: Infrastructure Monitoring is the central unit on the Datadog platform
Cons:
- Needs the Network Device Monitoring and Network Performance Monitor: These are additional purchases
Datadog Infrastructure Monitoring offers complete coverage for all infrastructure, both physical and virtual, no matter where it is located or hosted. The package watches over all services from the server resources up to the applications that support user-facing software. You can see dependencies between modules and include detailed performance metrics that are generated by third-party software, thanks to the library of integrations included in the Datadog platform.
As a SaaS provider, Datadog charges for its software on a subscription and includes the virtual server to run it. All modules of Datadog are available with a 14-day free trial.
8. Nagios XI
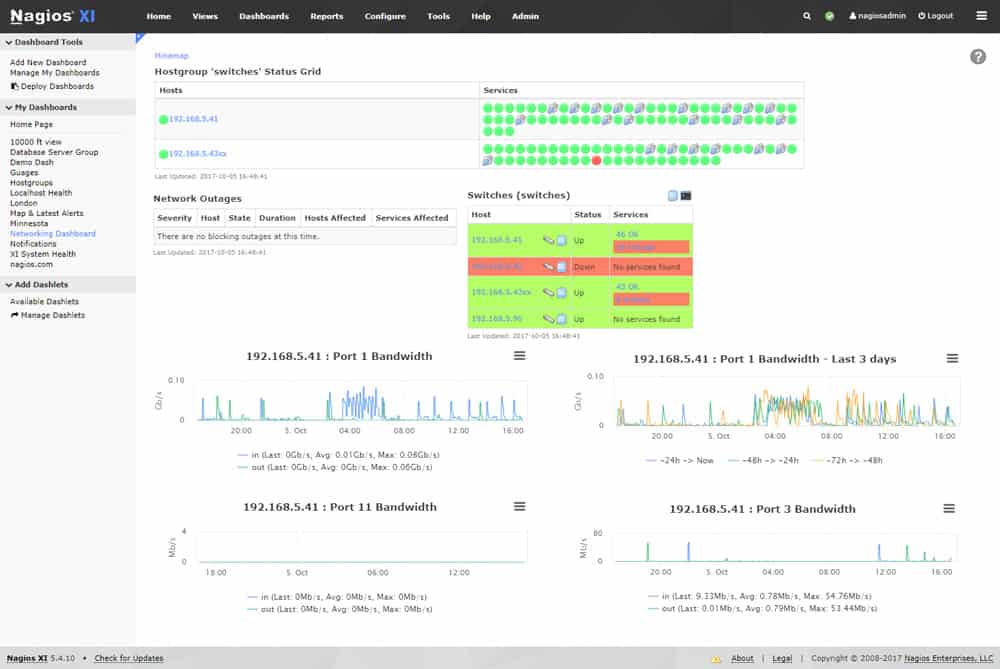
Nagios XI is a network monitoring solution for CentOS, RedHat Enterprise Linux, Ubuntu, and Debian. It has a web-based user interface. To speed up the setup process Nagios XI has configuration wizards that show you how to monitor different segments of your network. The dashboard is customizable and you can use a variety of dials, graphs, and charts to visualize your network’s performance.
Key Features:
- Full Stack Monitoring: Networks, servers, and applications
- Virtual System Monitoring: Containers, virtualizations, and virtual servers
- Hybrid System Tracking: Monitors cloud and on-premises
Why do we recommend it?
Nagios XI is an on-premises monitoring package that provides performance tracking for network devices, servers, services, and applications. Network traffic monitoring is available in a separate package. The outstanding feature of this service is the Nagios Exchange, which is a community library of free extensions.
The extendable architecture of Nagios XI is one of the reasons why it is so widely-used. The platforms APIs can be used to integrate third-party applications to enhance the core functionality of the program. The Nagios exchange site has a range of APIs that you can use to add new features. For instance, you can add the Webmetrics api plugin for Nagios to view even more performance metrics.
Who is it recommended for?
This tool provides all of the equipment monitoring services that you need for your business system. There is a free version, called Nagios Core, which would interest small businesses. This software package can also monitor cloud systems. It installs on Linux or over a hypervisor to get it on Windows.
Pros:
- On-Premises Package: Runs on Linux or macOS – for Windows, run it over a VM
- Alerts for System Problems: Can be forwarded as notifications by SMS or email
- Can be Extended by Plug-In: Get extensions for free at the Nagios Exchange
Cons:
- No Network Traffic Monitoring: Split out into a separate paid package
There are two versions of Nagios XI to purchase: the Standard Edition and the Enterprise Edition. The Standard Edition starts at $1,995 (£1,537) and comes with configuration wizards, reporting, and custom user dashboards.
The Enterprise Edition starts at $3,495 (£2,694) and comes with extra features like capacity planning reports and audit logging. There is also a 60-day free trial version.
9. SolarWinds Network Performance Monitor
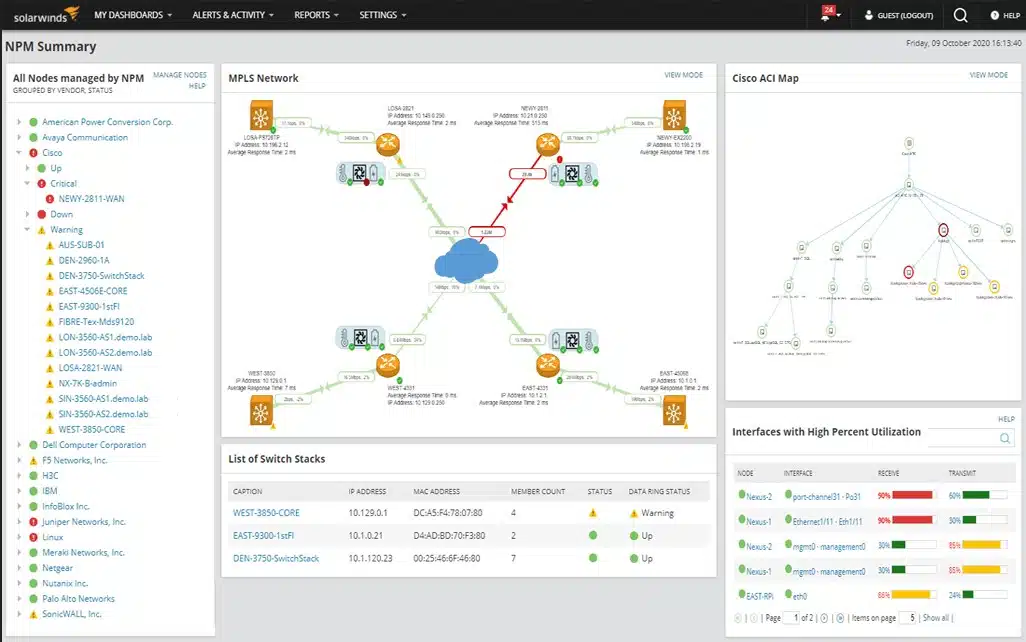
SolarWinds Network Performance Monitor is the number one infrastructure monitoring tool on this list. With this tool, you can automatically discover devices and monitor their health status through the dashboard. Here you can see an overview of all the connected devices being managed.
Key Features:
- Device Discovery: Identifies switches, routers, hardware firewalls, and endpoints
- Creates an Asset Inventory: The inventory is kept constantly up to date
- Network Topology Mapping: Based on the data in the asset inventory
Why do we recommend it?
SolarWinds Network Performance Monitor is a system for monitoring the physical infrastructure of your networks and connections to cloud services. There are also some logical infrastructure elements that are covered by this tool, such as VPN operations and software-defined network systems. This package can also monitor wireless systems.
All of the performance information is shown in lists and pie charts so that you can tell from a glimpse if a device is experiencing issues that impact performance. However, if you’re on a more complex network then you have the option to view an intelligent map of the entire network topology.
Here you will be able to see the geographical location of different devices throughout your network and how they connect to each other. This view is also color-coded with down devices marked with red. These maps are automatically updated to keep up with topology changes in your network.
Like all top-of-the-range infrastructure monitoring tools, SolarWinds Network Performance Monitor has an alerts system. To monitor the network, users simply create intelligent alerts with trigger conditions to determine the type of alerts they see. For instance, you can configure the program to only send you critical alerts. There is also an All Active Alerts page where you can view a full list of active alerts with names that provide details such as High response time, or High packet loss.
Who is it recommended for?
This is a substantial package that is able to monitor many network devices simultaneously. Therefore, its capacity is best suited to large networks. The monitoring system is delivered as a software package for installation on Windows Server.
Pros:
- Designed with Large and Enterprise Networks in Mind: Complex systems benefit most from the automated network documentation services
- System Documentation is Always up to Date: You are never working with inaccurate data
- Customizable Alerts: Set up your own alert thresholds and conditions
Cons:
- Runs on Windows Server: Not available for Linux or macOS
SolarWinds Network Performance Monitor starts at a price of $2,995 (£2,287). There is also a 30-day free trial available.
10. N-able N-sight

N-able N-sight is a cloud-based remote monitoring and management software package that monitors all types of IT infrastructure.
Key Features:
- Designed for Managed Service Providers: Has a multi-tenant architecture
- SNMP-Based Device Discovery: Creates a hardware inventory
- Device Agents for Software Management: Software inventory, license management, and patching
Why do we recommend it?
N-able N-sight is a cloud-based package of remote monitoring and management tools. The system is designed to provide automated monitoring for networks, servers, and applications. Each metric that the system measures has a performance threshold placed on it. If that level is crossed, the RMM raises an alert.
The system monitors networks, servers, endpoints, mobile devices, and applications. It is also able to cover cloud resources. As well as monitoring systems, the service includes security software, task automation, and performance analysis features.
Network monitoring is driven by the Simple Network Management Protocol (SNMP), while monitored endpoints and servers require agent modules to be installed on them. The tool has a system dashboard that is resident in the cloud and can be accessed from anywhere through a standard web browser or a special mobile app.
Network device statuses and server performance metrics are shown live in the dashboard and any detected problems provoke alerts. The alerts can be forwarded to key staff via email or SMS message. All of this automated monitoring frees up staff for other tasks while drawing everyone’s attention when glitches arise.
Who is it recommended for?
N-able markets N-sight for use by large managed service providers. The package has a multi-tenant architecture that lets subscribers set up a separate sub-account for each client. The package also includes a ticketing system for a Help Desk. IT departments and growing MSPs should look at N-able N-central.
Pros:
- Monitor from Anywhere via a Web Browser: Coverage for multiple sites and remote endpoints
- Remote Administration Tools: Task automation, remote access, and troubleshooting systems
- Subscription Model Pricing: A rate per technician
Cons:
- In-House IT Teams Should Look at N-able N-central: This tool isn’t suitable for them
N-able N-sight is a subscription service with no setup fees. This charging structure is particularly appealing to startups because it means comprehensive monitoring can begin instantly without the need to buy in servers, special equipment, or expensive software. N-able offers a 30-day free trial of its N-sight system.
11. Zabbix
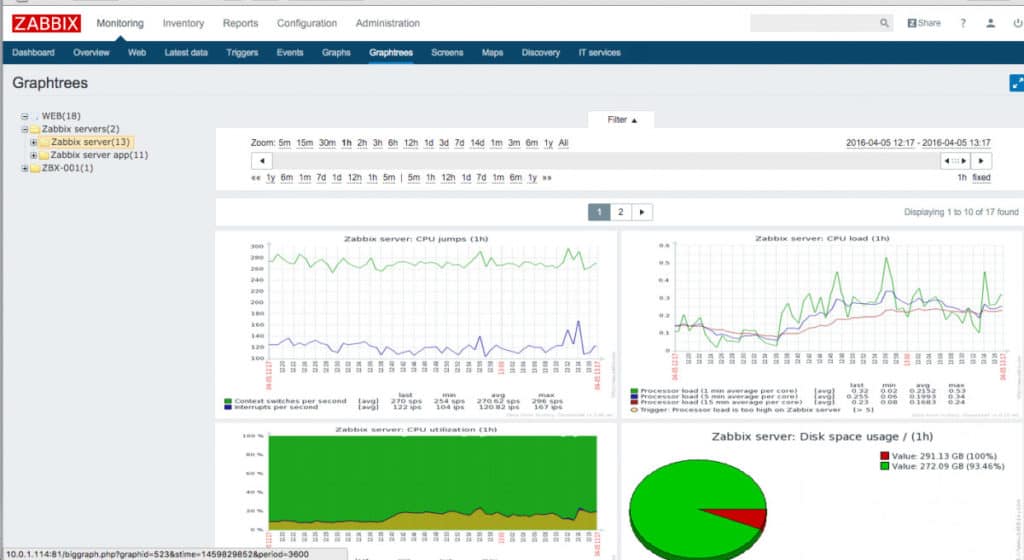
Zabbix is an open-source network monitoring tool. With Zabbix you can conduct network monitoring, server monitoring, cloud monitoring, application monitoring, and services monitoring.
Key Features:
- Free to Use: A professional monitoring package that costs nothing
- Monitors All Levels of the System Stack: Network, servers, services, and applications
- System Discovery: Creates an IT asset inventory and network map
Why do we recommend it?
Zabbix is a free tool that is similar to Nagios. This package is free to use and it has a sophisticated interface and performance alerts, which make monitoring an IT system easy. The package can be extended by templates and there are many available free of charge.
Setting up Zabbix doesn’t take too much work either. You can install the program in a matter of minutes and start monitoring with out-of-the-box templates. As you become more confident with the program you can build your own custom templates.
Autodiscovery allows you to periodically discover network devices. This is preferable to manual configurations as it keeps the monitor up-to-date. All you need to do is enter network discovery rules.
When entering network discovery rules you simply enter an IP range and which services to look out for. Once a device is discovered you can then configure notifications, remote scripts, and whether to add or remove a host.
The integration offered by Zabbix is one of its greatest strengths. You can use the API to automate manual event responses and add new monitoring rules that can’t be done with the prepackaged program. There are also additional Zabbix plugins and modules that you can deploy to enhance the basic functions of the product.
Who is it recommended for?
Being free, Zabbix is very appealing to small businesses and cash-strapped startups. However, the tool is also used by some very large corporations. Professional support package subscriptions are available for businesses that need one to comply with their professional insurance requirements. The software runs on Linux, cloud platforms, and containers.
Pros:
- Network Troubleshooting Tools: Check on connection issues
- Alerts for Resource Shortages or Performance Errors: Can be forwarded as notifications by SMS, email, custom script, and webhook
- On-Premises Package: Runs on Linux, Docker, VMs, or Cloud Platforms: Not available for Windows or macOS
Cons:
- No Professional Support: You can pay for a support package
Zabbix is a tool that should be considered by those organizations looking for an open source infrastructure monitoring tool. Zabbix is available to download on CentOS, Oracle Linux, Ubuntu, Debian, SUSE Linux Enterprise Server, and Raspbian. You can download Zabbix for free.
Related post: Nagios vs Zabbix
12. Icinga 2
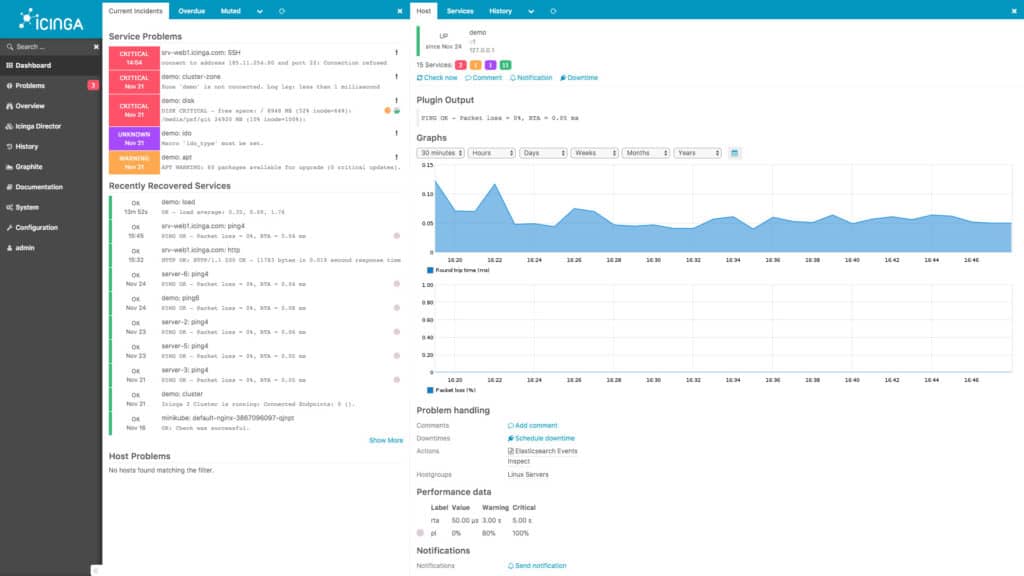
Icinga 2 is a web-based network monitoring tool with a customizable user interface. You can create custom views to view different events throughout your physical and virtual infrastructure. In fact, the capabilities of Icinga 2 can monitor entire data centers and cloud services. It is, therefore, an excellent tool for those companies operating within hybrid network environments.
Key Features:
- Free Tool: A fork of Nagios Core
- Extensible: Takes Nagios plug-ins
- Full Stack Monitoring: Monitors all stack levels, including networks, servers, and applications
Why do we recommend it?
Icinga 2 is a fork of Nagios. It is an extensive and competent package with a presentable user interface like Nagios XI but free to use like Nagios Core. All of the plug-ins for Nagios will work in Icinga 2. This tool will monitor virtual infrastructure and cloud platforms as well as physical systems.
For configuration, Icinga 2 has its own configuration language. The engine can be complex but it gives you complete control over how you monitor your infrastructure. For instance, you create monitoring objects and use the rule-based engine to dictate just how a network element is monitored. However, there is also a web-based configuration interface if you wish to lay out your configurations in a way that is less difficult.
Icinga 2 modules are Icinga 2’s answer to plugins and add-ons. These modules allow you to enhance the basic functionality of Icinga and monitor new facets of your network. For example, there is an Icinga Module for vSphere which integrates your VMware environment into Icinga.
Likewise, there is an Icinga Module for Graphite that shows you metrics directly in the user interface. These integrations help to extend and enhance the functionality of what is already a very diverse product.
Who is it recommended for?
The target market for Icinga 2 is the same as for Zabbix: everyone uses it for free but larger companies can choose to pay for a support package. Like Nagios, Icinga 2 lacks a network traffic analysis module. This software installs on Linux, Windows, and AWS.
Pros:
- System Discovery: Creates hardware inventory and network topology map
- Alerts for System Problems: Forward them as notifications by SMS or email
- On-Premises Package: Runs on Windows and Linux systems
Cons:
- Doesn’t Have Software Management Services: No software inventory
Overall Icinga 2 is a tool that suits those network administrators who are comfortable adopting the configuration language and building their own monitoring environment from scratch. Icinga 2 is available for Debian, RHEL, SLES, Windows, Ubuntu, Fedora, and OpenSUSE. You can download the tool for free.
Choosing an infrastructure monitoring tool
Though there are many high-performance infrastructure monitoring tools on this list a few stand out on account of their accessibility. eG Enterprise IT Infrastructure Monitoring, Site24x7 and ManageEngine OpManager Plus are solid choices for organizations of all sizes.
On the other hand, PRTG Network Monitor is an excellent starting tool because of the free version. The user can build up competency with the sensors-based monitoring approach without paying the cost of a full license. The variety of features offered in terms of physical and virtual monitoring is enough to rival any other tool on the market.
Depending on your needs, every tool on this list has something to offer. Whether you’re looking for the sculptability of an open-source tool or the simplicity of a proprietary tool, there are plenty of options available to you.
IT Infrastructure Monitoring FAQs
Why is infrastructure monitoring important?
Infrastructure monitoring ensures that all of the services that deliver software, applications, and data to your system users are functioning properly. IT systems have so many potential points of failure. If just one process or one network node runs into problems, your entire system could stop working properly. Watching out for evolving problems enables you to head off disaster.
How to choose the best monitoring solution for your infrastructure
The first issue you need to look at when choosing a monitoring solution is what operating system the package runs on. Considering only those monitors that will run on the computers that you have got cuts down the list of candidates. The next consideration is whether a monitor is able to reach out over the network to all of your equipment. Again, the operating systems that you are running is a key factor to look out for.
What kind of problems can be detected with infrastructure monitoring?
The key problems that infrastructure monitoring focuses on relate to resource availability and usage. If a process is waiting for a resource to be available, it will hang, stop working, or lose data. For example, the main reason software slows down or fails is because there is no space left in the CPU to launch a process. Being aware of a resource approaching its limits gives you time to take action and avoid disaster.<
Recommended reading:

