

IT industry commentators credit New Relic for inventing the Application Performance Monitor (APM). Now this category of software represents a market with many providers. In March 2020, New Relic announced a radical shake-up to its SaaS system, declaring that the age of the APM is at an end.
Here is our list of the best alternatives to New Relic:
- Atera EDITOR’S CHOICE This cloud platform offers IT and network monitoring, automated alerts, and performance analytics plus endpoint management in a user-friendly, all-in-one platform tailored for small to medium-sized businesses. Access a 30-day free trial.
- ManageEngine Applications Manager (FREE TRIAL) A server and application monitor that includes full-stack root cause analysis. It runs on Windows Server and Linux. Start a 30-day free trial.
- Site24x7 Application Performance Monitoring (FREE TRIAL) A cloud-based monitoring system that covers server statuses as well as application performance. Start a 30-day free trial.
- Hosted PRTG A package of network, server, and application monitors that can be delivered as a SaaS system.
- Datadog A SaaS monitoring system that tracks the performance of applications whether they are resident on-premises or on the cloud.
- SolarWinds Server & Application Monitor An application monitor that also watches the statuses of underlying server resources.
- Sematext Application Performance Monitoring This is a cloud-based monitoring service that is centered on log management.
- AppDynamics A cloud-based APM from Cisco Systems with a range of service levels.
New Relic insiders now talk about “observability.” In an announcement at the end of July 2020, Chief Product Officer Bill Staples declared, “As the company who created APM, we’re going to be the ones to end it.” He continued, “We’re declaring that all of our existing products and pricing are now deprecated. They’re gone. We’re introducing radical simplicity to the observability space.”
While radical change is exciting for those who drive it, it can be confusing and frustrating for customers who are dragged along through the change involuntarily. New Relic is responding to the rivals who crowded into the APM market, eroding its unique selling point.
A complete overhaul of the service seems to be a drastic step and it is a make-or-break move by the SaaS provider that creates a period of doubt and fluidity that could lose many customers.
If you’re uncomfortable about the innovations at New Relic, maybe it’s time to take a look at alternatives to this system.
Alternatives to New Relic APM
There are plenty of options for those looking for an application performance monitor. Although other providers produced their APMs later than New Relic, many of those competitors actually did a better job.
One of the main objectives of the New Relic change strategy is to move away from providing an APM as a standalone module. Instead, they have integrated the APM functions into a wider stack monitoring system. In doing this, the company is actually moving into a market arena that is already well-provided.
So, you might be looking for a New Relic replacement that focuses on applications or you might be looking ahead of New Relic to see what other companies are already doing what New Relic aims to provide.
The Best New Relic Alternatives
In this review, we will look at APM services that can be operated as standalone monitors and also integrated infrastructure monitors that have more experience in full-stack monitoring than New Relic.
Our methodology for selecting New Relic alternatives
We reviewed the market for application performance monitors that compete with New Relic’s original operating model and assessed the options based on the following criteria:
- Autodiscovery of applications
- Application dependency mapping
- Correlation between application activity and server activity
- Identification of the root cause of performance problems
- Capacity analysis to plan for better resource availability
- A free trial or a demo version that allows a pre-purchase assessment
- Value for money from an APM that can head off service delivery problems and right-size infrastructure
1. Atera (FREE TRIAL)

Atera is a support system for Managed Service Providers (MSPs). It is included on this list of alternatives for New Relic because New Relic also pitches for MSP business through its partner program.
Key Features:
- Option for MSPs: Four plans for IT departments and four for MSPs
- Remote Monitoring and Management: A complete RMM package
- Full Stack Monitoring: Networks, servers, and applications
- Centralized Management: A unified platform to monitor and manage entire networks from one interface.
- Performance Analytics: In-depth analysis of network trends to optimize performance and planning.
Why do we recommend it?
Atera is a remote monitoring and management platform that include automated monitoring systems for networks, servers, and applications. However, it doesn’t provide advanced monitoring services for Web applications. The RMM package also includes a ticketing system and automated maintenance scripts. You also get remote access tools with this package.
The advantages to MSPs of using Atera instead of New Relic are that this system includes all software requirements including a ticketing system and the Professional Services Automation (PSA) software that MSPs need to run their businesses.
The technician tools in Atera are called Remote Monitoring and Management systems (RMM). They include full-stack monitoring and application performance tracking. The Atera monitoring system covers applications such as databases, virtualizations, productivity suites, Active Directory, and customized applications and services through log scanning.
Who is it recommended for?
The Atera package is offered in two versions that are tailored for managed service providers and IT departments. The service’s subscription plans are priced per technician, which makes it scaleable and suitable for businesses of any size. Growing businesses would particularly appreciate the plan flexibility of Atera.
Pros:
- Includes a Help Desk Ticketing System in All Plans: MSP plans include a full PSA package
- Automated Monitoring: Alerts are raised for performance problems
- System Management Automation: Patching and a scheduler to launch maintenance scripts
- Remote Troubleshooting: Enables IT professionals to diagnose and resolve issues remotely, reducing downtime.
- Integration Capabilities: Integrates with other IT management tools for streamlined operations.
Cons:
- No Web Application Monitoring Features: No distributed tracing or code profiling
Atera is a cloud-based service and is charged for by subscription. Charges are levied per technician per month, so it is a great option for independent support technicians, start-ups, and growing MSPs. The system is available on a 30-day free trial.
EDITOR'S CHOICE
Atera is our top pick for a New Relic alternative because this cloud-hosted platform delivers a cost-effective, all-in-one IT management solution. The package is tailored to the needs of small and medium-sized businesses, without compromising on functionality. While New Relic excels in application performance monitoring, Atera provides a broader scope, combining network monitoring, remote troubleshooting, and IT automation into a single, user-friendly platform. This makes it an ideal choice for businesses seeking a comprehensive tool to manage their entire IT infrastructure efficiently. Atera’s real-time monitoring and automated alert systems ensure that network and device performance issues are detected and addressed promptly, minimizing downtime and maintaining productivity. Its customizable dashboards allow users to focus on the metrics that matter most, providing a clear and actionable overview of their IT environment. Atera’s remote troubleshooting capabilities enable IT teams to resolve issues from anywhere, a critical feature in today’s remote work landscape. Unlike New Relic, which can be complex and costly, Atera offers a straightforward pricing model and intuitive interface, making it accessible for businesses with limited IT resources. Its integration capabilities with other tools further enhance its versatility, streamlining workflows and improving efficiency.
Download: Start a 30-day FREE Trial
Official Site: https://www.atera.com/signup/
OS: Cloud-based
2. ManageEngine Applications Manager (FREE TRIAL)
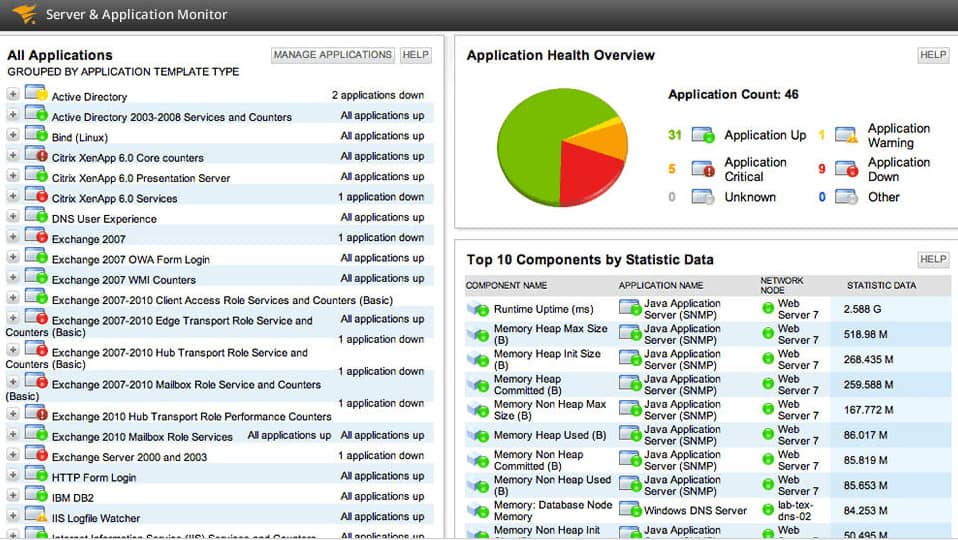
ManageEngine Applications Manager shadows the products of SolarWinds very successfully and it is a close competitor, providing a good alternative to New Relic. This tool is a standalone monitor and it can also be combined with other ManageEngine infrastructure monitoring systems to create full-stack monitoring.
Key Features:
- Recognition Library: Identifies 50,000 commercial software packages
- Autodiscovery Cycle: Repeats continuously
- Application Dependency Mapping: Identifies relationships between software and services
- Server Resource Monitoring: Watch out for shortages
Why do we recommend it?
ManageEngine Applications Manager is the main rival for the SolarWinds application monitoring service. This tool provides server process tracking, which leads to application discovery and the dependency and service mapping. This package includes distributed tracing for Web applications and it can also reach out to cloud platforms to extract activity statistics.
The monitoring tool includes server monitoring as well as application management. This enables it to quickly identify the underlying cause of application delivery issues – whether they be software-related or a physical resource problem.
The Applications Manager is shipped with the capability of monitoring more than 50,000 named applications. Its system covers databases, ERP suites, Web applications, and virtualizations. It is also able to manage the execution of custom scripts and applications.
The system sets performance thresholds on each application and alerts technicians when one of those lines is crossed. Thresholds and alert mechanisms can be generated and adjusted manually as well.
Who is it recommended for?
ManageEngine provides a free edition for small businesses that will monitor up to five hosts. That is a good size and should be enough to manage simple systems. All editions are available for installation on Windows server or Linux and you can get them as a service on AWS Marketplace and Azure Marketplace.
Pros:
- Deployment Options: Install on premises on Linux or Windows Server or run it on your AWS or Azure account
- Distributed Tracing: Scans microservices
- Code Profiling: Traces through Web application code
- Synthetic and Real User Monitoring: Track the performance of websites
Cons:
- No SaaS Option: The cloud installation service isn’t a SaaS package
There are also performance monitors in the Applications Manager for server statuses, such as CPU, disk utilization, network I/O, and memory usage. One install of the Applications Manager is able to monitor many servers. The software installs on either Windows Server or Linux and it can also monitor other servers with those operating systems. You can get a 30-day free trial of the ManageEngine Application Manager.
3. Site24x7 Application Performance Monitoring (FREE TRIAL)

Like ApOptics, Site24x7 is a SaaS service with an infrastructure monitoring plan and an application performance monitoring option that also includes infrastructure monitoring services.
Key Features:
- Full Stack Observability: Packaged with network and server monitors
- Web Performance Testing: Real user and synthetic monitoring
- Application Dependency Mapping: Root cause analysis
Why do we recommend it?
Site24x7 Application Performance Monitoring is a cloud-based system that is sold in a plan together with server and network monitoring services. The APM provides extensive service for monitoring Web applications and microservices and the plan also includes real user monitoring and synthetic monitoring service for checking on websites.
The Application Performance Monitor includes infrastructure discovery, software logging, services tracking, and server hardware monitoring. The system is able to monitor a long list of applications that include databases, virtualization systems, Web applications, and ERPs. Facilities in the service include a root cause analysis service and alerting for performance issues.
Alerts can become the basis for automated workflows that take action to improve performance. In more complex cases, the system administrator would need to use the root cause analysis module in order to work out where the cause of the problem lies.
Although the system is cloud-based, the Site24x7 Application Performance Monitor requires agent programs to be installed on each monitored server. These are available for Windows, Windows Server, Debian, Ubuntu, CentOS, Red Hat, Fedora, Suse, Gentoo, CoreOS, and Amazon Linux, FreeBSD, and macOS.
Who is it recommended for?
The Site24x7 includes all of its modules in most of its plans, except for the Web application monitoring services. These facilities are only included in the APM plan and the All-in-One package. There is a version of that full package that is structured for managed service providers.
Pros:
- Code Profiling: For web applications
- Distributed Tracing: For microservices
- DevOps Tool: Test during development, release testing, and monitoring during operations
Cons:
- Not a Standalone Service: You can’t buy just the APM, you have to subscribe to a plan for the entire platform
The APM has a base package that will monitor three applications on up to 40 servers with a price per month. Most businesses need to monitor much more than just three applications and so there are addon services that bump that number up. You can try out the Site24x7 Application Performance Monitoring system on a 30-day free trial.
4. Hosted PRTG

Paessler PRTG is a set of monitors for network, servers, and applications. The hosted version of the system includes the server resources to run the monitoring software and cloud storage space in which to save historical data for analysis.
Key Features:
- Cloud-Based: A SaaS package
- Flexible Self-Assembly Package: Choose which monitors to activate
- Application and Server Performance Correlation: Also connects through to network performance monitoring
Why do we recommend it?
Hosted PRTG is the SaaS version of Paessler PRTG Network Monitor, which runs on Windows Server. This cloud option offers identical services to the on-premises software package of PRTG. you can customize this plan by deciding which sensors to turn on. You can assemble a full stack monitoring service with this package.
The PRTG system is very flexible. Each monitor is called a sensor and the price for the service depends on how many sensors the customer wants to turn on. It is possible to limit the service to just application monitoring by only activating application-related sensors. However, it is also possible to get a full stack monitor by activating server and network sensors as well.
The application monitor logs all active applications and begins to trace their activities. Well-known applications have specific monitors written for them – there are thousands of sensors in PRTG.
PRTG can monitor applications no matter where they are hosted – including on the cloud. The screens for the service show some great performance data visualizations, including the sunburst chart, which shows all the supporting services beneath each application, each with color-coded statuses. This is a really quick way to spot the reason that an application is running slowly.
Who is it recommended for?
This package is able to reach out to sites from its cloud location and it can also monitor other cloud platforms. The system is very good at monitoring on-premises service and not so hot at tracking the activities of Web applications. However, it does include Ping-based tests for Web asset availability.
Pros:
- Hosted on AWS: 26 data center locations
- Account Mirroring: Guarantees data preservation
- Cloud Storage Space Included: For metrics and logs
Cons:
- No Free Edition: The on-premises has a Free edition that provides up to 100 sensors
Hosted PRTG is charged for by subscription with prices levied per month based on bands of sensor quantities. Paessler offers a 10-day free trial of Hosted PRTG with a 500 sensor allowance.
5. Datadog APM
Datadog is a cloud-based monitoring service with a range of options, including application performance monitoring.
Key Features:
- Designed to Monitor Cloud-Hosted Web Applications: See the Infrastructure Monitoring module for on-premises application monitoring
- Distributed Tracing: Identify activity in microservices
- Code Profiling: A continuous profiler
Why do we recommend it?
Datadog APM is a relatively new service on the Datadog platform. Originally, you would have subscribed to the Infrastructure plan to track applications and you still get monitoring for traditional applications, such as databases and Web servers with that plan. However, the newer application structures, such as Web applications, are tracked by the APM.
The system provides several different perspectives on application performance monitoring. It gives a full-stack observability view of application delivery, which is very similar to New Relic’s new approach to monitoring. This follows a single user journey through a website or use of an application and the list of all the contributing services and infrastructure that delivers it. This service also looks through system logs to identify the causes of encountered problems.
Datadog draws up a system dependency map, which shows all of the dependencies between applications and their underlying services. This offers another view of application performance and supports root cause analysis when problems arise. The maps show live data flows between points of interest in the application support stack.
An App Analytics module provides another perspective on application performance. This shows metrics over time and compares those graphs to the performance data for the server and the network, giving an insight into the origin of application performance issues.
Datadog applies performance thresholds on a range of application metrics and raises alerts when one of those limits is crossed. Threshold levels are not arbitrary and adjust over time through an AI-based machine learning process.
Alerts can be the triggers for automated remedial actions to fix problems without manual intervention.
Who is it recommended for?
This APM tool focuses on monitoring Web applications. For standard applications, such as databases or mail servers, you would opt for the Datadog Infrastructure Monitoring package. The APM is available in three plans, with the lower edition aimed at businesses that want to monitor the applications to which they subscribe and the top plan designed for DevOps teams.
Pros:
- Cloud-Based SaaS Product: No need to host or maintain the code
- Universal Service Monitoring: Application dependency mapping
- Faulty Queue Detection: Pipeline performance monitoring
Cons:
- Code Profiling is Only Available in the Top Plan: Can get expensive
The Datadog APM is charged for by subscription with a rate set per host per month or per year. There are no set up fees and no service lock-in periods. You can test the system on a 14-day free trial.
6. SolarWinds Server & Application Monitor
The SolarWinds Server & Application Monitor (SAM) is the leading application monitoring system available in the market. The software is available for installation on-premises, which is an alternative configuration to the cloud-based delivery of New Relic.
Key Features:
- Templates for Interfacing to Specific Applications: Provides detailed scrutiny
- Server and Application Discovery: A continuous process
- Application Dependency Mapping: Identifies links between different software packages and also stacks of underlying services
- Stack Performance Correlation: View metrics for supporting layers in the same screen
- Root Cause Analysis: Quickly identifies the component at fault
Why do we recommend it?
SolarWinds Server & Application Monitor is a big package but it is still a lot simpler than the multi-module New Relic platform. This service doesn’t include distributed tracing – you need AppOptics for that – however, it does match many features of New Relic, including application discovery and dependency mapping.
The software has more than 2,200 templates available. These set the thresholds of key metrics that need to be monitored in order to successfully manage a specific application. Each template brings with it a specialist screen, so administrators know exactly where to look for information on a particular application’s performance.
Applications that the SAM covers include databases, web servers, virtualization systems, and cloud services. In addition, the service watches over the performance of PowerShell scripts, SNMP functions, REST APIs, and WMI activities. The list of monitorable applications extends to Active Directory and Office 365.
The performance of applications is highly dependent on the underlying services and the resources of the host machine. The SAM includes server monitoring because there is no point in trying to pinpoint a problem with application performance without being sure that the issue isn’t being caused by overloaded hardware.
SolarWinds SAM includes an Application Dependency Mapping tool. This shows the underlying services that aid the delivery of an application, extending to network connections. SolarWinds has created its key monitoring tools on a common platform, called Orion. This enables cross-modular functions and one of those is called PerfStack. This is available to those who combine the SAM with the SolarWinds Network Performance Monitor. This shows the full stack dependency of each application with color-coded statuses for each layer. This is exactly the type of information that New Relic is hoping to provide with its new format.
Who is it recommended for?
This system is a good choice for traditional businesses that run applications on their own servers and want to monitor all of the delivery infrastructure as well as software packages. The service can also monitor applications running on cloud platforms. It isn’t such a great choice for businesses that run Web applications.
Pros:
- Designed with Large and Enterprise Networks in Mind: Smaller networks might not get value for money
- Grouped Alerts: Recognizes that many identified problems will be down to one fault
- Combined Full Stack Inter-Modular Analysis: Combine the package with the Network Performance Monitor to extend stack views down to the network
- Customize the Look and Feel of the Dashboard: Use drag-and-drop widgets
- Monitors Active Directory: Tracks changes and assesses performance
Cons:
- No Option for Linux: This software package is only available for Windows Server
The SolarWinds Server & Application Monitor installs on Windows Server, but it is also able to monitor other servers, including those running Linux. You can get a 30-day free trial of the SolarWinds SAM.
7. Sematext Application Performance Monitoring

Sematext Application Performance Monitoring offers a range of techniques for monitoring applications. This is a cloud platform and its capabilities are not limited to monitoring applications running on one site. This is great for tracking distributed systems that are provided by contributions from several servers in different locations.
Key Features:
- Operates Through Log Scanning: Acts like a SIEM
- Implements the Elastic Stack: This is a hosted ELK service
- Website Performance Analysis: Real user and synthetic monitoring
Why do we recommend it?
The Sematext Application Performance Monitoring service is part of a cloud package that is like New Relic. The entire platform is called Sematxt Infrastructure Monitoring and it is currently undergoing expansion with the creation of a Tracing module, which is not yet available. The Tracing package will provide distributed tracing.
If you integrate APIs and other external widgets and services in your Web pages, you can use the distributed transaction tracing service of Sematext. This looks at each process that gets run on your server and then as all of the calls that it makes to other packages, no matter where they are run. This builds up an application dependency map, which you can use for performance investigations.
The APM sections of the Sematext platform are provided by a number of modules. You can choose to examine the performance of a website through real user monitoring, which gathers statistics on the performance of live sites. If you are developing new services or pages for a website, you can use synthetic monitoring to run through access actions for each element on a page. These synthetic monitors also include availability and load speed statistics.
Who is it recommended for?
The Sematext Infrastructure Monitoring platform is available in three plans that appeal to different business sizes. The Basic plan is free to use and will monitor up to five hosts and the systems that run on them. The two paid plans are priced per host and have variable data retention periods.
Pros:
- Distributed Tracing: Telemetry for microservices
- Code Profiling: For Java and Scala
- Database Tracking: Identifies slow SQL
Cons:
- Split Across Several Modules: The full package of application monitoring requires multiple subscriptions
The Sematext system is a metered service and you pay a different rate for each of the modules that you decide to use in order to monitor your applications. The Sematext platform also offers log management. For Infrastructure Monitoring and Log Management, which both include APM functions, there is a Basic plan that is free to monitor three servers.
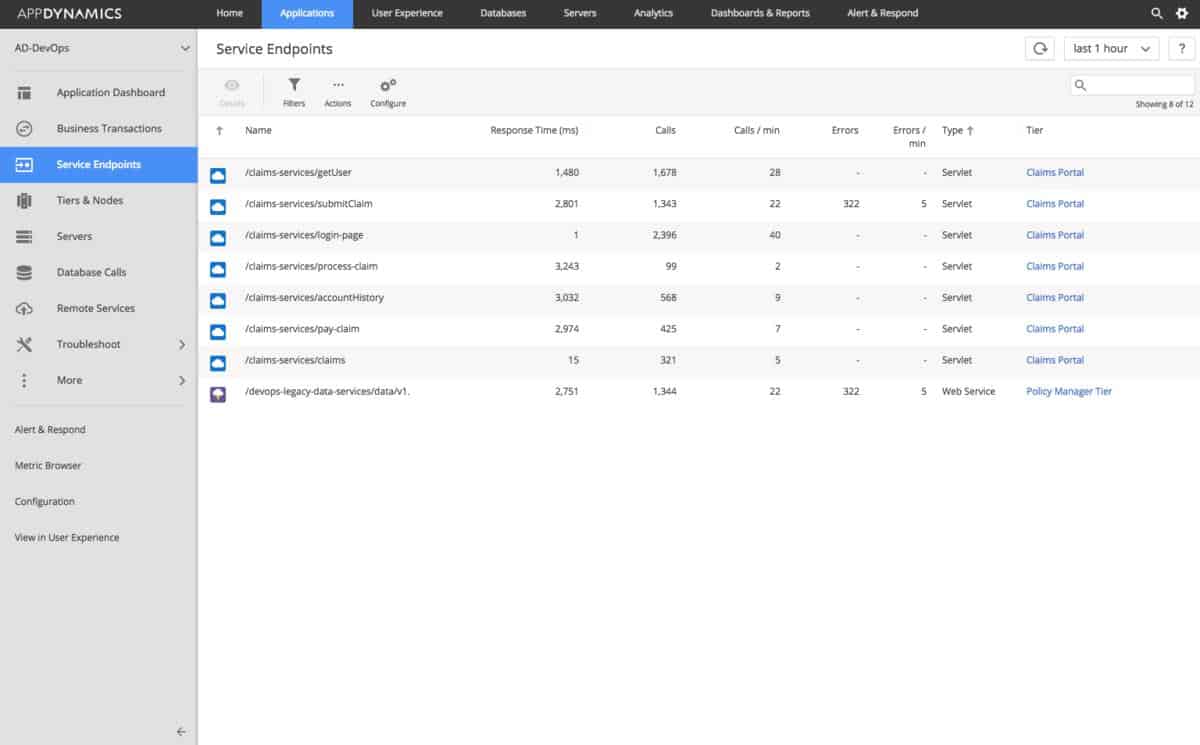
8. AppDynamics
AppDynamics is owned by Cisco Systems. This is a cloud-based service but customers can request the software for on-premises installation instead.
Key Features:
- Application Stack Map: Identifies dependencies
- Traces Business Processes: Examines the flow of data for delivery
- Special Edition for SAP: Examines the performance of a SAP implementation
Why do we recommend it?
AppDynamics is a cloud-based application monitoring service that also offers an Infrastructure Monitoring plan and a Real User Monitoring service. The APM uses AI to track Web applications through to the services that support them and it creates an application dependency map. It then calculates predictions on resource availability.
The dashboard offers two perspectives on application performance. The first of these looks at the resources of the system and delivers performance statistics for each application with a drill-down facility to look at the statuses of its supporting infrastructure. One of the features of this module is an application stack map. However, these supporting services don’t include actual physical resources in the lower plans of AppDynamics.
The second monitoring method identifies use cases for each application and generates a typical user experience, identifying applications that are failing to keep up to a suitable performance level.
The AppDynamics system sets performance thresholds, which are arrived at and constantly adjusted by machine learning. Performance is shown live in the dashboard and metrics are stored for time-based historical analysis.
Who is it recommended for?
If you run complicated Web applications, you will need the advanced features of the AppDynamics APM plans. These are able to identify exactly which function is in trouble when things go wrong and, in fact, it can predict those problems and alert technicians to take action to head them off.
Pros:
- Scalable Pricing: Base packages are priced per core
- Expandable Service: Add on specialist modules for website monitoring
- Transaction Analysis: Spots the cause of slow delivery or errors
Cons:
- The Free Edition is No Longer Available: AppDynamics has repackaged its plan structure
AppDynamics offers an Infrastructure Monitoring plan and three APM plans: Premium Edition, Enterprise Edition, and Enterprise Edition for SAP Solutions. These editions all include the services of the Infrastructure Monitoring module. There is a Real User Monitoring plan available and a security monitoring package, called Cisco Secure Application.
All of those plans are priced per CPU core. There is also an alternative pricing structure for the APM, called the Cisco Observability Platform, which lets you choose modules and pay per unit. You can try out the whole platform with a 30-day free trial.

