

The SolarWinds NetFlow Traffic Analyzer is a powerful tool designed to provide network administrators with detailed insights into network traffic and performance. As networks grow in complexity and traffic volumes increase, understanding the flow of data within a network becomes critical for maintaining performance, ensuring security, and optimizing resources.
This package leverages advanced analytics to offer a comprehensive view of network traffic, allowing organizations to monitor bandwidth usage, identify bottlenecks, and detect potential security threats.
NetFlow technology, developed by Cisco, collects data about network traffic, including source and destination IP addresses, port numbers, and packet types. This data is invaluable for troubleshooting network issues, managing bandwidth, and maintaining network security. SolarWinds enhances this with a well-planned interface and extensive reporting features, making it easier for network administrators to analyze and interpret traffic patterns.
Real-time monitoring, historical data analysis, and customizable reports make the NetFlow Traffic Analyzer a leading network monitoring and management system. One of the key benefits of the tool is its ability to identify unusual patterns in network traffic. By monitoring traffic flows in real-time, the tool can quickly detect anomalies such as spikes in bandwidth usage or unauthorized access attempts, which could indicate security issues.
This system provides detailed reports that can help administrators understand long-term traffic trends, allowing them to make informed decisions about capacity planning and resource allocation.
What is SolarWinds NetFlow Traffic Analyzer?
SolarWinds NTA is not a standalone tool, but rather a module that can be added to SolarWinds’ Network Performance Monitor (NPM). The combination of these two modules create a complete network monitoring software package. NTA and NPM integrate with the rest of SolarWinds’ Orion platform tools, such as the Network Configuration Manager.
What does SolarWinds NetFlow Analyzer do?
NTA collects interface-level flow data and Cisco Class-Based Quality of Service (CBQoS) data, combining them with performance data that NPM collects from SNMP, WMI, and other sources. It processes the data to produce interactive graphs and customizable reports, giving you “one pane of glass” visibility into your network’s status and its historical behavior.
NPM and NTA offer you a wide range of sophisticated facilities for managing multi-vendor networks: bandwidth monitoring, traffic analysis, performance analysis, alerts, customizable reports, policy optimization, etc. NTA and NPM are available in a 30-day fully-functional trial, and pricing depends on the number of network elements you’ll be monitoring.
SolarWinds NetFlow Analyzer key features and capabilities
A bandwidth monitor and traffic analyzer primarily helps you to detect and troubleshoot network problems, and to identify traffic patterns and trends so you can adjust policies and plan network changes.
What are NTA’s particular strengths?
- Monitoring bandwidth use NTA identifies the users, applications, protocols, and IP address groups consuming the most bandwidth, as well as tracking conversations among internal and external endpoints.
Bandwidth monitoring and root cause identification is enhanced by using Cisco NBAR2 (next-generation Network-Based Application Recognition) to help identify common applications and application categories; Cisco WLC (Wireless LAN Controller) traffic monitoring to track the applications and users consuming wireless bandwidth; and the SolarWinds User Device Tracker to identify bandwidth hogs and their locations. - Analyzing traffic patterns NTA collects traffic data, correlates it, and presents it in its web console. NTA can provide one-minute granularity and analyze historical data over months, days, and minutes. It supports drilling down to individual devices and interfaces
- Analyzing performance The PerfStack performance analysis dashboard lets you drag and drop performance metrics onto a common timeline so you can visually correlate network behavior across stacks and more quickly find root causes.
- CBQoS policy optimization When you depend on services like VoIP and cloud applications, intelligently prioritizing and managing traffic becomes critical. NTA lets you compare the effectiveness of pre- and post-policy traffic levels to determine if your QoS policies are working and prioritized traffic is flowing as planned.
- Bandwidth capacity planning Your capacity planning can be more insightful when you can see what your bandwidth utilization patterns are and identify key consumers. Reviewing history lets you identify patterns of peak usage. You can then adjust policies, forestall outages, and avoid buying additional bandwidth when it’s not needed.
System requirements
As mentioned above, NetFlow Traffic Analyzer is an add-on module for the SolarWinds Network Performance Monitor. NTA uses NPM’s database and node management facilities.
NPM and NTA, as well as the other major tools in SolarWinds’ network management suite, are built on a common backend, Orion. Orion provides the unified user interface, centralized administration, and access control, and shared functionality for navigation, settings, alerts, and reports.
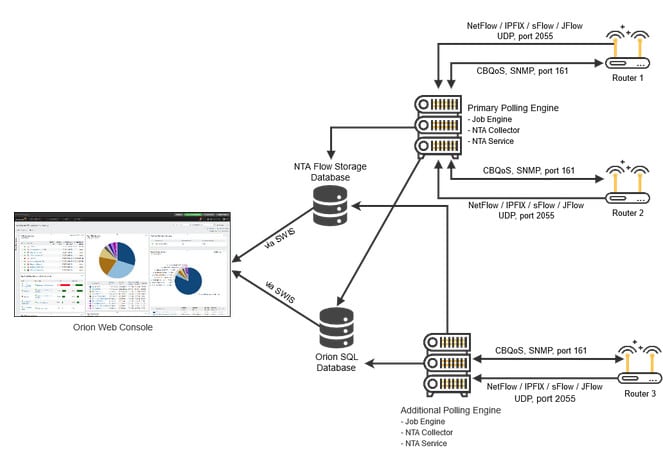
NTA and NPM run on Windows. They are enterprise-grade packages, so even the 30-day free trial demands considerable resources on your system. For production use in all but the smallest shops, SolarWinds recommends three servers:
- A Windows Server Orion app server (also called the main poller) hosts the web console and does data collection.
- A SQL Server Orion Database Server stores collected performance, log, and configuration data.
- A SQL Server Flow Storage Database stores the flow data.
SolarWinds specifies system requirements and best practices for good performance and best results. Recommendations for OS version, CPU speed and number of cores, amount of RAM, NIC speed, and disk-array configuration vary depending on the number of network elements being monitored (from less than 1,000 up to greater than 6,000). However, NTA itself is sufficiently demanding that an NTA install should always be treated as a large installation.
For larger networks still, you can scale up further by adding more servers as additional polling engines.
How to install SolarWinds NetFlow Traffic Analyzer
Installation of the NetFlow Traffic Analyzer is straightforward – once you have the prerequisites in place. As mentioned above, for a production environment the recommendation is for three semi-dedicated servers with adequate hardware and certain system software pre-installed.
Since NTA is a module of NPM, you must install NPM first. Once unzipped, the installer checks for prerequisites, installs missing system software and then launches the configuration wizard. The wizard will guide you through providing the needed information, and then performs auto-discovery of the devices on your network.
Discovery will be most useful if the devices you want to monitor have already been configured to answer queries for metrics and periodically export flow data. So you should enable SNMP and WMI on the network devices and hosts of interest. And you’ll want to enable the flow protocols supported by the devices of interest so they send flow data to NTA.
On NPM (and NTA), once discovery is complete, you need to select which of the now-known devices you want to import into the Orion database and begin monitoring. SolarWinds recommends you start with a limited number of key devices and servers, and then expand as indicated. (You can always see the list of known devices via navigating to My Dashboards > Network > Network Summary).
Once NPM is installed, you install NTA on the Orion app server following the same pattern. There is a manual step to move the flow storage database to its own server.
How to configure SolarWinds NetFlow Traffic Analyzer
The key configuration task is populating NPM and NTA with the list of devices to be monitored, which takes place during installation, described above.
For best performance and results from monitoring, SolarWinds provides guidelines for best practices about where on your network you should be capturing flow data and how to configure storage and retention.
How do I use SolarWinds NetFlow Traffic Analyzer and Network Performance Manager?
Daily use of NPM and NTA involves detecting and troubleshooting network problems and identifying patterns and trends in network traffic. This is done via web console views, alerts, and reports (SolarWinds provides a live demo of NTA to try out the interface).
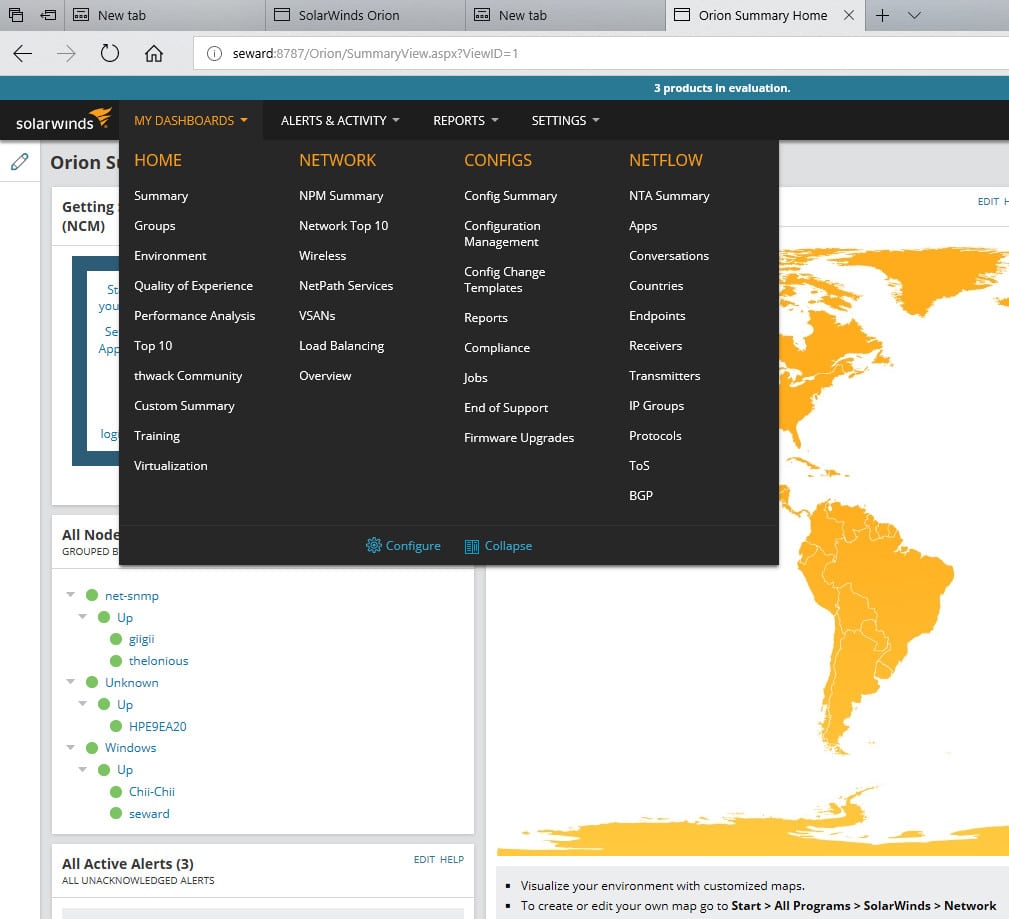
In the web console, the initial view includes a list of tabs. The Home and Network tab are contributed by NPM; other tabs come from installed modules, such as NetFlow from NTA. Each tab lists multiple views – pages you can visit – which use graphs, tables, and text to show details and statistics about the monitored elements of your network.
In the various views, network elements are color coded. A red or partially red element needs attention; a yellow one has a warning. Also, the various Top 10 lists (Network Top 10, Top 10 Interfaces by Percent Utilization, Top 10 Errors and Discards Today, etc) quickly highlight elements in your network that have health issues. The Top Talkers lists are particularly useful for spotting incipient bandwidth problems.
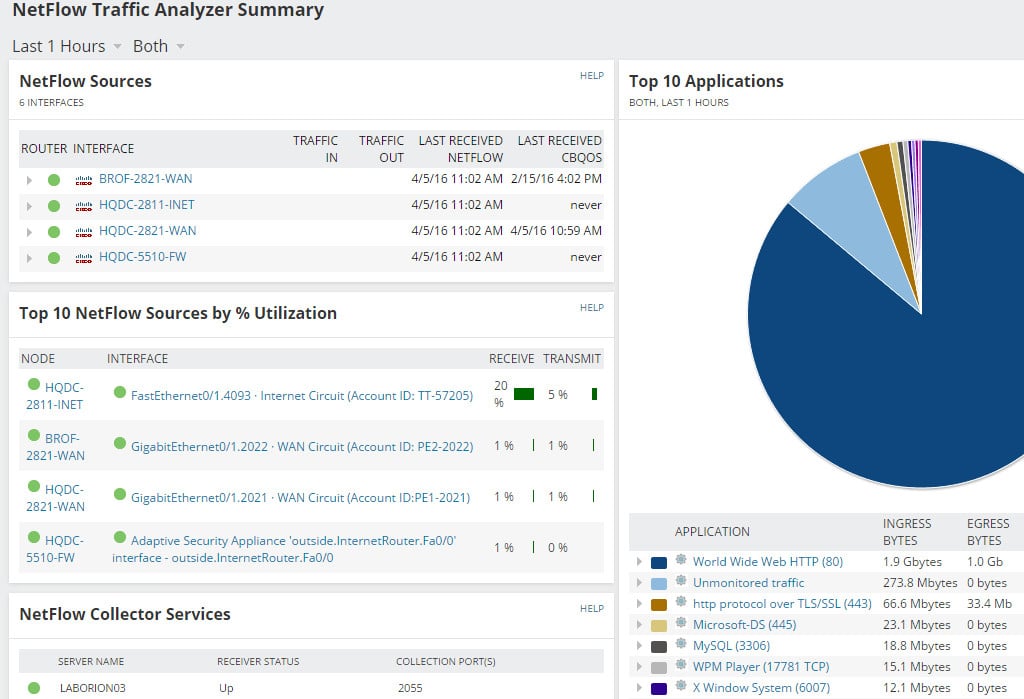
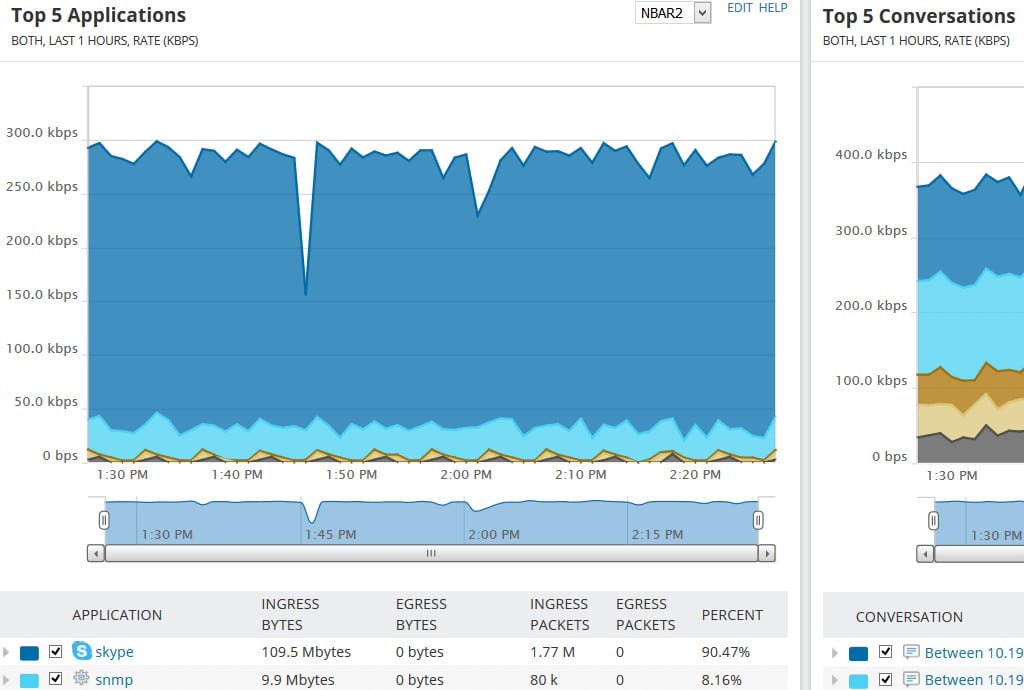
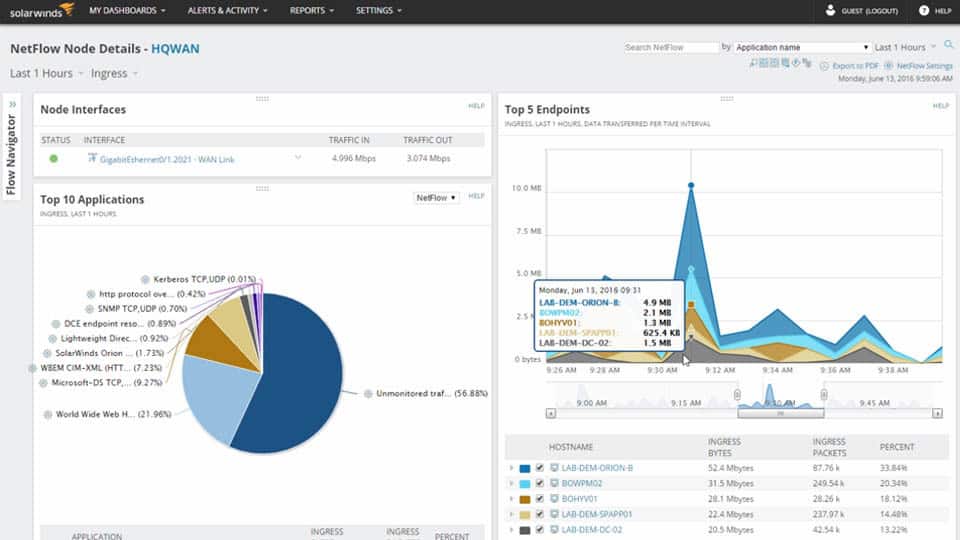
The default view for NTA contains multiple sections like Top 5 Applications, Top 5 Endpoints, Top 5 Conversations, Top 10 Sources by % Utilization, etc.
Graphics are interactive. Hovering over an element produces a popup with details about it. You can quickly filter out clutter to focus on relevant types of data and time ranges of interest. Such customized views can be saved for reuse.
Alerts – both predefined and custom ones you have added – are triggered when a problem is detected. A node going down is a predefined alert; alerts can also include things like an interface going down or becoming overloaded.
Triggered alerts show up in the Active Alerts section of the initial view. They can also be sent to you by email or SMS text or other means, based on your alert configurations. You can specify that an alert message should include relevant network status information and links to relevant views in the web console.
For bandwidth, the ability to tailor alerts is particularly useful. You can adjust the thresholds for receive and transmit percent utilization to be notified of problems such as bandwidth hogs.
When investigating an element or alert, you can drill down into it in the view to get more detailed status and metrics. These help determine if this is a momentary problem or a persistent issue and help identify the root cause.
When a particular interface becomes a concern you can examine its details. You can also use Flow Navigator filters to create a custom view that focuses on devices, applications, and time periods of interest.
NTA makes it easy to identify the users, applications, and protocols consuming the most bandwidth. You can sort by ports, source, destination, and protocols, and view traffic patterns over minutes, days or months.
There’s an array of predefined reports, and facilities to create custom reports, that process flow data into charts and tables showing how the network is being used and how that’s changing over time. You can schedule reports to be automatically run and delivered. Predefined reports such as “Average and Peak Traffic Rates – WAN Interfaces Last 7 Days” show what useful information can be obtained to help bandwidth capacity planning.
SolarWinds Flow Tool Bundle
Another free option from SolarWinds is the Flow Tool Bundle. This pack includes:
- NetFlow Replicator
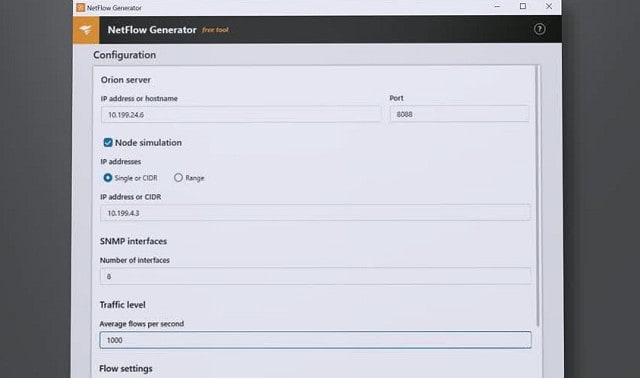
- NetFlow Generator
- NetFlow Configurator
These three utilities are network traffic workhorses and they don’t include the great graphics displays of regular, paid SolarWinds tools, such as the NetFlow Traffic Analyzer.
Why do we recommend it?
SolarWinds Flow Tool Bundle is a pack of three small utilities to set up NetFlow on network devices and then run traffic tests across the network. You can generate IP traffic and send it, then extract statistics with NetFlow to identify the paths that the packets took. This suite can be used for network stress testing.
The NetFlow Configurator provides an interface to your Cisco routers to specify which traffic the device should sample, using NetFlow v5. You can specify where these records are sent so that the can be caught by your NetFlow collector.
The NetFlow Replicator enables you to circulate NetFlow packets to specific destinations on your network. This will give you a picture of the capacity performance of specific links on your network, which is a great opportunity for testing the abilities of your network equipment. The NetFlow Generator creates extra traffic for your network. This is a useful tool for testing the behavior of load balancers, firewalls, and network performance monitoring alerts.
Who is it recommended for?
The package enables a network administrator to be sure that NetFlow is activated on all devices that carry the protocol – the system is usually only available on Cisco devices. You can then test that you have the service set up correctly by running synthetic traffic through the devices and extracting activity reports with NetFlow.
Pros:
- Completely free bundle of tools
- Great for testing Cisco equipment and troubleshooting NetFlow messaging
- Can test networks with simulated traffic prior to going live
- Allows you to replay specific traffic patterns to replicate errors
Cons:
- Is a highly specialized suite of tools designed for network professionals, not designed for non-technical users
These three utilities do not overlap with the functionality of the NetFlow Traffic Analyzer, so installing the Flow Tool Bundle compliments the capabilities of those other SolarWinds packages. The Flow Tool Bundle is available as a free download.
SolarWinds Network Bandwidth Analyzer Pack
 The common platform of the Network Traffic Analyzer and the SolarWinds Network Performance Monitor makes these two modules a great combination because they are able to work together to give full network monitoring functions.
Why do we recommend it?
SolarWinds Network Bandwidth Analyzer Pack is a logical combination of SolarWinds tools. It isn’t actually possible to use the Network Traffic Analyzer without having the Network Performance Monitor active as well. This is because the NTA relies on the Network Performance Monitor for device discovery and inventory creation.
Who is it recommended for?
Having both the NTA and the NPM together gives you a complete view of your network. If devices develop faults with components, the NPM will tell you and if switches are overloaded by too much traffic, the NTA will tell you. The two tools can help you plan capacity and get a view of how traffic is processed by switches in a path between two endpoints on the network.
Pros:
- Great interface that balances visualizations and key insights well
- Highly customizable reports, dashboards, and monitoring tools
- Uses simple QoS rules for quick traffic shaping
- Built with large networks in mind, can scale to 50,000 flows
- Available for both Linux and Windows
Cons:
- Is a highly specialized suite of tools designed for network professionals, not designed for non-technical users
SolarWinds offers both of these tools in a combo deal, called the Network Bandwidth Analyzer Pack. With these two tools working together you will be able to check on traffic flows and network device health, giving you the ability to head of network performance problems.
SolarWinds vs WhatsUp Gold vs Paessler
The main competitors to the SolarWinds NetFlow Traffic Analyzer are the WhatsUp Gold Network Traffic Analysis add-on and the Paessler PRTG network monitor. Here is a short review that compares the attributes of these three packages.
The configuration of WhatsUp Gold’s network monitoring software is much closer to that of the SolarWinds deal. In both cases, you buy a network performance monitor first and that monitors your network devices. ON top of that, you buy a traffic analysis module. In both cases, the two modules are written on a common platform and so integrate seamlessly. In the case of PRTG, you get a combined network, server and applications monitor, which includes bandwidth analysis straight out of the box. The Paessler system can be tailored because it is charged on the number of sensor that you activate. If you are not interested in server and application monitoring, you just don’t turn those sensors on and so then you end up with a combined network performance monitor with bandwidth analysis.
Take a look at the table below to see the network device messaging systems with which each of these rival tools can interact:
| Protocol | SolarWinds (FREE TRIAL) | WhatsUp Gold (FREE TRIAL) | Paessler (FREE TRIAL) |
|---|---|---|---|
| NetFlow | Yes | Yes | Yes |
| NetFlow-Lite | No | Yes | No |
| IP-FIX | Yes | Yes | Yes |
| J-Flow | Yes | Yes | Yes |
| sFlow | Yes | Yes | Yes |
| NetStream | Yes | No | No |
| NSEL | No | Yes | No |
Paessler also has a custom packet sniffer sensor, which will aide you in bandwidth monitoring tasks.
All three of these network monitoring software packages include traffic testing measures such as Ping and Traceroute. The three packages also include quality of service and traffic shaping methodologies, which are shown in the table below:
| Methodology | SolarWinds (FREE TRIAL) | WhatsUp Gold (FREE TRIAL) | Paessler (FREE TRIAL) |
|---|---|---|---|
| Quality of Service (QoS) | Yes | Yes | Yes |
| Class-Based QoS (CBQoS) | Yes | Yes | Yes |
| NBAR | No | Yes | No |
| NBAR2 | Yes | No | No |
| Wireless LAN Controller (WLC) | Yes | Yes | Yes |
| IP SLA | Yes | Yes | Yes |
All of these packages are able to monitor VLAN traffic and queue prioritization algorithms. They are all also capable of extending monitoring and bandwidth tracking over the internet to include Cloud service and remote sites in the monitor’s view.
All three of these network monitoring software packages include analysis function and delivery stack visualizations to help you isolate the source of performance problems.
SolarWinds NetFlow Traffic Analyzer is powerful though not self-contained
The SolarWinds NetFlow Traffic Analyzer is a very capable tool.
The key factor to consider is that NTA is not self-contained, but rather a module of a larger system which it presumes and leverages. If you already have a non-SolarWinds network management infrastructure in place, you can’t simply add NTA to it; choosing NPM and NTA is a commitment to SolarWinds Orion.
NTA integrates well into that larger system. The rich tool suite offers a lot of ability to add other tools as needed, as well as the scalability to grow with your network. If you have – or expect to grow into – a large and sophisticated network environment, NPM and NTA make a lot of sense.
SolarWinds NetFlow Traffic Analyzer FAQs
What is SolarWinds NetFlow traffic analyzer?
SolarWinds NetFlow Traffic Analyzer (NTA) is a companion module that can be added to the Network Performance Monitor. It will extract operational data from network devices using a query language that is built into each device. The name NetFlow comes from the statistics service that is included in devices produced by Cisco Systems. The SolarWinds tool can communicate with that system and also has the capability of using J-Flow, which is an equivalent protocol used by Juniper Networks and the Huawei version, which is called NetStream. NetFlow Traffic Analyzer also has sFlow and IP-FIX which are industry standards that are used by other network device manufacturers. Joining together the traffic data taken from each device enables the NetFlow Traffic Analyzer to draw up a traffic flow map of the network.
Does SolarWinds support NetFlow?
SolarWinds NetFlow Traffic Analyzer supports NetFlow for communicating with network devices produced by Cisco Systems. IT can communicate using NetFlow version 5 and NetFlow version 9. This capability enables the monitoring package to extract traffic data from devices. The tool can also communicate with Juniper Networks’ devices through J-Flow and Huawei devices using NetStream, The package can also use SFlow and IP-FIX, which are non-proprietary protocols that perform the same service as NetFlow.
What is the purpose of NetFlow?
NetFlow is a statistics gathering unit that is built into routers from Cisco System. The service gathers data about the packets that enter the switch on each of its interfaces. By reading packet headers, the tool can also record the destination interface and the device that data is going to. It can also note down the protocol of the traffic. This data is stored within the router and it can be queried by network monitoring software for traffic analysis.
Networking Earth by Geralt, licensed under Creative Commons CC0. Orion architecture diagram from NetFlow Traffic Analyzer Getting Started Guide.

