

WebLogic Server, a widely-used Java-based application server, was created in the mid-1990s by a company called WebLogic, Inc. (later acquired by Oracle Corporation). Its creation was driven by the need to provide robust, scalable solutions for enterprise applications in the evolving landscape of the internet and web-based technologies.
Short of time? Here is our list of the best WebLogic Server tools:
- BEA WebLogic Administration Console EDITOR’S CHOICE An Oracle product that is a browser-based interface to your databases and WebLogic implementation. Includes server and application monitoring plus troubleshooting tools.
- WebLogic Smart Dashboard and Monitoring (WLSDM) This clever tool from Volthread Information Technologies scans your WebLogic domain and gives recommendations on improvements when it is installed. It then continues to monitor and advise.
- SolarWinds WebLogic Performance Management Tool This tool is part of the SolarWinds Server and Application Monitor and it tracks WebLogic activity, noting application server threads and memory leaks.
The Evolution of WebLog Server
Early Web Development Challenges
In the 1990s, the web was growing rapidly, and businesses were beginning to recognize the potential of the internet for building dynamic, interactive applications. However, early web applications were often static and lacked the capability to handle complex business logic. The architecture of these early web applications was simple and didn’t provide features necessary for large-scale enterprise use, such as session management, transaction support, and scalability.
This gap in functionality, combined with the rising need for web-based enterprise applications, created a demand for a platform that could efficiently manage business logic and support the emerging e-commerce and enterprise software needs.
The Role of Java and Enterprise Application Integration
In 1995, Sun Microsystems introduced the Java programming language along with the Java 2 Platform, Enterprise Edition (J2EE), which provided a standardized framework for building enterprise-level applications. With Java’s portability and ability to work across different systems, it became the go-to technology for developing large-scale applications. However, building these enterprise-grade applications required a middleware layer to support features like web services, database connectivity, and distributed computing.
The Founding of WebLogic, Inc.
In 1995, Terry Shannon and his team at WebLogic, Inc. saw the opportunity to build a product that would bridge the gap between Java-based enterprise applications and the web. Their goal was to create an application server that could provide a platform for building scalable, secure, and reliable enterprise applications. The result was WebLogic Server, which offered critical capabilities like support for JavaBeans, JSPs (JavaServer Pages), and Servlets, along with integrated transaction management, scalability, and security.
Acquisition by BEA Systems and Oracle
In 1998, WebLogic, Inc. was acquired by BEA Systems, a company focused on enterprise middleware solutions. This acquisition marked the beginning of WebLogic Server’s widespread adoption in the enterprise market. In 2008, Oracle Corporation acquired BEA Systems, and WebLogic Server became part of Oracle’s middleware portfolio, further solidifying its position as one of the leading application servers.
Thus, WebLogic Server was created to meet the growing demand for web-based, enterprise-level applications, powered by the new Java technology, and it has since evolved into a cornerstone of enterprise application infrastructure.
What is a WebLogic server?
A WebLogic Server is an application server that functions as a platform for developing, deploying, and running multi-tiered (n-tiered) distributed Java-based applications. It also serves as a bridge or “connector” between the applications that are hosted on it and the likes of remote databases or messaging servers.
Oracle Corp. has become a popular provider of online transaction processing (OLTP) platforms in the market today, and WebLogic Server is one of the tools that have allowed the tech company to become such a major contender. They acquired this Java 2 Platform, Enterprise Edition (J2EE) server with their acquisition of BEA Systems in 2008.
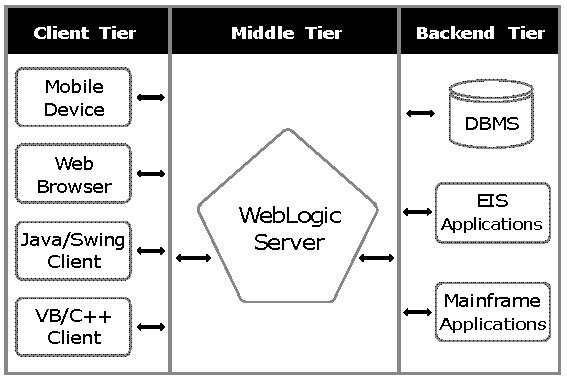
A WebLogic Server sits in the middle tier – along with the likes of proxies and firewalls. This is the tier that is located between the front-facing external applications (“Presentation or Client Layer” – usually browser-enabled interfaces with the outside world) and the database servers (“Backend Layer” – the servers where data is stored).
From this middleware position, a WebLogic Server centralizes application services such as:
- Web services – the various functions of a web server
- Business services – the business components of a process
- Backend connectivity – enabling of connections to backend storage devices and servers
In other words, this Java-based application server enables an optimal and streamlined end-to-end performance of business processes. What’s more, the fact that it uses technology features like caching and connection pooling means WebLogic Server also helps with cutting down processing and transaction times.
Finally, it shouldn’t be forgotten that this server system also provides enterprise-level security and powerful role administration capabilities.
So, how exactly do you use WebLogic Server?
Now that we have seen the generic definition of what a WebLogic Server is, let us get a bit more technical and see if we can’t break down its components as we try to describe it.
The basic WebLogic architecture
Apart from serving as a J2EE server, a WebLogic Server can be used to organize and administer other servers and, thus, the services running on them. Before we look into that, let’s define a few digital concepts that are used in its realm.
Domain
This is a collection of applications that have been grouped together for ease of administration. A domain consists of an admin server and a number of managed servers that are under its control.
Base domain
This is a new domain that only has an admin server and nothing else. It may not be practical, but it can exist on its own.
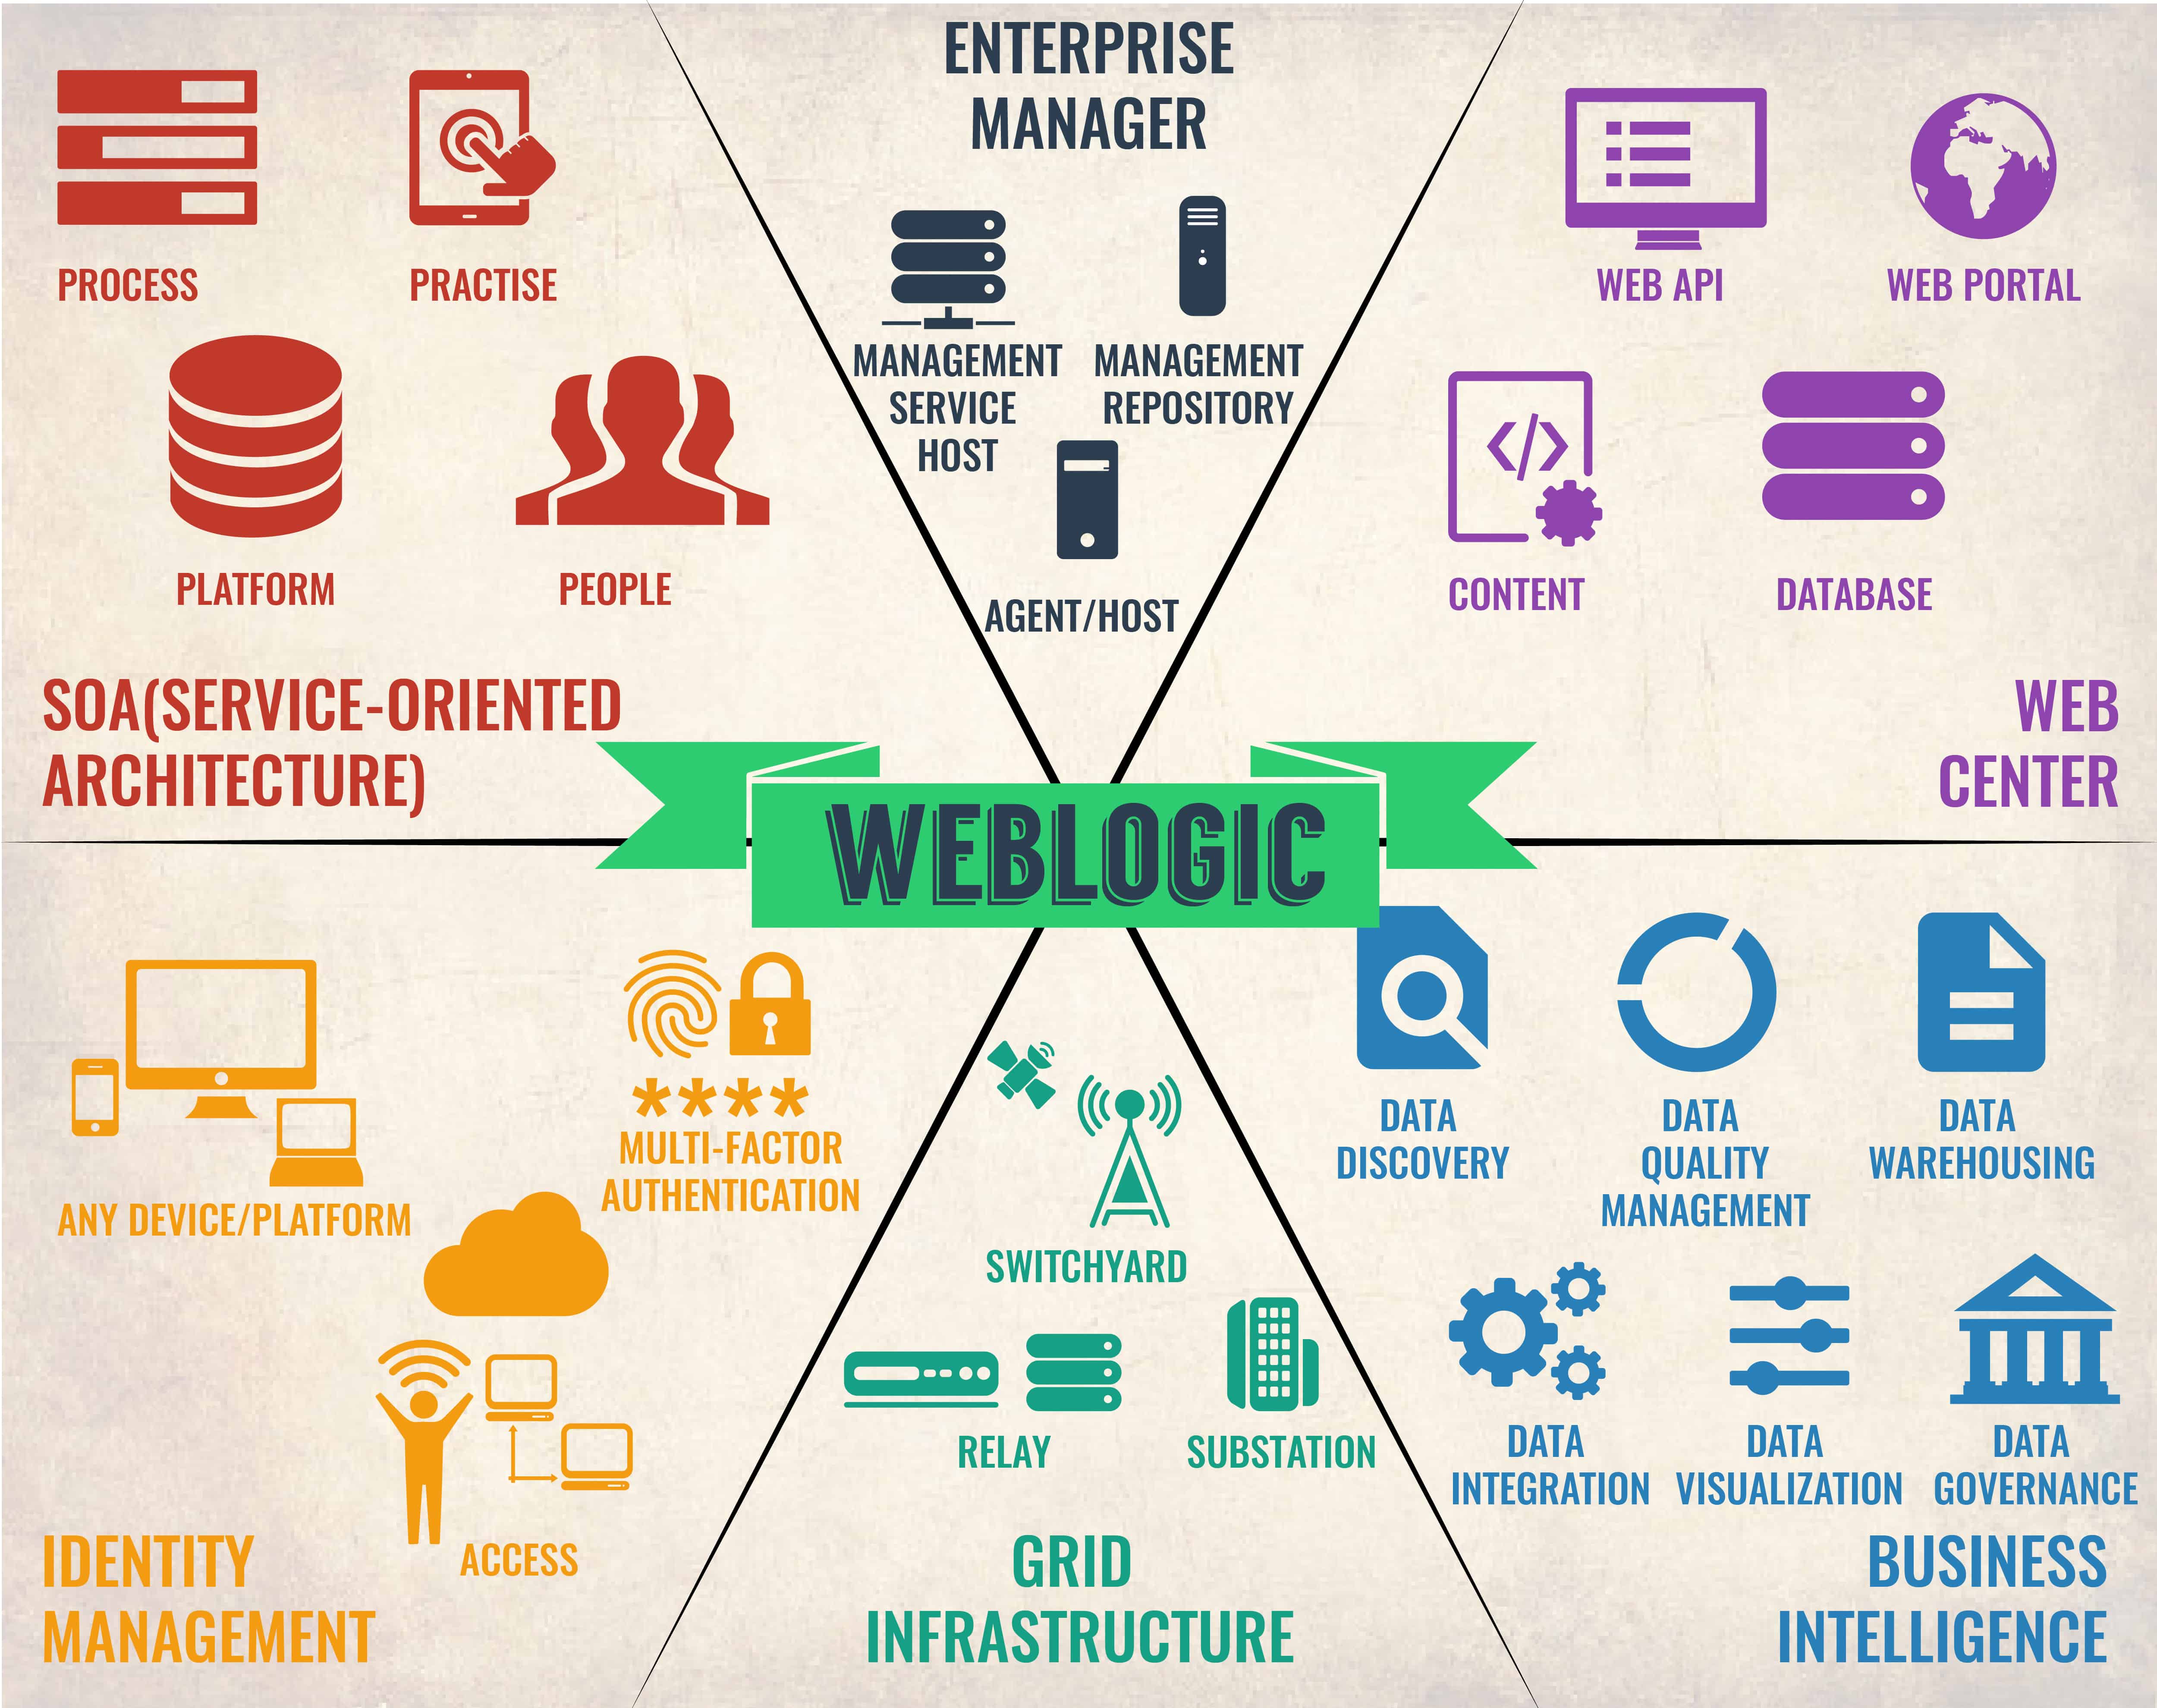
Managed servers
These servers exist inside a domain and serve various purposes. Examples of such servers are SOA Suite, WebCenter Suite, and the Business Intelligence Suites.
The following video explains these concepts in a more visual way:
Oracle – Understanding WebLogic Architecture
What happens when you install WebLogic Server?
To download your copy of WebLogic Server you need to go to the Oracle Technology Network software download page. After accepting the license agreement and downloading your preferred version of the software, you are all set to start your installation.
The installation scenarios that can play out include:
- Creation of a base domain – whenever you install a fresh instance of WebLogic you will, by default, create a basic domain with no managed servers. Until the managed servers are added, it really won’t do much.
- Creation of managed servers in the base domain – next, you move on to creating managed servers that are added to the main base domain. This is called “extending the base domain.”
- Creation of managed servers in new domains – if you decide you want to have your managed servers run in their own domain, WebLogic allows you to clone the existing admin server in the main domain and use it to create a new domain for your new managed server. This is known as “extending managed servers.”
- Clustering managed servers – in this scenario, once the managed servers have been installed in their different domains they can be “clustered” together to be run by one admin server which can reside in either of the domains.
Whatever your choice of installation, or the initial choice of architectural configuration, you can always restructure your design later, depending on the needs of your business processes logic.
Who is the WebLogic Server for?
Ideally, a WebLogic Server would sit well in a business’ technology environment where it would be configured to help by:
- Serving as a hosting solution for all Java-based applications
- Acting as a home for high-end websites
- Enhancing performance as an optimal and secure solution for issues with slow connectivity between front-end applications and back-end servers
- Becoming a bridge able to handle the business’ scalability issues as the digital footprint continues to grow
In short, it can be said that WebLogic Server is an application server that has the future in its sights. It serves as the facilitator for other [Java] applications, business suites, and hardware devices that need to be included in a business’ data processing flow.
See also: Improve Java App Performance
What monitoring and management tools are used with WebLogic Servers?
A system that enables other systems needs to be configured and managed with care. It should itself be working well before it can oversee other systems. That is why it is important to keep track of their monitoring and management tools.
The Best WebLogic Server Tools
Our methodology for selecting WebLogic Server tools
We reviewed the market for WebLogic Server monitoring and management systems and assessed the options based on the following criteria:
- A service that can interface with WebLogic Server to extract activity statistics
- A system that routinely collects server status reports
- A package that can correlate WebLogic Server activity with server resource usage
- A service that can track the activity of applications that access WebLogic Server
- A system that includes memory management
- A free trial or a demo package for a pre-purchase assessment opportunity
- Value for money from a WebLogic Server monitoring tool that is offered at a reasonable price
Below, we will have a look at three of the most popular WebLogic Server administration and monitoring tools.
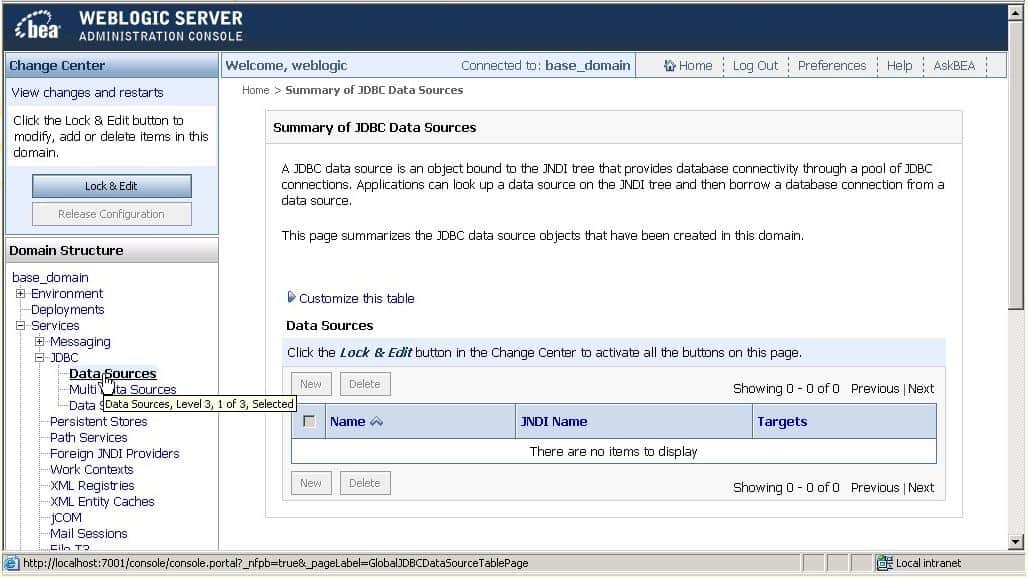
1. BEA WebLogic Administration Console

Key Features:
- Web-Based Convenience: Access the console from any web browser on your network, eliminating the need for local installation on each admin machine.
- Centralized Management: Configure, monitor, and administer all aspects of your WebLogic domain, including servers, clusters, deployments, security, and more, from a single interface.
- Visualizations and Tools: Provides clear visualizations of server health, performance metrics, and resource utilization.
- Role-Based Access Control (RBAC): Implement security measures by assigning different access levels to users based on their administrative needs.
- Deployment Management: Deploy and manage applications and EJBs within your WebLogic domain.
Jobs that can be done using this administration tool include:
- Starting, stopping of instances and configuration of clusters
- Configuration of server services like database connectivity (JDBC) and messaging (JMS)
- Security, administration, and managing of users, groups, and roles
- Configuration and deployment of Java applications
- Monitoring performance of servers and applications, troubleshooting help via server and domain log files
Why do we recommend it?
BEA WebLogic Administration Console is a product of Oracle Corporation, the makers of WebLogic. That gives this tool two advantages: first because it was created with the knowledge of the inner workings of WebLogic and second, that it is supported by a reliable and substantial software provider.
One thing that needs to be said here is that, although the interface may look a bit drab, don’t be fooled by its lack of colors and pizazz – after all, this is a powerful tool made by the people behind WebLogic Server itself.
Who is it recommended for?
This tool is included with WebLogic Server, so you have it anyway. You can choose to use this tool instead of buying a system-wide monitoring package. This system provides an admin dashboard for managing WebLog instances as well as giving insights into activity. However, it doesn’t monitor other applications.
Pros:
- Ease of Use: The web interface offers a user-friendly experience, especially for administrators familiar with WebLogic terminology and concepts.
- Centralized Control: Simplifies management tasks by providing a central location to manage your entire WebLogic domain.
- Compatibility: It works well out of the box and is capable of handling tasks effectively, even in larger environments, ensuring smooth operations without significant customization.
- Scalability: It works efficiently out of the box, even in larger environments, allowing for scalability and smooth operation across various system sizes.
Cons:
- Complexity for Beginners: Those new to WebLogic administration might find the console overwhelming due to the specific terminology and configuration options.
- Web Browser Dependence: Reliant on a web browser for access, which might not be ideal for some remote management scenarios.
- Cost: The tool can be cost-prohibitive for smaller businesses, limiting its accessibility to organizations with larger budgets or specific enterprise needs.
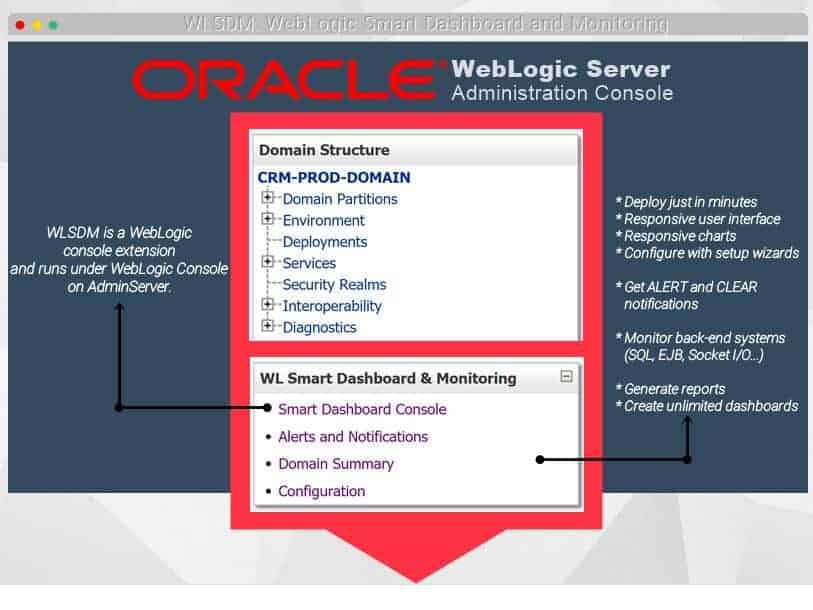
2. WebLogic Smart Dashboard and Monitoring (WLSDM)
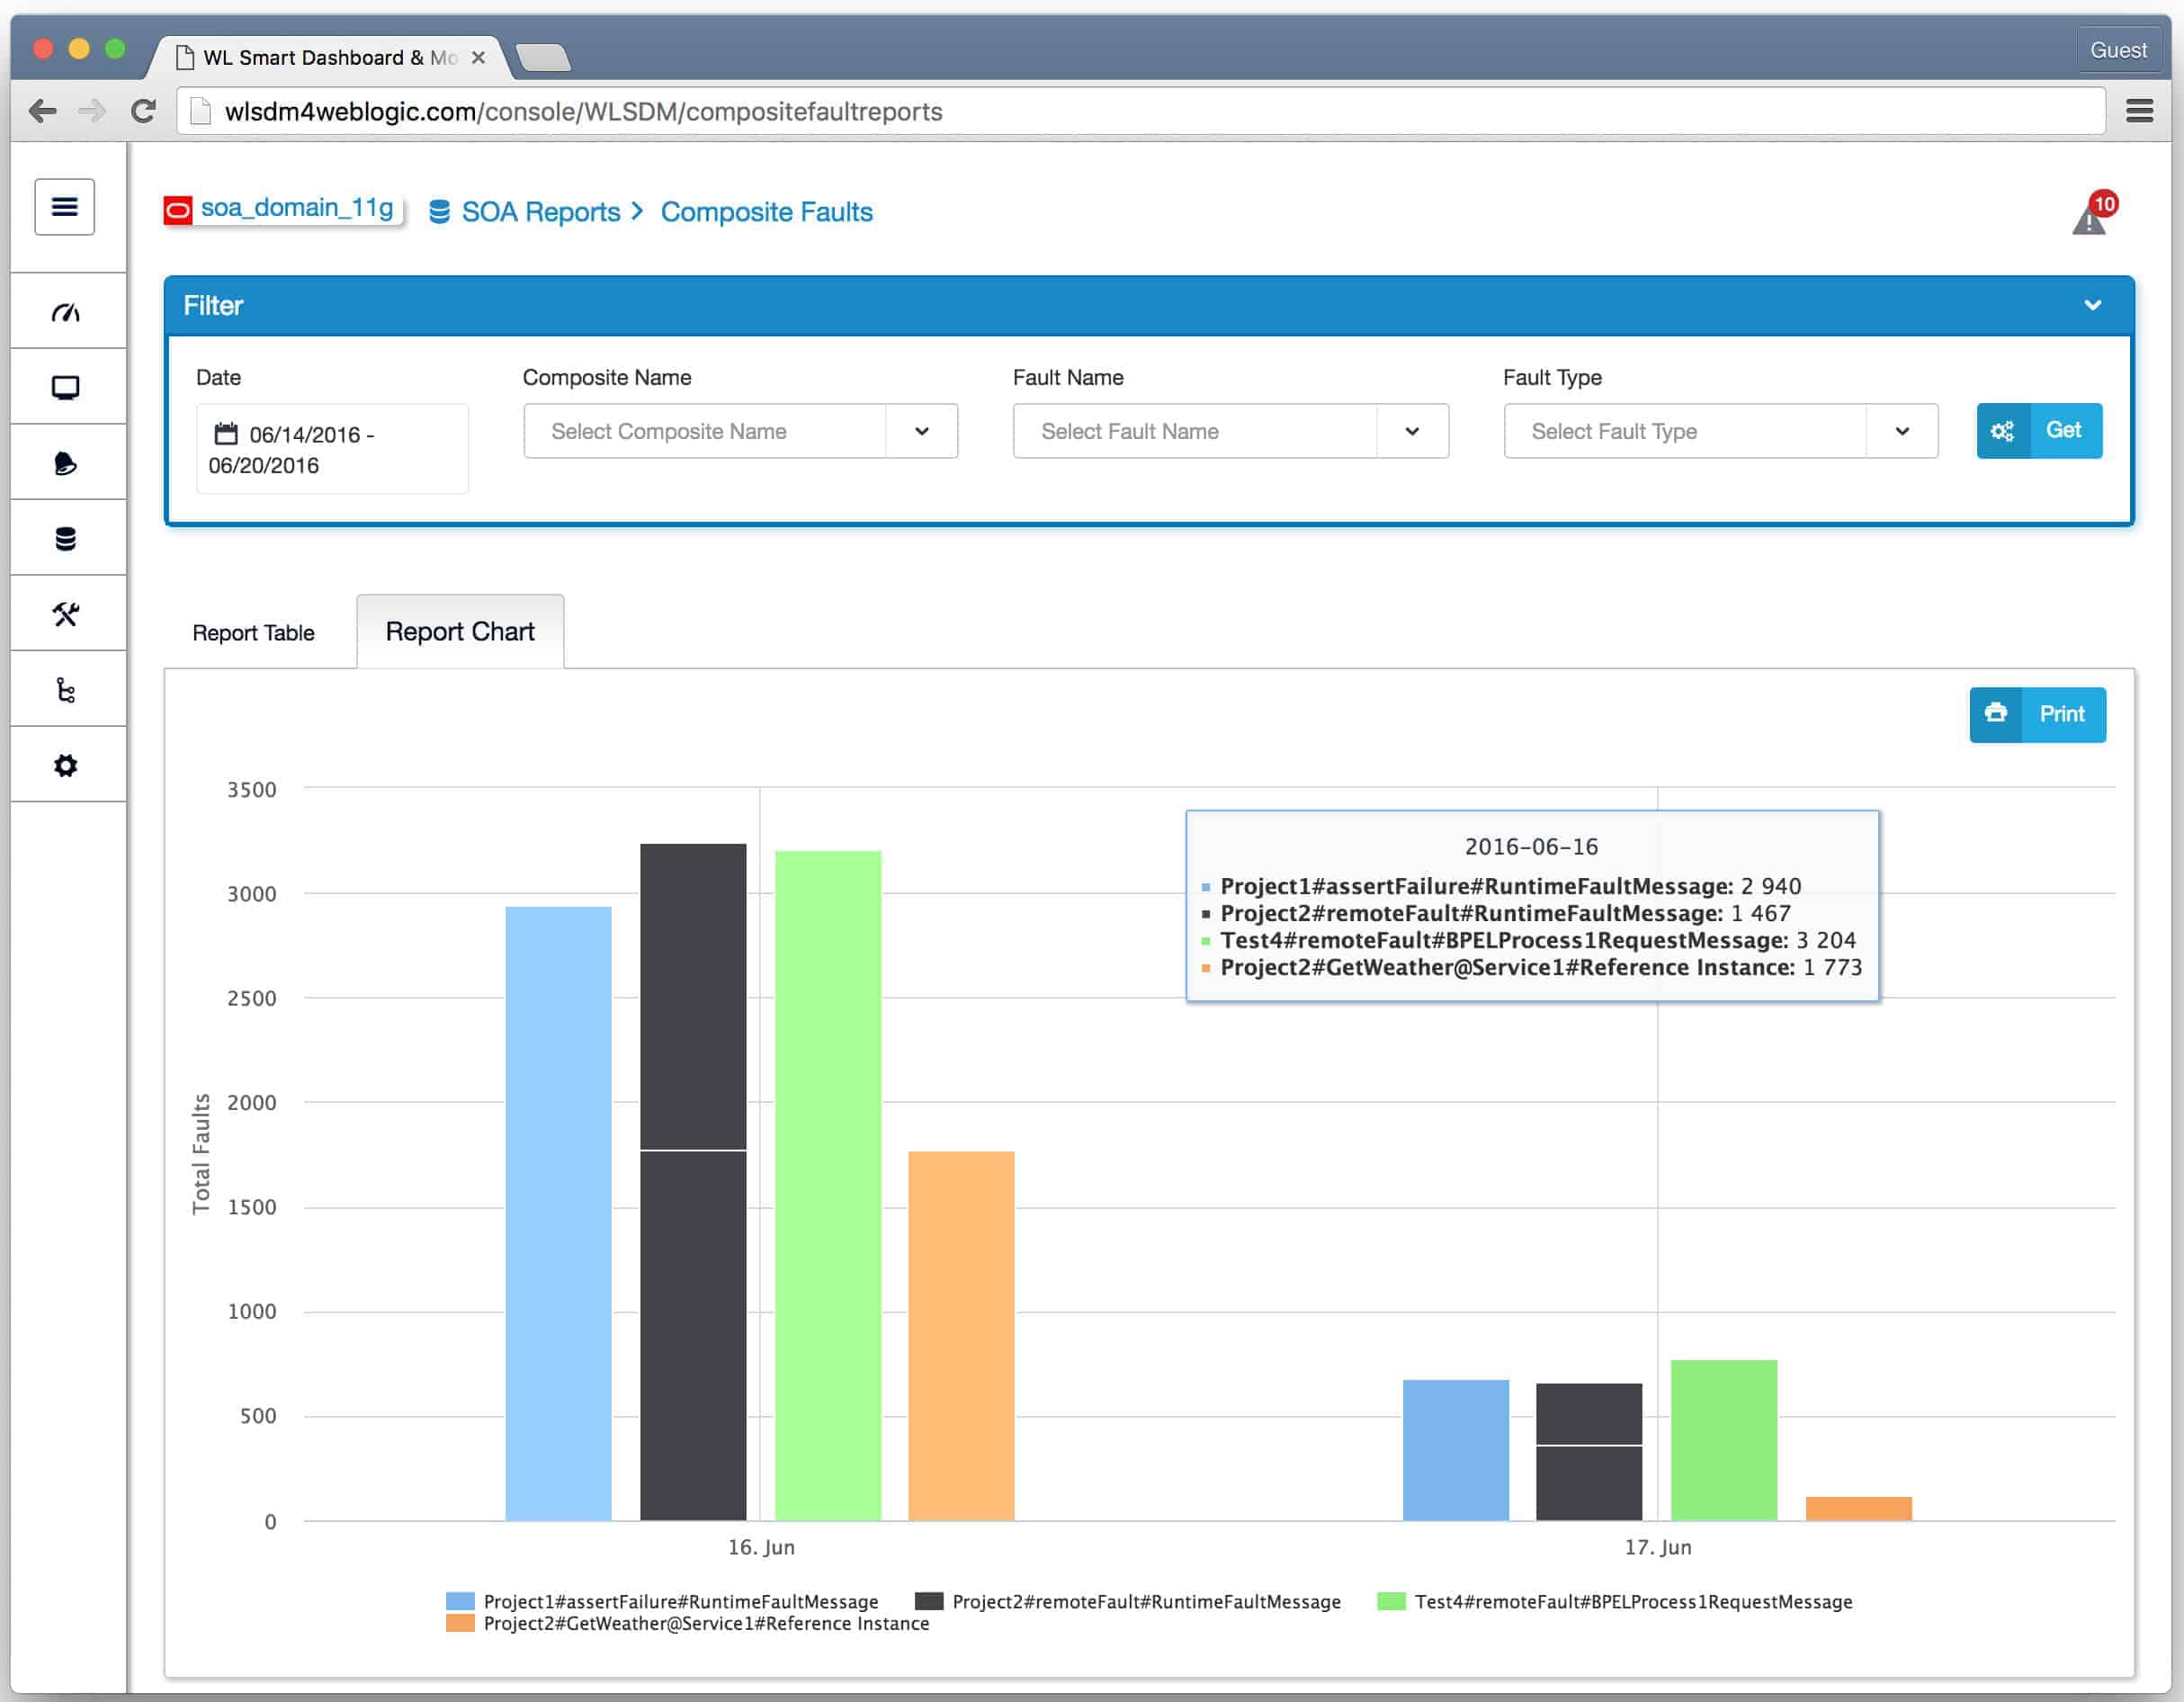
With WebLogic Smart Dashboard and Monitoring (WLSDM) we have another third-party administration and monitoring tool that is the “little engine that could”. It is a console extension – as opposed to a stand-alone solution – that prides itself on being a cheap solution (free for developers) that delivers results that are as good as that from the best of them.
Key Features:
- WebLogic-Centric Focus: Tailored for monitoring WebLogic Servers, offering deep integration and insights into WebLogic-specific metrics (JMX MBeans).
- Easy Setup and Configuration: Designed for straightforward installation and configuration, often requiring minimal setup compared to generic monitoring tools.
- Alerting and Notification: Establishes alerts and triggers notifications (email, SMS) when predefined thresholds are crossed, enabling proactive problem identification.
- Historical Data Storage: Stores historical data on various metrics, allowing you to analyze trends and identify potential issues over time.
- Graphical Reporting: Generates reports with visualizations to present server health and performance data in an easily digestible format.
- Custom Dashboards: Users can create an infinite number of custom dashboards tailored to address specific control and reporting queries, enhancing monitoring and management capabilities.
- Alarms and Notifications: WLSDM facilitates the creation of easy-to-configure alarms and notifications through its metric browser, ensuring administrators stay informed about critical events and performance metrics.
Why do we recommend it?
WebLogic Smart Dashboard and Monitoring is a third-party specialized WebLogic monitoring system. It is available as a service on Oracle Cloud, which enables the tool to integrate into the Oracle operating system on which WebLogic runs. The system accesses data directly from the WebLogic system.
As lean as WLSDM may seem to be, it still punches above its weight and delivers like the best of them – if not better.
Who is it recommended for?
This tool is recommended for development teams that create Java applications that are to be supported by the WebLogic server. The system provides function management services that can also be used for code assessment and testing. The console shows activity in the Oracle FMW Application Stack.
Pros:
- Quick Installation: WLSDM offers an easy, quick, and non-resource-intensive installation process, which is advantageous for extensions.
- Console Extension: WLSDM acts as a console extension, making it an appealing option for smaller businesses looking for enhanced monitoring and management capabilities without complex setups.
- Dynamic Recommendations: It can provide dynamic recommendations based on snapshots of the WebLogic domain, helping administrators make informed decisions about system optimization and performance improvements.
- Simplicity: Compared to other WebLogic server tools, WLSDM offers a simpler interface and functionality, making it more accessible for users with varying levels of expertise.
- Actionable Insights: Focuses on WebLogic-specific metrics, providing more relevant and actionable insights for WebLogic server health.
Cons:
- Learning Curve: Some users may experience a steep learning curve when initially using WLSDM, as it offers advanced features that may require time and effort to fully utilize.
- Cost: While a free developer edition exists, the full-featured version requires a paid license.
3. SolarWinds WebLogic Performance Management Tool

Although it is a third-party product, SolarWinds WebLogic Performance Monitoring Tool is an administration suite that covers all aspects of monitoring and managing WebLogic Servers.
Key Features:
- Memory Allocation Monitoring: Monitors memory allocation and usage to ensure processes are completed efficiently without resource hogging.
- Server and Application Monitoring: Provides detailed insights into performance metrics such as threads, pools, wait times, and request execution times, helping in optimizing server and application performance.
- Integration with Database Performance Analyzer: When integrated with SolarWinds Database Performance Analyzer, it offers comprehensive analysis and reports on Oracle databases in correlation with WebLogic Server for better performance management.
- Monitoring Flexibility: Supports both SNMP monitoring and packet analysis, providing users with more control and customization options for monitoring.
Why do we recommend it?
The SolarWinds WebLogic Performance Management Tool is part of the Server & Application Monitor. The system monitors the activities of WebLogic and simultaneously tracks the utilization of server resources, such as memory and processor activity. This ability to monitor supporting resources along with the application provides immediate root cause analysis.

- Monitoring of databases like SQL Server, MySQL, DB2, SAP ASE, and other databases allowing for almost 100% across-the-board communication when it comes to data storage
- Monitoring of virtual environments and applications like VMware and Hyper-V allowing for replication and testing of simulated settings
As you can see, this tool can really drill down into a WebLogic Server installation and come up with concise reports that are not only informative but are also easy to grasp and pleasant on the eyes.
Who is it recommended for?
The advantage of getting a general purpose application monitor that has a specialization for WebLogic is that you get performance tracking for all of your other applications at the same time. A business that has many applications to track loses time in responding to problems if it has separate monitoring packages for each asset.
Pros:
- Enterprise-Level Design: Tailored for large and enterprise networks, making it suitable for complex network environments.
- Auto-Discovery: Supports auto-discovery, which dynamically builds network topology maps and inventory lists based on devices entering the network in real-time.
- Effective Alerting: Offers robust alerting features that strike a balance between effectiveness and ease of use, ensuring timely notifications for potential issues.
- Customizable Dashboard: Utilizes drag and drop widgets for easy customization of the dashboard’s appearance and layout.
Cons:
- Technical Focus: Designed primarily for IT professionals, it may not be the most user-friendly option for non-technical users who require simpler interfaces.
The SolarWinds WebLogic Performance Monitoring Tool comes with the Server and Application Monitor (SAM) and is available for download with a 30-day free trial.
SolarWinds also provides a bundle that combines the Server & Application Monitor with the specialized Database Performance Analyzer creating an ideal combination for monitoring WebLogic. That package is called the Application Performance Optimization Pack. You can also get that package on a 30-day free trial.
What do the reviews say about WebLogic Servers?
Just like every software solution out there, WebLogic Server tool has its pros and cons; let’s have a look:
Pros:
- It is a quality product from Oracle, the leading database software maker on the planet, and comes with data security and integrity guarantees
- A robust fail-safe solution – it is a must for mission-critical computing environments
- Ability to draw a complete picture over the WebLogic domain with compact reports that allow for easy comprehension and accurate decision making
Cons:
- Might appear to be a bit bulky and bloated when compared to other similar software solutions
- It could also bite into processing times as it tackles issues in the background
- Not every small-to-medium business can afford the rather complex licensing fees
Should you get WebLogic Server?
WebLogic Servers are for businesses that have the computing power to carry the solution and can afford the rather steep fees – or those that think of it as an investment that is worth keeping their digital environment up and running smoothly.
Either way, with the monitoring and management tools that are available, WebLogic Server will continue to grow in popularity; especially with the Oracle fans who are spoilt for choice when it comes to the middle and peripheral Oracle suites that it’s compatible with.
In the long run, WebLogic Server will always be worth every single cent put into it – it will take over the monitoring of your technology while you focus on your business processes.
WebLogic Server FAQs
Is WebLogic a middleware?
Oracle WebLogic is middleware and forms part of the Oracle Fusion suite. Middleware provides services to user-facing software while sitting on top of the operating system.
How do I start WebLogic Server?
There are two servers to start for WebLogic. These are the Administration server and the managed server.
Go to the root domain for our WebLogic system. This should be MW_HOMEuser_projectsdomainsDOMAIN_NAME
For the Administration server run the script binstartManagedWebLogic.cmd on Windows or bin/startWebLogic.sh on Unix.
For a managed server, run the script binstartManagedWebLogic.cmd on Windows or bin/startManagedWebLogic.sh on Unix.
What port is WebLogic running on?
WebLogic services use a number of ports. Among them are:
Oracle WebLogic Server Listen Port for Administration Server
— default port: 7001, range: 7001 – 9000
Oracle WebLogic Server Listen Port for Managed Server
— default port: 8001, range: 8000 – 8080
Oracle WebLogic Server Node Manager Port
— default port: 5556
Oracle WebLogic Server SSL Listen Port for Administration Server
— default port: 7002, range: 7002 – 9000

