
MySQL is an open-source Relational Database Management System (RDBMS). It is almost universally included in web hosting packages. It has just over 15 percent of the global database market – only Microsoft SQL Server has more implementations with 18 percent of the market.
MySQL is a well-tested and reliable system. Its efficiency, scalability, and ease of use make it a top choice for powering everything from small websites to large-scale enterprise applications. However, to ensure optimal performance, security, and reliability, it’s essential to monitor MySQL databases continuously. That’s where MySQL monitoring tools come in.
Effective MySQL monitoring tools allow database administrators (DBAs) and IT professionals to track critical metrics such as query performance, server health, disk usage, memory consumption, and more. These tools provide real-time insights into the database’s operation, helping to identify bottlenecks, prevent downtime, and optimize overall performance. Whether you are troubleshooting slow queries, managing database growth, or ensuring data integrity, having the right monitoring solution is crucial for maintaining a healthy MySQL environment.
In this article, we will explore the top MySQL monitoring tools available today, focusing on their features, benefits, and use cases. These tools range from simple solutions that focus on basic metrics to advanced, enterprise-grade platforms that offer deep analytics and detailed reporting. We cover both free and paid options, allowing organizations of all sizes to find a solution that meets their needs and budget.
Whether you’re an experienced DBA or just getting started with MySQL, understanding the various monitoring tools available can help you ensure that your MySQL databases perform at their best, with minimal downtime and maximum efficiency. By implementing the right tool, you can easily monitor database health, track key metrics, and prevent performance issues before they affect your business operations.
Here is our list of the best MySQL monitoring tools:
- Paessler PRTG MySQL Monitoring (FREE TRIAL) A MySQL monitor that is part of a comprehensive bundle of network, server, and application monitors. It runs on Windows Server.
- Idera SQL Diagnostic Manager for MySQL (FREE TRIAL) This database analyzer can help you to tune the performance of MySQL and MariaDB. Runs on Windows, Windows Server & Linux. Start with the 14-day free trial.
- ManageEngine Applications Manager (FREE TRIAL) MySQL monitoring as part of a server and services monitoring package. It runs on Windows Server and Linux.
- Site24x7 (FREE TRIAL) A cloud-based infrastructure monitoring platform that includes servers, applications, and database monitoring with specialized routines for MySQL monitoring.
- Dynatrace A specialist website monitoring system that includes performance monitoring and tuning for MySQL implementations.
- LogicMonitor MySQL Monitoring A cloud-based infrastructure monitor that includes specialized screens for MySQL monitoring.
- Datadog MySQL Monitoring Part of a cloud platform of system monitoring and management tools, this database performance tracking service can be integrated into monitoring and security services for applications, servers, networks, and cloud resources.
- SolarWinds Database Performance Monitor A monitoring system that has specific screens for MySQL monitoring plus host metrics monitoring and performance tuning functions.
- dbWatch A specialized database monitoring and management system that includes procedures for MySQL monitoring. It runs on Windows, macOS, and Linux.
The best MySQL monitoring tools
There are many SQL analyzers and database scanners available but you really need a full MySQL monitoring system to ensure constant database availability at optimum performance. Don’t rely on methods that just focus on query responses – those checks are useful but not comprehensive. The best MySQL monitoring tools need to focus on the constant availability of services.
Our methodology for selecting MySQL monitoring tools
We reviewed the market for MySQL monitoring software and analyzed the options based on the following criteria:
- Examination of database instance resource efficiency
- Response times reporting for MySQL instances
- Aggregated statistics for all MySQL database instances plus drill-down views to individual instances
- SQL query optimization recommendations
- Live coverage of DBMS instance usage of server resources
- A free trial period for a no-cost assessment exercise
- A good deal on the number of tools that the package contains
1. Paessler PRTG MySQL Monitoring (FREE TRIAL)

Paessler PRTG is a collection of infrastructure monitors covering networks, servers, and applications. Each monitor is called a “sensor” and keeps tabs on one aspect of a system. By combining sensors, PRTG gives a full view of all of the performance issues that could impact a MySQL database.
Key Features:
- Prompt Notifications: Provides quick alerts and notifications about any issues or abnormalities detected within your MySQL database, allowing you to address them promptly and minimize downtime.
- Less Downtime: Helps reduce downtime by proactively monitoring the health and performance of your MySQL database, identifying potential issues before they escalate into major problems.
- Optimized Performance: Helps maximize the performance of your MySQL database by tracking key metrics and providing insights into areas for improvement, ensuring that your database runs smoothly and efficiently.
- Comprehensive SQL Queries Monitoring: Monitors SQL queries comprehensively, allowing you to analyze their performance and identify any bottlenecks or inefficiencies that may impact the overall performance of your database.
Why do we recommend it?
Paessler PRTG MySQL Monitoring is one of many monitoring tools that are packaged together in the PRTG bundle. This is a general performance monitor rather than a database analyzer or performance tuner. You would use this service in conjunction with many of the other sensors in the PRTG package to spot the root cause of performance issues.
One of the methods that PRTG uses as part of its MySQL database monitoring procedures is to launch queries within the database to test response times. The execution of those queries not only measures the health of the database and its structures but also tests all of the factors that go into the running of the database, such as server and network issues.
By combining MySQL monitoring sensors with server and network monitors, the DBA is able to spot the real cause of performance problems which might not actually be the fault of the database itself. 
Who is it recommended for?
PRTG is a system-wide monitoring package and isn’t intended for use by DBAs. This service doesn’t include query analyzers, so you wouldn’t use it to design or fine tune your MySQL database or the queries that run on it.
Pros:
- Scalability: The perfect choice for larger databases, allowing you to expand according to monitoring requirements.
- Critical Application Monitoring: Provides monitoring services tailored for critical applications, ensuring their smooth operation and reliability.
- Graphical Monitoring Tools: Offers user-friendly graphical tools for monitoring MySQL databases, making it easy to visualize performance data.
- Flexible Licensing: In the licensed version, you can access almost all features and pay per feature, allowing you to choose the functionalities you need without paying for unnecessary extras.
Cons:
- Windows-Based: Many users find that it is primarily designed for Windows systems, which can cause compatibility issues for monitoring MySQL databases on Linux systems.
PRTG is charged for by the number of sensors that the buyer wants to activate, with prices set in bands of sensor quantities. You can get a 30-day free trial of the system with unlimited sensors included.
2. Idera SQL Diagnostic Manager for MySQL (FREE TRIAL)

Idera SQL Diagnostic Manager for MySQL offers real-time monitoring of MySQL databases as a basis for its analysis tools. These offer an opportunity to step through each transaction and look at how it hits database objects and system resources.
Key Features:
- Checking Security Issues: It looks out for any security problems in your MySQL database to keep your data safe.
- Managing Multi-User Access: It helps you control who can access your database and what they can do with it, making sure everything stays organized.
- Diagnostics and Analytics: It gives you insights into how your database is performing and helps you diagnose any issues that might come up.
- Enterprise Management: It’s designed to handle extensive databases used by large companies, providing tools to efficiently manage them.
Why do we recommend it?
Idera SQL Diagnostic Manager is a pure DBA tool and it doesn’t have linked server and network monitoring systems. However, this is a benefit for DBAs that just want to focus on the performance of databases. The tool shows all activity within the database as each query executes. It will also recommend changes to queries and objects to improve performance.
The analysis system includes resource activity graphs that show visually how hard the query hits the DBMS as it runs. You can look at the tables that the query accesses, listing the available indexes and foreign keys. With this information, you can see how small adjustments to the query can speed up processing and possibly how new indexes on tables can improve performance.
System management services in this tool include the supervision of administrative processes, such as replication. The monitor has an alerting mechanism that identifies resources that are running short before that shortage impacts performance.
As well as monitoring MySQL, this tool can also work with MariaDB, Aurora, Azure Database for MySQL, Amazon RDS, Google Cloud SQL for MySQL, and Oracle Cloud MySQL Cloud Service.

Who is it recommended for?
This is a database tuning tool and would only be used by database managers to improve live systems. Developers can use the tool for testing and fine tuning before finalizing an application for release. Idera produces similar tools for SQL Server, Oracle, DB2, and Sybase.
Pros:
- Flexible Alerts and Thresholds: You can easily set up alerts and limits according to your needs, making it adaptable to different situations.
- Database Query Optimization: Helps make your database run faster and more efficiently by fine-tuning your queries.
- Real-Time Monitoring: Keeps an eye on your databases constantly so you can catch any issues as soon as they arise.
- Performance Analysis: This tool provides insights into how your database is performing and helps identify any trends over time.
Cons:
- Data Retrieval from Multiple Servers: Some users find issues while retrieving data from multiple database servers, and it makes the monitoring process slow.
The SQL Diagnostic Manager for MySQL installs on Windows and Linux Servers and Idera offers it on a 14-day free trial fully functional download.
3. ManageEngine Applications Manager (FREE TRIAL)

ManageEngine Applications Manager monitors servers and applications. The long list of applications that the tool supports include database management systems. This list includes MySQL databases as well as those from Oracle, SQL Server, Informix, DB2, PostgreSQL, and Sybase.
Key Features:
- Application Observability: It helps you gain insights into how your applications are performing, allowing you to understand their behavior and health.
- DevOps Monitoring: It continuously monitors your software development and deployment process, as well as the infrastructure and applications in production, ensuring smooth operations and early issue detection.
- SQL Metrics Monitoring: Explicitly monitors the performance and behavior of SQL databases, tracking metrics like query execution times and resource utilization to optimize performance and efficiency.
- Machine Learning for SQL Performance: Utilizes machine-learning techniques to analyze SQL query performance data, automatically identifying patterns, anomalies, and optimization opportunities.
Why do we recommend it?
ManageEngine Applications Manager, as explained above, is produced by the same team that delivers Site24x7. This system pre-dates the Site24x7 platform and it includes a range of application monitoring services, such as database monitoring. Like the Site24x7 package, this MySQL monitoring service is intended for use alongside server and network monitoring. By combining these areas of competence, this tool is able to precisely identify the system component that is the cause of a performance issue.
The Applications Manager monitors all of the infrastructures that support MySQL databases, including factors such as CPU, memory, and disk capacity and utilization. The operations of the DBMS are also fully covered by the monitoring tool. Execution statistics such as memory utilization within the DBMS, disk interactions, processing transactions, and response times are also examined regularly. Each metric is shown live in the console and can be set to trigger alerts should performance thresholds be breached. This alerting system means that the DBA does not need to sit and watch all of the performance statistics all of the time.

Execution issues, such as coding errors and inefficient joins are highlighted by the Applications Manager. The tool can assess the table structure of a database against the SQL queries that run on them and recommend structural changes to objects and better query formats to improve performance. So, this tool is also a developer support system. Analysis of usage also provides recommendations on growth in tablespace size, enabling DBAs to plan capacity.
Who is it recommended for?
This ManageEngine tool should be used primarily by a system administrator to automatically track the standard performance of databases. Unlike Site24x7, this unit is priced individually, so companies need to buy the OpManager package to get network and server monitoring as well. An advantage that Applications Manager has over Site24x7 is that includes a section of database analysis for use by DBAs for database tuning.
Pros:
- Trace MySQL Queries using APM: Helps track and analyze MySQL queries, aiding in optimizing database performance.
- MySQL Replication Monitoring: Monitors MySQL replication processes, ensuring data consistency and reliability.
- Find and Fix Slow MySQL Queries: Identifies and addresses slow MySQL queries, improving overall database efficiency.
- Intelligent Forecasting Reports: Provides insightful forecasting reports, aiding in capacity planning and resource allocation.
Cons:
- Issues with Plugin Updates in OpManager: Known problems with updating the Applications Manager plugin in OpManager, potentially affecting functionality.
ManageEngine provides Applications Manager as software that installs on Windows Server and Linux. The package is available for a 30-day free trial.
4. Site24x7 MySQL Monitoring (FREE TRIAL)

Site24x7 is a cloud-based infrastructure monitoring system that covers networks, servers, and applications. It also has specialized services for website performance monitoring. DBMSs are among the applications that Site24x7 can monitor and there is a special adaptation available for MySQL. The services of Site24x7 can be adapted by plugins to monitor specific products and this is how the MySQL monitoring tool gets loaded into the service.
Key Features:
- MySQL Database Optimization: Helps optimize MySQL databases to improve performance and efficiency, ensuring that they run smoothly and effectively.
- Monitor Host-Level and Query-Level MySQL Operations: Provides insights into how the database is functioning at both levels.
- MySQL Transaction Monitoring: Keeps track of MySQL transactions in real-time, allowing you to monitor the progress and status of transactions as they occur.
- Collaborative Data Management: Tools for managing and sharing MySQL data and insights, ensuring that everyone has access to the information they need to make informed decisions.
Why do we recommend it?
Site24x7 MySQL Monitoring is a very close competitor to Datadog – it is cloud based and runs as part of a platform of system monitoring tools. A major reason to recommend Site24x7’s system monitoring packages is that they are produced by the same company that created the ManageEngine tools. The big difference between Datadog and Site24x7 lies with its pricing structure. While Datadog prices each unit individually, Site24x7 provides packages of tools, so you also get network, server, and application monitoring along with your MySQL monitoring service.
The MySQL monitoring tool in Site24x7 will discover all databases on each host that you include in the monitoring service. It then documents each instance and starts live monitoring. These status checks extend to the host and services that support the databases. The MySQL monitoring agent can only be installed on Linux servers. However, it is able to monitor instances running on Windows over a network connection.

Site24x7 is charged for by subscription. The basic package is charged per host quantities with four plans including the monitoring of 10, 40, 100, or more servers. There is a long menu of add-ons that extend each plan.
Who is it recommended for?
Site24x7 provides MySQL monitoring rather than analysis and diagnostics. So, this is a system monitoring package that would appeal to system administrators rather than DBAs. A typical usage scenario would be that the Site24x7 system notices a performance issue with a database and alerts the system administrator, who will look into the full stack performance metrics to see where the problem arose. If the same query constantly raises problems, the system administrator would pass the issue onto a DBA for analysis with a different tool.
Pros:
- Advanced Checks with Recording Function: Allows for detailed checks by simulating actions like logging in and performing tasks, providing comprehensive insights beyond basic uptime monitoring.
- Page Load Performance Monitoring: Offers visibility into page load performance for each action, enhancing alerting capabilities.
- Easy Installation and Configuration: Simplifies the process of installing agents and configuring settings, ensuring smooth setup.
- Accurate Alarms and Real-Time Alerts: Provides precise alarms and timely alerts, enhancing monitoring effectiveness with seamless synchronization between the web interface and the Android app.
Cons:
- Limited Features in Application Performance Monitoring: Some users noticed the lack of certain advanced features within application performance monitoring during complex monitoring requirements.
You can use a free version to monitor up to five servers. Site24x7 is available for a 30-day free trial. Those who decide not to subscribe at the end of the trial period automatically get switched over to the free version.
5. Dynatrace
Dynatrace is best known as a web application management service. MySQL databases are widely used as part of website services and Dynatrace can be used to monitor any MySQL implementation – not just those that are part of websites.
Key Features:
- Administrator Level Control: Provides administrators with comprehensive control over SQL monitoring settings and configurations, allowing them to customize the monitoring process according to their specific requirements.
- Alerts/Notifications: Whenever SQL performance issues or anomalies are detected, it will quickly send alerts and notifications to the admin to take immediate action.
- Application Management: Offers tools and functionalities for managing SQL databases within the context of the larger application ecosystem.
- Application-Level Analysis: Enables in-depth analysis of SQL performance at the application level, providing insights into how SQL queries and transactions impact overall application performance and user experience.
Why do we recommend it?
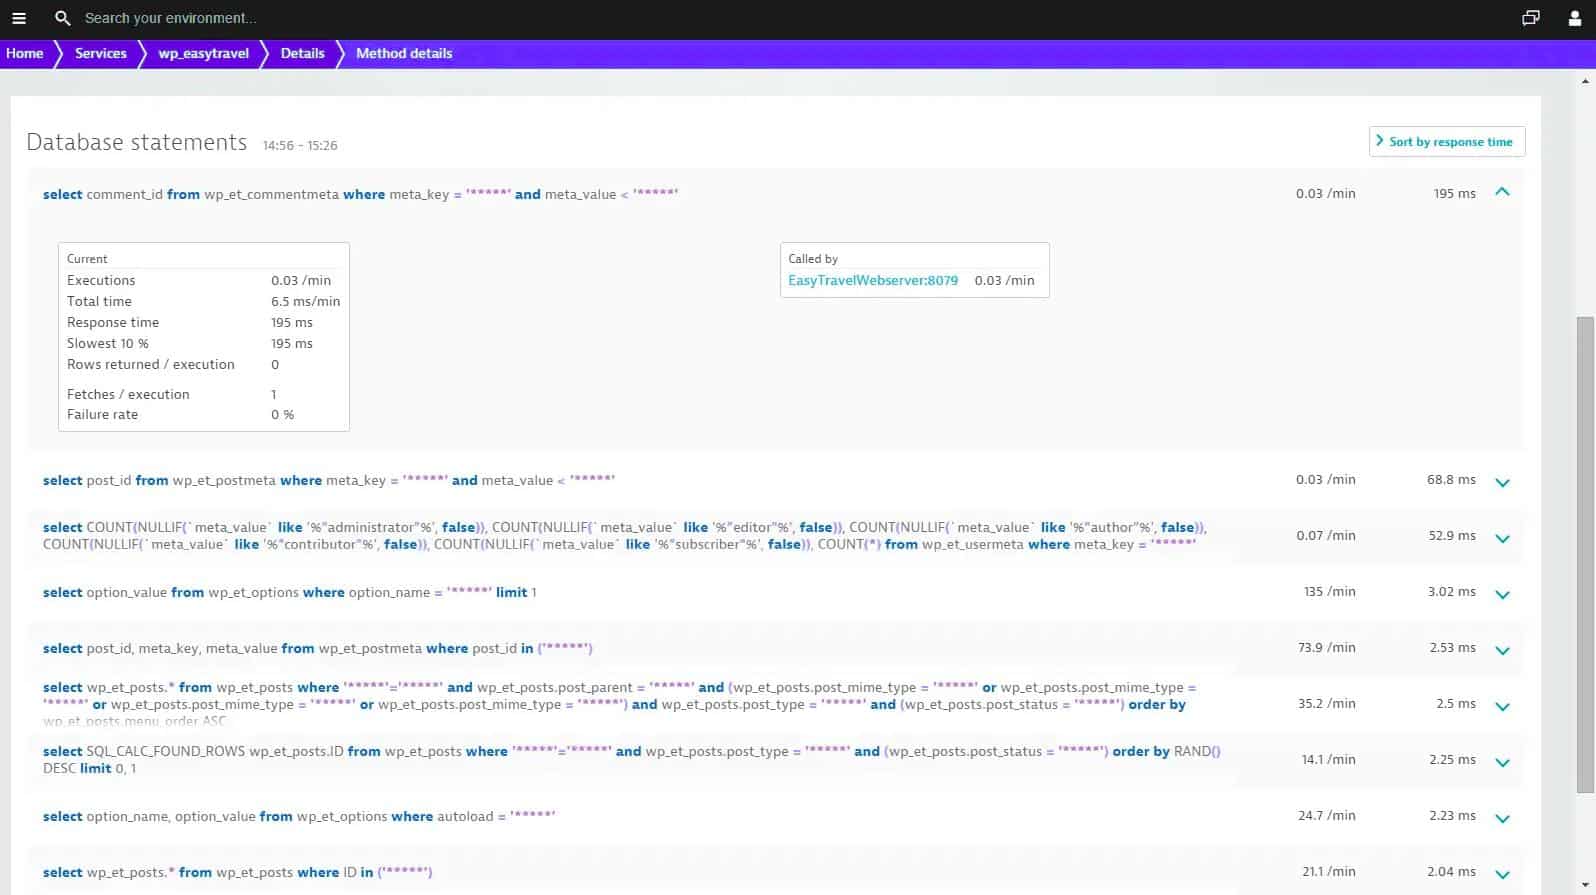
Dynatrace is a successful application monitoring system that is delivered from the cloud. This option provides a good mix of services that include both automated system performance monitoring and database tuning. This makes it a good competitor to the Datadog system. A useful feature of the Dynatrace system is its application discovery service. This will identify all of your MySQL instances and link them to the other systems that access them and the resources that support them.
A great feature of this MySQL monitoring tool is that it will seek out your database instances and map them before starting to monitor them. The monitoring service is constant, retrieving statistics to show live in the dashboard.

The metrics that the service measures include the standard checks on response times and resource usage. Additional performance analysis shows which applications use the database and how. Showing access to different objects and the types of transactions that occur. The tool can also analyze queries, producing recommendations for rewrites and remodeling of database objects.
The Dynatrace system is a cloud-based service, so it can be accessed from anywhere from any standard browser. The databases you look after can be on-site, in the cloud, or on the other side of the planet.
Who is it recommended for?
Dynatrace is very strong at monitoring applications and particularly good at tracking cloud-hosted Web applications. It is not so strong at monitoring networks. So, if you have your MySQL databases working on-premises and serving corporate applications, you would probably be better off with the Datadog, Site24x7, SolarWinds, and ManageEngine options on this list. However, if you are monitoring the execution of MySQL databases to support websites, this is a good choice.
Pros:
- Dependency Identification: This helps identify dependencies between different components in your system, allowing for a better understanding of how SQL queries interact with other parts of your application.
- User Impact Analysis: Provides insights into how SQL performance issues affect end-users, enabling prioritization of fixes based on their impact.
- Waterfall Analysis for Performance Insights: Offers a visual representation of the execution sequence of SQL queries and other application components, aiding in performance analysis and optimization.
- PurePath: Provides detailed, end-to-end visibility into SQL transactions, allowing for deep analysis of performance bottlenecks and optimization opportunities.
Cons:
- Limited Search and Filtering for SQL Errors: There may be limitations in searching and filtering SQL error results, which could make it challenging to quickly identify and resolve issues related to SQL errors, especially for beginners.
The service is charged on a subscription model and you can try it for free for 15 days.
6. LogicMonitor MySQL Monitoring
LogicMonitor is a cloud-based infrastructure monitoring tool. It covers networks, servers, and applications. Among the applications that this system can monitor are databases. The specific access and monitoring execution routines that it implements are tailored by integrations. These are vendor-specific plugins to the system and there is one for MySQL.
Key Features:
- Automatic Data Collection: Automatically detects running MySQL databases and monitors critical metrics such as transaction rates, blocks, and table scans, providing real-time insights into database performance.
- Easy Deployment: Provides granular performance monitoring for MySQL databases, regardless of how they’re deployed, whether on virtual machines in the data center or elsewhere, ensuring consistent monitoring across your infrastructure.
- Accurate Database Forecasting: Utilizes data forecasting to help identify seasonality and trends in database performance, allowing you to anticipate and address potential bottlenecks and incidents before they occur.
- Proactive Alerting: Uses advanced machine-learning algorithms to alert you to irregular behavior on your MySQL instances, recognize normal patterns, and adjust alerts accordingly.
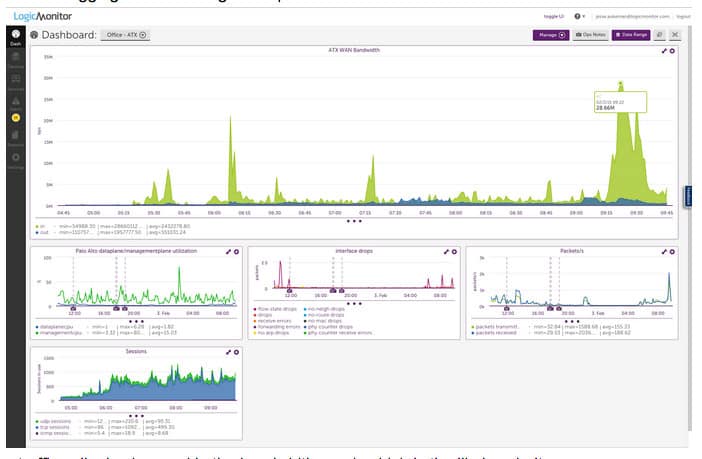
Why do we recommend it?
LogicMonitor MySQL Monitoring is a very similar platform to the Dynatrace system. This is a cloud-based service that is very good at monitoring MySQL databases that are also cloud hosted and serve Web applications. This tool includes network traffic analysis services as well as application and server monitoring. So, it is a good alternative to Site24x7.
The capabilities of the service extend to cloud servers and services and web performance. So, it would be of particular interest to those who run MySQL databases to support a website.
Data gathering is performed by an agent that needs to be installed on the database’s host. However, all processing is performed on the LogicMonitor cloud servers, which is also the host for the system dashboard.

Who is it recommended for?
The LogicMonitor system is much stronger at application monitoring than server or network monitoring. It has a discovery service and will map application dependencies that run through your MySQL databases. This is a good choice for hybrid system monitoring.
Pros:
- Great Features and Flexibility: Offers a wide range of features and is flexible, allowing for easy identification of teams to engage during issues. Also provides Software as a Service (SaaS) options from preferred vendors.
- Complete Monitoring: Strong fault detection capabilities with quick alert issuance. Offers excellent customization options and adapts well to IT infrastructure needs.
- Severity Alert Grouping: Allows grouping of severity alerts for abnormalities, making it easier to manage and prioritize alerts effectively.
- Available Support: Provides support throughout the day, ensuring assistance is available whenever needed.
Cons:
- UI Changes with Updates: Many users noticed that UI got changed after updates, it requires some time to adjust and get used to the new layout or features.
The service is available in two plans, called Pro and Enterprise. Both plans include database monitoring as well as network and server monitoring. The plans both show live statuses and generate alerts when problems are detected. The system retains status readings for analysis – for one year with the Pro plan and for two years with the Enterprise plan. You can get a 14-day free trial of the LogicMonitor system.
7. Datadog MySQL Monitoring

Datadog is a cloud-based system monitoring and management service that is available in several modules. MySQL monitoring is implemented in the Datadog MySQL Monitoring service. This is a general application monitor that can be adapted by vendor-specific plugins, which are called “integrations.” There is a MySQL integration available that tailors the database monitoring functions of the MySQL Monitor.
Key Features:
- MYSQL and Queries Optimization: This includes identifying inefficient queries, analyzing query performance, and providing recommendations for optimization to improve database efficiency and overall performance.
- Database Key Metrics Monitoring: You can monitor key metrics related to MySQL databases such as CPU usage, memory usage, disk I/O, and query throughput.
- Smooth Deployment and Management: It offers easy integration with MySQL databases without any query or language to quickly set up monitoring and start collecting data without extensive configuration or setup time.
- End-to-End Traces: This allows users to trace queries from the application layer down to the database layer, providing visibility into query performance and latency across the entire application stack.
Why do we recommend it?
The Datadog MySQL Monitoring service is a great choice because it forms part of a platform of system monitoring and management tools, so you can integrate database monitoring or your MySQL instances into a full stack service, identifying the root cause of all performance issues.
The monitor makes constant checks on a large number of database statuses, including tablespace utilization, buffer space, and disk activity. The MySQL Monitoring tool also makes queries within the database to keep track of object quantities and table sizes. These tests are performed by a Datadog agent, which will install on Windows, macOS, and Linux. However, the processing of collected data is all performed on the Datadog servers.
The console for the MySQL monitoring tool is also hosted in the cloud, so it can be accessed from anywhere through any standard browser. The dashboard shows live statuses as attractive graphs and will also highlight conditions that have entered into a worrying performance zone.

Who is it recommended for?
This tool is particularly useful for DBAs who need to investigate the reasons for slow query response times. The service includes live activity tracking within the database that shows each transaction as it executes, while also showing server activity, so you can see whether locking or bad indexing is the cause of issues.
Pros:
- Troubleshoot MySQL Issues Faster: Datadog MySQL Monitoring enables users to quickly identify and resolve MySQL database issues, reducing downtime and improving overall application reliability.
- Optimize Database Performance: It helps users identify and address inefficiencies to ensure optimal database performance and scalability.
- Enhance App Reliability: By monitoring key metrics and performance indicators, Datadog MySQL Monitoring helps enhance application reliability and uptime, ensuring a seamless user experience.
- Collaboration Across Teams: It makes working with teams easier due to its good collaboration functionality. It provides visibility into MySQL database performance and issues.
Cons:
- Root Access Needed for Agent Installation: May need root access to install the monitoring agent, which can lead to security concerns for some users.
Datadog MySQL Monitoring is charged for by subscription per host per month or by the year. You can get a 14-day free trial of Datadog APM.
8. SolarWinds Database Performance Monitor

SolarWinds Database Performance Monitor is a SaaS system that can monitor a range of different DBMSs. The service is adapted by adding on integration to monitor a specific DBMS and there is one of these adaptations available to monitor MySQL databases.
Key Features:
- SaaS Platform with Web Interface: As its SAAS tool, it can be accessed through a web browser and used from anywhere with an internet connection.
- Multiple Configurations: You can customize it to suit your needs, whether you’re monitoring one database or many.
- Data Protection: It helps keep your data safe, meeting standards for protecting sensitive information and being compliant with SOC2 regulations.
- Real-Time and Historical Data: It provides both current and past information about your database performance, helping you understand trends and make informed decisions.
Why do we recommend it?
SolarWinds Database Performance Monitor is a similar package to the Idera system. This is an analysis system for databases and queries. By watching both the structures and the queries together, this system will identify whether queries are inefficient or the database structures and badly planned. It will let you optimize your database object to properly serve your queries.
The MySQL version of the Database Performance Monitor offers constant monitoring and also performance tuning and query development support. The monitor measures performance per query. The metrics that are tracked include latency, throughput, errors, warnings, index usage, and execution plans. The tool also examines the services that support the MySQL database, monitoring host statuses and database configuration issues, such as table sizes, memory usage, CPU utilization and availability, and I/O actions.

By covering both execution and configuration issues, the monitor is able to fully optimize the performance of any MySQL database anywhere. In total, the Database Performance Monitor tracks more than 10,000 metrics about each MySQL database implementation.
SolarWinds Database Performance Monitor includes the supervision of physical supporting services, the database environment, query execution, and query development. This set of monitoring processes provides a complete MySQL monitoring service that will enable DBAs to keep MySQL databases available and functioning at optimal speed. As a cloud-based system, the console can be accessed from anywhere over the internet and any database anywhere in the world can be included in the service for monitoring.
Who is it recommended for?
Unlike most SolarWinds products, the Database Performance Monitor is a cloud-based SaaS package. That makes this tool a low-maintenance system and would be ideal for companies that want to remain lean on hardware. This also makes it a better choice than Idera for cloud-only enterprises that develop their own databases. This system isn’t limited to working with MySQL. It will also analyze MariaDB, PostgreSQL, MongoDB, Redis, and a list of cloud-based database systems.
Pros:
- Drill-Down into Expensive Queries: Helps identify and analyze queries that are using a lot of resources, allowing you to optimize performance.
- Query Analysis: Provides insights into how queries are performing, helping you improve efficiency and speed.
- Resource Usage Monitoring: Keeps track of how your database resources are being used, helping you manage them more effectively.
- Index Advice: Offers recommendations for creating or optimizing indexes to improve database performance.
Cons:
- Lack of Backup Details: May not provide detailed information or tools for managing database backups, which could be a limitation for some users.
The SolarWinds Database Performance Monitor is a cloud-based service that is charged for by subscription. It is available for a 14-day free trial.
9. dbWatch
If you don’t want to switch from your current infrastructure monitoring system, then a specialized database monitor, such as dbWatch would be a good solution.
Key Features:
- dbWatch Control Center: Integrates all database management tasks into one platform and automates routine maintenance. It’s scalable and flexible for large enterprise environments.
- DBA Productivity: Empowers database administrators (DBAs) with proactive monitoring and management tools, improves risk management, and helps control resource usage, boosting productivity.
- Passive Database Monitoring: Enhances security and professionalism in managing databases with dbWatch Control Center in your toolkit.
- Operational Efficiency: Enables efficient management of complex database environments, catering to global enterprises and large healthcare organizations, among others.
Why do we recommend it?
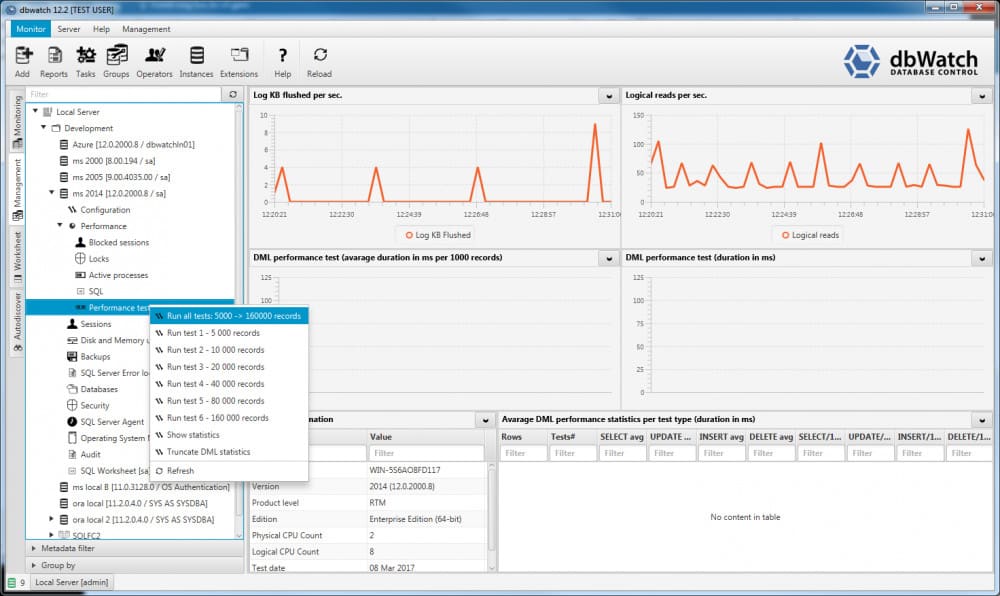
dbWatch is a standalone database monitoring and tuning package. This is a similar product to Idera with moth monitoring and analysis services. However, Idera is stronger on analysis and dbWatch is stronger on monitoring. As it doesn’t have related server and networking tools, the dbWatch team has a marketing disadvantage when competing with the big hitters on this list.
The dbWatch monitoring service is able to monitor many databases simultaneously and they don’t all have to be from the same vendor. MySQL is among the list of DBMSs that dbWatch can monitor. Others include SQL Server, Oracle, Sybase, MariaDB, and Postgres.

The monitor is a cloud-based service and it can monitor on-premises, remote, or cloud-based databases. The system covers live statuses, showing graphs and statistics in the web-based console. It is also able to analyze performance over time to recommend changes in structures and plans for resource expansion.
Who is it recommended for?
If you have a system monitoring package that isn’t very good at monitoring databases, then you would choose to use dbWatch. The database monitoring and management service works with MySQL, SQL Server, PostgreSQL, Oracle, and Sybase.
Pros:
- Multi-Site Support: Allows monitoring of SQL databases across multiple locations or sites, providing centralized management.
- Database Cluster Support: Supports monitoring of database clusters, ensuring continuous performance monitoring and management.
- Advanced Reports: Provides detailed and advanced reports on database performance, aiding in analysis and decision making.
- Database Autodiscovery: Automatically discovers and adds new databases to the monitoring system, simplifying setup and maintenance.
Cons:
- Terrific with Customization of Dashboard: While the system is great for customizing dashboards, this could mean it requires significant effort or expertise to set up according to specific needs.
There are three plan levels to dbWatch. The lowest of these, Essentials, doesn’t include database performance monitoring. The Professional, and Enterprise do include monitoring for MySQL plus other DBMSs. You can try out dbWatch Essentials risk-free on a 30-day free trial.
Choosing a MySQL monitoring tool
A good MySQL monitoring tool is able to make frequent tests on database response times, check on performance metrics, such as memory size and resource locks, watch the availability and speed of server resources, and analyze queries for improvement opportunities.
The main user of a MySQL monitoring tool is the Database Administrator (DBA). However, developers and service managers will also get important insights from a monitoring system. Many different roles in an organization will need to receive information about database performance for a range of reasons including SLA compliance proof and product developers wanting to know what capacity is available.
MySQL monitoring is not an optional task. It is essential to keep the business profitable.
MySQL monitoring FAQ
How do you check free space in a MySQL database?
Look in the information schema for a free space calculation:
SELECT table_schema “Data Base Name”,
sum( data_free )/ 1024 / 1024 “Free Space in MB”
FROM information_schema.TABLES
WHERE table_schema = DATABASE();


https://www.percona.com/software/database-tools/percona-monitoring-and-management — OpenSource based on VictoriaMetrics, Prometheus. For MySQL and other db.
Hi, Anna,
I like Percona, too. I didn’t know about it when I wrote this article but I have discovered it since. The system is particularly good for backup and managing replication or distributed databases. I mention Percona in 6 Best MongoDB Backup Tools and 5 Best PostgreSQL Backup Tools