
Here is our list of the best server and applications performance monitors available:
- Paessler PRTG Network Monitor (FREE TRIAL) An integrated network, server, and applications monitor. Runs on Windows Server. You can evaluate the software on a free 30-day trial.
- ManageEngine Applications Manager (FREE TRIAL) This package includes monitoring services for middleware, software, Web applications, mobile apps, and servers. Available for Windows Server, Linux, AWS, and Azure. Download a 30-day free trial.
- Site24x7 Server Monitoring (FREE TRIAL) A cloud-based infrastructure management tool that monitors networks, and servers, and applications. Access a 30-day free trial.
- Datadog Server & Applications Performance Monitoring Server and application performance monitoring for on-premises, remote and cloud-based servers from this SaaS platform.
- LibreNMS Free, open-source network monitoring system that can be customized.
- Atera A system monitoring service that covers servers, applications, and networks. Aimed at MSPs.
- SolarWinds Server & Application Monitor A premium server and application monitor that integrates on a common platform with other SolarWinds infrastructure management tools.
- Open NMS Free, open-source available in stable and Beta editions.
- P5 Integrated infrastructure monitoring system that includes server and applications management.
- Icinga Free, open-source network monitoring tool with community-written add-ons available.
- LogicMonitor An online service that is charged for by subscription. Includes process automation.
The importance of Server and Application monitoring tools
What would be a trivial bottleneck in a small home or office network can become a snowballing avalanche of outages, delays, and angry customers in an enterprise network.
Server and application performance monitoring software can range from home-brewed solutions thrown together with a few lines of code, all the way up to enterprise-scale implementations designed to be used across a global network for large service providers.
With large networks that have the potential for hundreds of thousands or even millions of requests each day, even the most minuscule delays can amount to hours of collectively lost time. Choosing the right tools for monitoring performance is vital.
Every administrator is going to have a slightly different take on what’s ideal for performance monitoring. Some will want to see every last detail of resource usage and optimize all their applications to fit that need. Others are purely interested in service response and uptime. Most will want a mix of both. None of these approaches are wrong, and finding the right server monitor that fits your needs is a huge part of network optimization.
What to look for in a server monitoring tool
Performance and resource usage of the application itself
- Good monitoring applications will use a minimum of resources to do their job. Even comprehensive networking suites usually place a strong focus on minimizing the amount of system and network resources they use to do their jobs. The best performance monitors will utilize just enough resources to effectively maintain close watch over the nodes they are assigned to.
Versatility
- Before jumping into any application, it’s good to know exactly what it needs to do in a given network. Some performance monitors are very basic, only tracking system resource usage on a server. Others are more robust and will track everything from bandwidth to system usage and perform in-depth analysis on a node-by-node basis. These systems often come in larger packages designed or intended to be used with other applications to create a full network management system. Deciding which features are needed on your network will help you narrow down which pieces of software will potentially work for you.
Presentation and ease of use
- Many performance monitoring applications come with detailed graphs, charts, and statistical information to help you better understand how your network is working. The way this information is displayed plays a big part in how useful it will ultimately be. The way this information is presented and organized is also a huge factor in how easy the software is to use. Being able to quickly identify which parts of a usage report are valuable to your network will increase efficiency and help you get more out of your software.
Deployment
- Does the software need to be installed on one centralized control location, or on every node it is monitoring? Is it a cloud-based service? Are agents easily installed if they need to be placed on multiple nodes throughout the network? Even small networks should take this into consideration, as ease of installation on a given device can vary widely from network to network.
Our methodology for selecting the best server and application performance monitors:
We choose the best server and application performance monitoring tools based on the following criteria:
- Performance and Resource Monitoring Capabilities: We prioritize tools that offer comprehensive insights into server and application performance metrics, including CPU usage, memory consumption, disk activity, and network utilization.
- Real-time Data and Historical Analysis: The ability to monitor in real-time and access historical data for trend analysis and forecasting is crucial for identifying and addressing performance issues promptly.
- Alerting and Notification System: We look for systems with flexible and configurable alerting mechanisms that can notify administrators of performance anomalies and potential issues via various channels such as email, SMS, or integrations with third-party communication tools.
- Ease of Use and Configuration: The best tools are those that provide an intuitive user interface and straightforward setup processes, reducing the time to value and making it easier for teams to adopt and utilize the software.
- Integration and Extensibility: A tool’s ability to integrate with a wide range of environments, platforms, and other monitoring tools is key to providing a holistic view of application and server health within a complex IT ecosystem.
The best server and application performance monitoring tools
There is no “one size fits all” solution to server performance monitoring, so we’ve compiled a list that comprises a range of platforms and applications. This list includes everything from open-source, free solutions, to enterprise-grade paid implementations used by some of the biggest networking giants on the planet. Each has its own advantages and disadvantages, and the goal is to help find the right one that works for your network.
1. Paessler PRTG Network Monitor (FREE TRIAL)
Paessler PRTG Network Monitor is a highly customizable performance monitoring solution that extends its flexibility all the way down to its pricing system. With a freeware version offering up to 100 free “sensors,” this can be a good option for networks that will scale over time without breaking the bank.
Key Features:
- Customizable Monitoring Solution: Enables users to tailor their monitoring setup by selecting from a vast array of available sensors.
- Comprehensive Hardware Inventory: Automatically generates an inventory of all networked hardware, aiding in asset management.
- Server Availability Tracking: Monitors server resources to ensure high availability and performance.
- Flexible Application Sensors: Offers a wide selection of sensors for monitoring various applications, providing versatility in usage.
Why do we recommend it?
Paessler PRTG Network Monitor does a lot more than monitor networks. It can monitor servers, applications, services, and cloud platforms. The extent of this package is up to you because the software for the tool is a bundle of sensors. You activate those that you need, according to the applications that you intend to monitor.
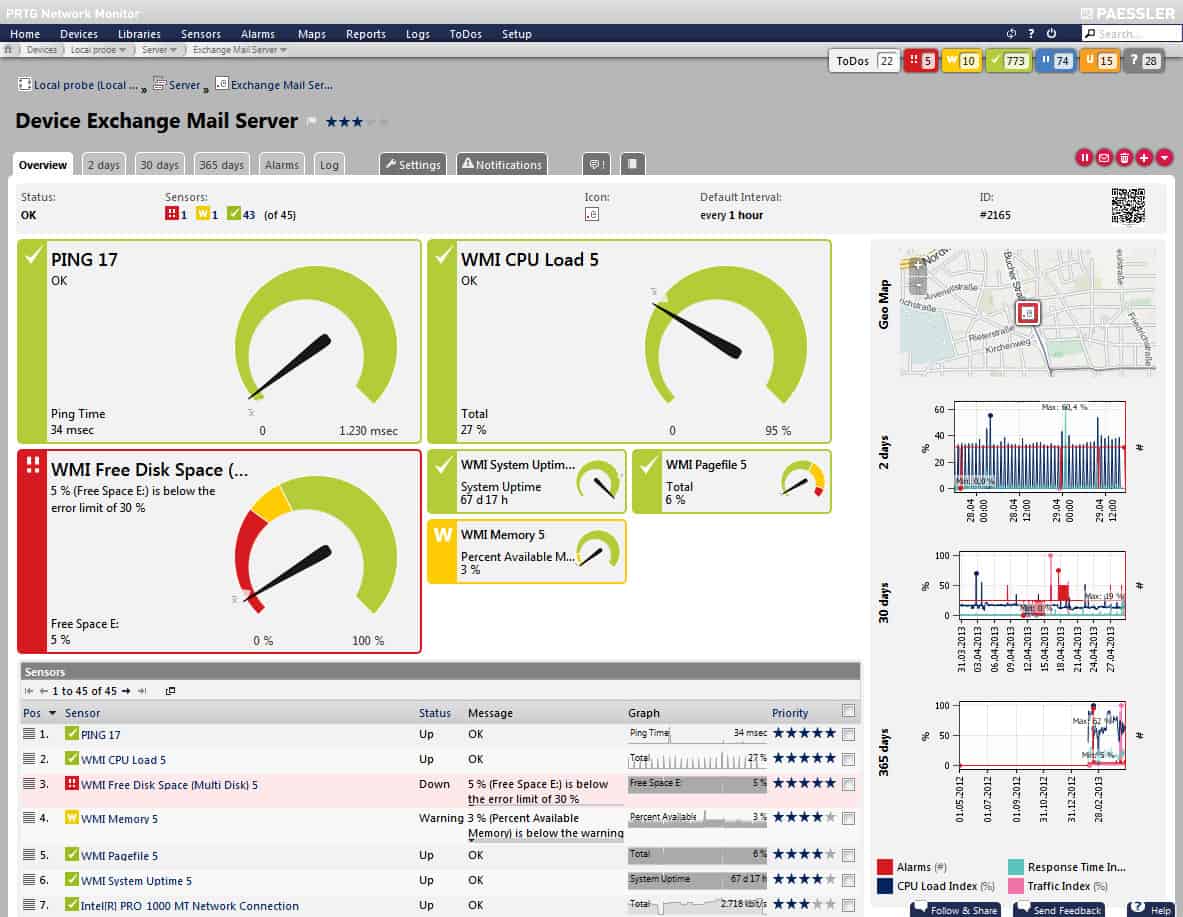
Each monitored resource on a given device is considered a “sensor.” As an example, monitoring the CPU usage on a server would be a single sensor. PRTG estimates that most devices would require anywhere from four to seven sensors each, so even its freeware version can work for small- to medium-sized networks.
Automatic device discovery enables fast deployment, and PRTG can monitor on-site or cloud-based resources. Customized alerts and bandwidth monitoring provide critical details on network and application slowdowns. A wide range of data presentation options help the analysis of key performance information in a way that makes sense to its users.
Who is it recommended for?
PRTG is a customizable bundle of monitoring systems and that makes it suitable for use by businesses of all sizes. The system provides a way to activate only those sensors for the technologies that you have, so you don’t end up paying for systems that you don’t need. If you only activate 100 sensors, the package is completely free to use.
Pros:
- Scalable Approach: Its sensor-based system allows for precise scaling, making it ideal for networks of any size, from small to large enterprises.
- Efficient Device Discovery: Features an autodiscovery option that quickly identifies new devices, keeping the network map current.
- User-Friendly Interface: The drag-and-drop editor simplifies the process of creating custom dashboards and reports.
- Diverse Alert Options: Supports multiple alert channels, including SMS, email, and third-party integrations, ensuring timely notifications.
- Cost-Effective: Offers a freeware version with up to 100 sensors, providing a budget-friendly option for smaller networks.
Cons:
- Learning Curve: The platform’s breadth of features and customization options may require a significant investment in time to fully master.
The software’s pricing is based on how many of these sensors will be deployed across a network, with different price tiers based on total sensors. You can download and evaluate PRTG Network Monitor on a free 30-day trial.
2. ManageEngine Applications Manager (FREE TRIAL)

ManageEngine Applications Manager is a software package that you can run on your own server or on your cloud account with AWS or Azure. This package provides monitoring for servers and applications. The tool will discover all applications and map their interdependencies.
Key Features:
- Server monitoring: Monitors on-premises server and cloud platforms
- Logical server monitoring: Web servers, email servers, etc
- Middleware monitoring: Tracks the performance of services, such as databases
Why do we recommend it?
ManageEngine Applications Manager is an extensive package that monitors all types of servers and all types of applications. Both of these terms are very broad: server means a physical computer and also a program that replies to requests; an application can be a protocol, a service, a piece of software, a mobile app, or a Web application.
The Applications Manager is easy to set up. You give it the address of your server and then the package scours that computer for processes and identifies what software launched them. The tool builds up a full inventory of all of the services on the server that are running and which software invoked them.
There are a number of server resources that you don’t need to guess will be operating: CPU, memory, network interfaces, and disks. The package records the tortola capacity of these services and then tracks their usage, calculating the remaining availability. The tool notes how much of each resource each process uses as it progresses. With this information, the Applications Manager starts to build up an application dependency map.
As time passes, the application dependency map identifies all of the systems that your company uses. You will need to register all of the servers that you use, including cloud accounts. In the case of microservices and Web applications, the tool is able to look at the external functions that your known applications rely on, so it is able to map out to programs that are running on the servers of other companies.
Who is it recommended for?
This package is available in a Free edition. That version has a lot of useful features that include physical and logical server monitoring, cloud account monitoring, and application dependency mapping. However, it is limited to monitoring five resources. Most businesses will need to look at one of the two paid editions.
Pros:
- Predictive alerts: Uses the application dependency map to calculate upcoming resource needs and identity shortages
- Cloud account monitoring: AWS, Azure, GCP, Oracle Cloud, OpenStack, and Microsoft 365
- Provides access to logs: Can integrate with log management for Syslog and Windows Events
Cons:
- High-level APM features cost extra: Tools such as distributed tracing and real-user monitoring are paid add-ons
ManageEngine Applications Manager has a functional overlap with the OpManager package from the same provider – that tool monitors network devices and servers. So, if you are only interested in server monitoring, ManageEngine presents you with a number of options. You can download the Applications Manager onto Windows Server or Linux. The package is also available as a service on AWS Marketplace and Azure Marketplace. Access a 30-day free trial to examine the Applications Manager.
3. Site24x7 Server Monitoring (FREE TRIAL)
Site24x7 is a cloud-based infrastructure monitor that is available in tailored packages for website monitoring, infrastructure monitoring, and application performance monitoring.
Key Features:
- Comprehensive Monitoring: Offers an all-in-one monitoring solution for networks, servers, and applications, ensuring a holistic view of IT infrastructure.
- Cloud and On-site Server Monitoring: Capable of monitoring both physical servers located on-site and virtual servers hosted on cloud platforms.
- Detailed Code Profiling: Analyzes application code to identify inefficiencies, supporting a range of programming languages for deep performance insights.
Why do we recommend it?
Site24x7 Server Monitoring is similar to the Datadog service because it is one module on a cloud platform of monitoring services. This tool has an associated application monitor that can be expanded by integrations and there is also an APM for Web applications. Packages also include network device monitoring and traffic analysis.
As this monitoring software is based in the cloud, you don’t need to install it on-site and so you don’t increase your server space requirements by using this system. You also don’t need to be in the same building as your servers to use 24×7 so it is cable of monitoring activity on remote sites and on cloud servers. The system will monitor servers running Windows, Windows Server, Linux, FreeBSD, and Mac OS. It can also operate with virtualizations created by Microsoft Hyper-V and VMware and it can also supervise Docker containers. Cloud server running Microsoft Azure and Amazon Web Services (AWS) can also be monitored by Site24x7.
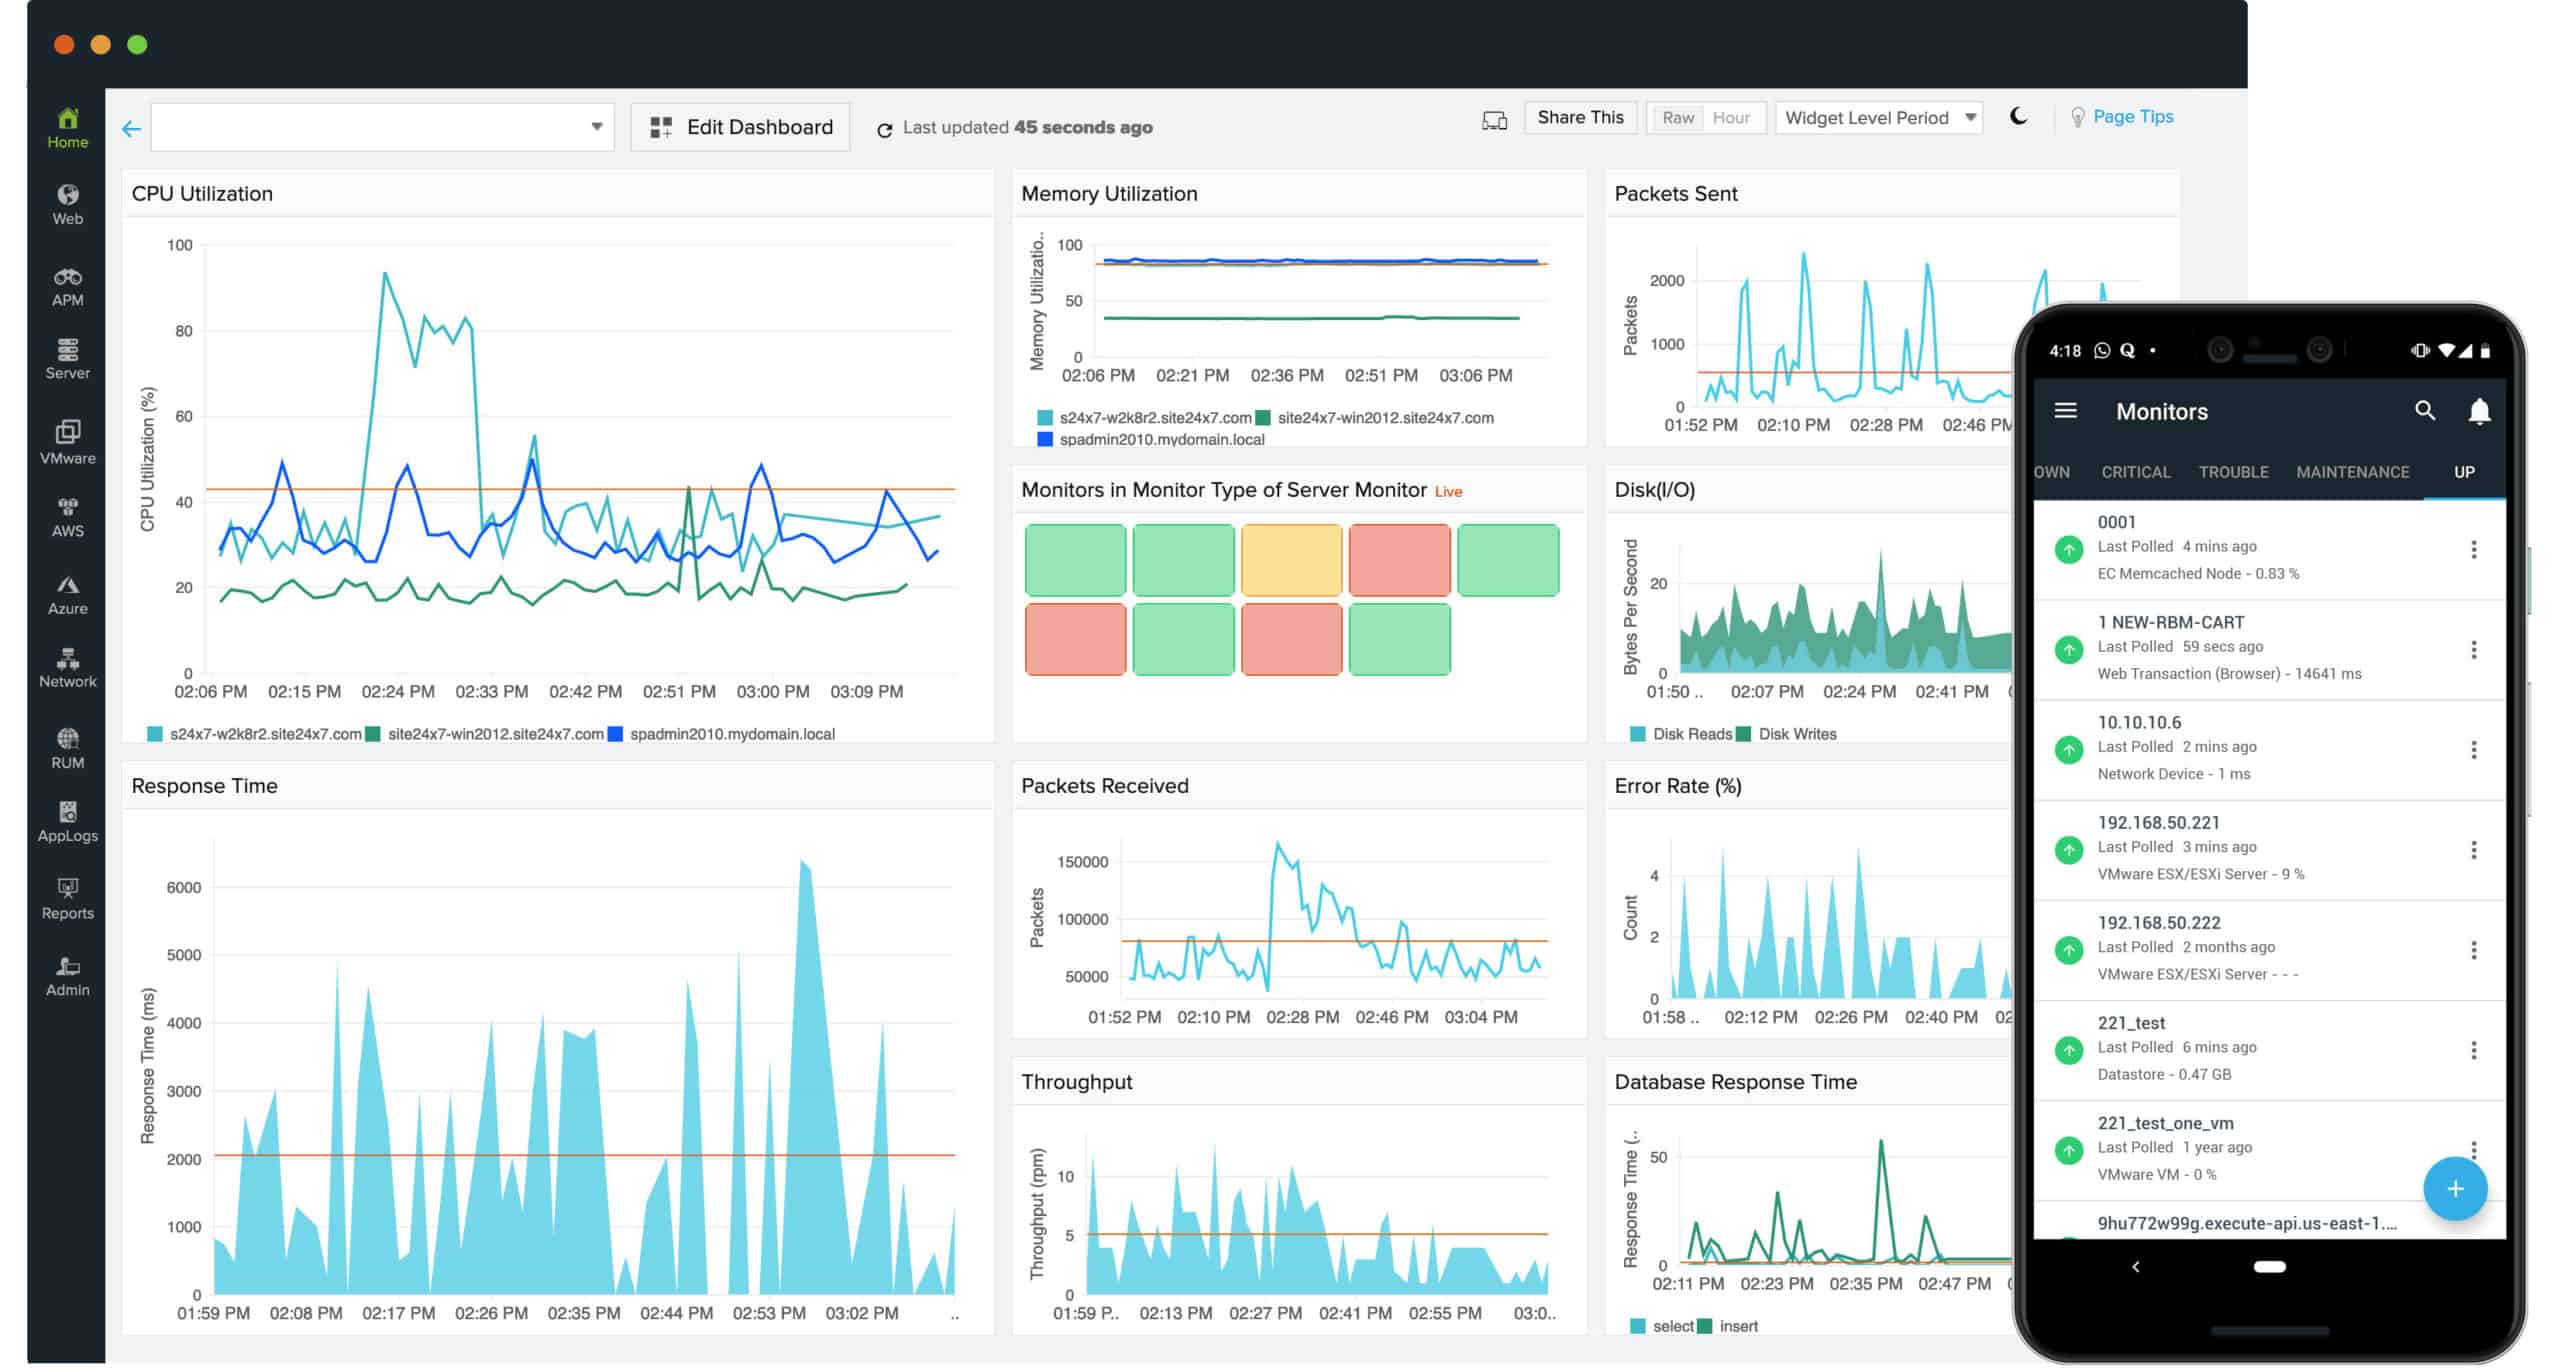
Server statuses monitored by Site24x7 include CPU performance, memory capacity, disk space usage, and network interface activity rates. It can integrate with Active Directory and manage Syslog and Windows Event log records.
The application monitor in Site24x7 is able to track the performance of databases, web servers, and email servers. It is also able to analyze the performance of all software running on a server, getting down to code level. The code analyzer looks for inefficient processes written in for Java, Node.js, Ruby on Rails, and PHP. Application performance alert thresholds are constantly revised by Site24x7 through an AI-based machine-learning process.
Who is it recommended for?
The Site24x7 system is a good choice for businesses of all sizes. It is a cloud-hosted service and its package are sized and priced to be accessible to small businesses. Larger companies pay an upgrade fee for more capacity. Editions include modules for full-stack monitoring.
Pros:
- Unified Monitoring Platform: Integrates server, network, and application monitoring into a single cloud-based solution, simplifying IT management.
- Automatic Device Discovery: Utilizes real-time data to automatically discover devices, creating dynamic charts, network maps, and inventories.
- User-Friendly Interface: Known for its ease of use, making it accessible for users of varying technical expertise to navigate and manage.
- Real User Monitoring: Bridges the gap between technical performance, user experience, and business outcomes, offering valuable insights for optimization.
- Flexible Pricing and Versions: Provides a freeware version for small-scale testing, with scalable packages to accommodate businesses of all sizes.
Cons:
- Learning Curve: Despite its user-friendly interface, the platform’s depth and breadth of features may necessitate a considerable learning period to master.
Site24x7 is charged for on a subscription basis, monthly or yearly. The Pro package includes both server and application monitoring and you can get a 30-day free trial.
4. Datadog Server & Applications Performance Monitoring

Datadog provides a SaaS system management platform, which includes server monitoring tools. The server supervision utilities are included in the Datadog Infrastructure module. This suite of tools can be used as a standalone service or combined with other infrastructure monitoring facilities, such as Datadog Network Performance.
Key Features:
- Cloud-Based SaaS: Delivers monitoring capabilities via a software-as-a-service model, eliminating the need for on-premises installation.
- Server Performance Insights: Offers visualizations of server capacity and utilization to help manage resources efficiently.
- Anomaly Detection: Utilizes advanced algorithms to identify unusual patterns that could indicate performance issues or security concerns.
Why do we recommend it?
Datadog server and application monitoring is implemented by a module called Infrastructure Monitoring. This package monitors servers and services, such as databases and Web servers, and standard software packages. However, for Web applications, you will need to look at the Application Performance Monitoring unit, which includes a code profiler.
The Infrastructure system is a subscription service and it is available in three plans – the cheapest of these is Free. The two paid plans are Pro, at $15 per host per month and Enterprise, which is priced at $23 per host per month.
All plans are hosted in the cloud and can monitor servers anywhere, even those that are also based in the cloud. The Free service includes all of the great server performance monitoring features of the paid version. However, it lacks the alerting system of the higher plans. The free version also isn’t able to integrate with other utilities and it doesn’t include container monitoring or outlier detection like the paid plans.
Datadog has some very advanced features that aren’t often encountered in server monitors. These are AI-based machine learning routines and they are only included with the Enterprise plan. The AI service, called Watchdog, will discover problems much faster than standard threshold-based performance monitors. The other AI feature of Datadog is called Correlations. It can identify the root cause of a problem, enabling your tech team to save time when they need to fix server performance problems quickly.
Who is it recommended for?
Datadog Infrastructure Monitoring is a cloud-based package and it can track systems that run on your own servers and on cloud platforms simultaneously, so this is a great monitoring option for companies that operate hybrid environments. There is a Free edition for small businesses that will monitor up to five hosts.
Pros:
- Intuitive Dashboards: Features customizable dashboards that simplify the monitoring process and enhance user experience.
- Comprehensive Monitoring Scope: Capable of monitoring servers located both on-premises and in the cloud, ideal for hybrid environments.
- Automatic Network Mapping: Employs autodiscovery to generate accurate network topology maps, keeping inventory up to date with minimal effort.
- Scalable Solution: Provides a flexible pricing model, making it suitable for businesses of all sizes, with options to scale monitoring services as needed.
- Real-Time Updates: Reflects changes within the network swiftly, offering a current view of the system’s status for effective management.
Cons:
- Trial Limitations: The trial period could be extended to offer potential users more time to explore the full range of features and capabilities.
Cost-saving assistants in the Datadog Infrastructure system include an automatically created host map, which can identify underutilized servers as well as show which servers are getting close to full capacity. The dashboard can be manipulated and customized through drag-and-drop methods. It works on a drill-down system, which makes it easy to spot where problems are occurring and then investigate quickly.
Datadog offers a 14-day free trial for both of its paid Infrastructure plans.
5. LibreNMS
A popular open-source NMS software, LibreNMS is the first entirely free entry on this list. It has a detailed and extensive knowledge base to help new users get accustomed to the software. Years of combined community collaboration and tinkering has led to numerous plugins, variations, and implementations of LibreNMS.
Key Features:
- Open-Source and Free: LibreNMS is a completely open-source network monitoring solution, providing a cost-effective option for businesses.
- Automatic Device Discovery: Features powerful device discovery capabilities, simplifying the process of adding new devices to the network monitor.
- Comprehensive Hardware Inventory: Keeps a detailed inventory of hardware components across the network, aiding in asset management.
Why do we recommend it?
LibreNMS is a free network monitoring package. This tool doesn’t have any application monitoring features but it will monitor servers through the Simple Network Management Protocol (SNMP). This package doesn’t provide full-stack monitoring but it is a competent tool for checking on server availability and resource utilization.
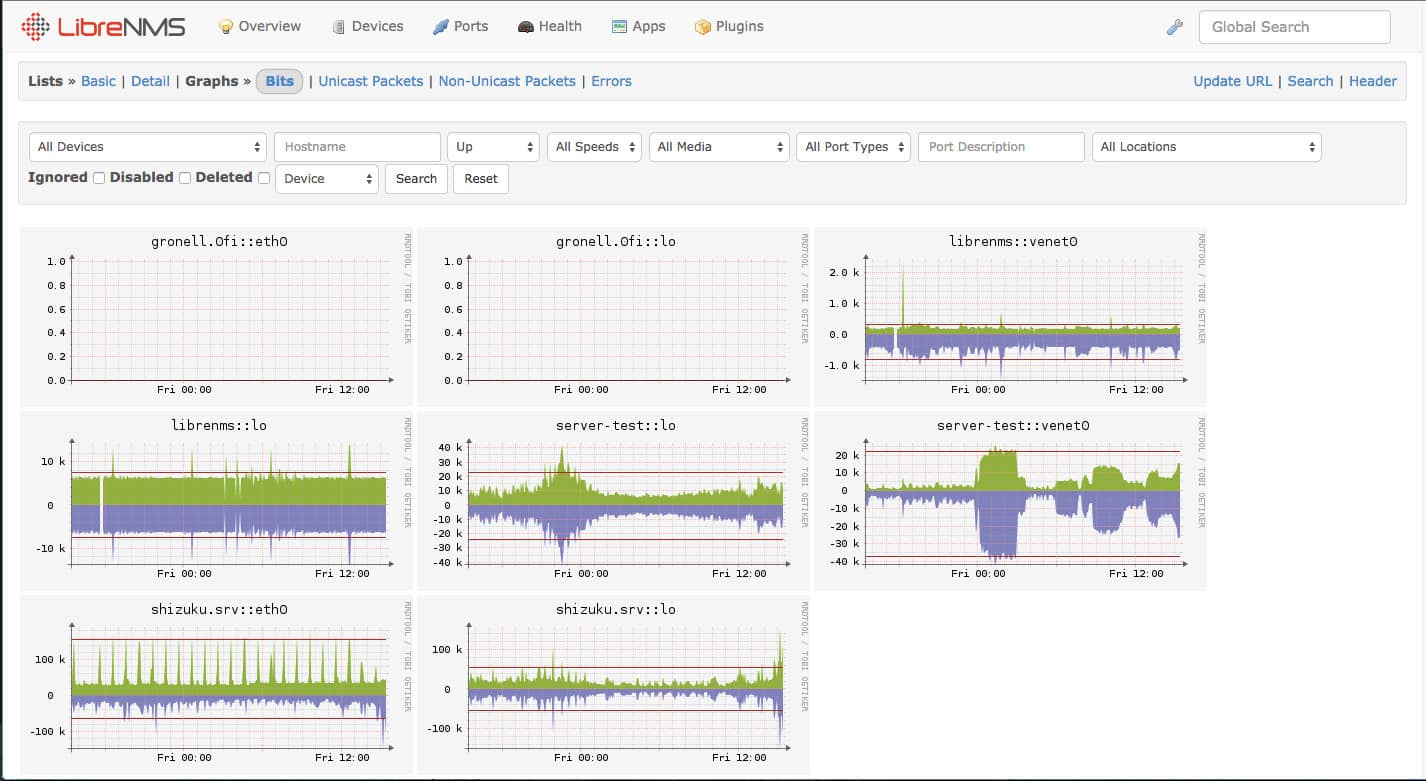
Automatic network discovery is supported by a huge range of plugins designed for device configuration, performance monitoring, and consistent performance. Oxidized, RANCID, and Nisen are just a few popular plugins that are easily paired with LibreNMS for a comprehensive network management system.
LibreNMS also supports access to the platform from a mobile device with an available Android and iOS app. This gives administrators control over their networks even when away from the office. Distributed polling gives LibreNMS the capability to scale and provide a solution even for large networks.
Who is it recommended for?
This package is a great choice for small businesses. There are a number of mid-sized businesses that use it as well. The team behind the tool doesn’t offer a professional support package, so large companies wouldn’t be interested in this tool. The software runs on Linux or Docker.
Pros:
- No Cost Involved: Being free, it allows even small businesses with tight budgets to utilize enterprise-grade network monitoring tools.
- Community-Driven Development: Benefits from a large community of users and developers, ensuring continuous improvement and support through plugins and integrations.
- Extensive Plugin Ecosystem: Offers a wide range of plugins for enhanced functionality, including device configuration and performance monitoring.
- Mobile Accessibility: Provides mobile applications for both Android and iOS, allowing administrators to monitor their networks on the go.
- Scalability: Supports distributed polling, making it capable of monitoring large networks effectively.
Cons:
- Support Limited to Community Forums: Lacks professional support services, with users mainly relying on community forums and documentation for help.
- Technical Complexity: May present a steep learning curve for users not familiar with open-source tools or network monitoring concepts.
- Customization Challenges: The user interface may not be as customizable or intuitive as those found in commercial alternatives.
As open-source software, LibreNMS has a huge amount of depth and flexibility, but most of its advantages will come from experienced users with the time to dive into the nitty-gritty insides of LibreNMS. While diving into LibreNMS’ codebase isn’t a requirement by any means, most of its strengths shine when it’s operated by individuals who are not afraid to get their hands dirty. Read the installation docs to get started.
See also: Application Mapping Tools
6. Atera

Atera is a system monitor that is designed for use by managed service providers (MSPs). This is a cloud-based platform that combines both remote monitoring and management (RMM) services and the professional services automation (PSA) functions that MSPs use to run their businesses.
Key Features:
- Tailored for MSPs and IT Departments: Offers versions specifically designed to meet the needs of managed service providers and internal IT teams.
- Comprehensive Software Management: Facilitates software deployment, updates, and patching to ensure systems are current and secure.
- Automated Server Monitoring: Provides continuous oversight of server performance, including CPU, memory, and connectivity.
Why do we recommend it?
Atera is a remote monitoring and management package that watches over networks, servers, and applications. The management functions in the package include an automated patch manager and standard maintenance task automation, such as temporary file clearouts. This RMM is unusual because it includes a ticketing systems and a user self-service portal.
Atera audits servers as soon as it is put into service for a new client. It monitors the CPU, memory, and ports of the server to ensure that they are not hitting their full capacity and impairing performance. The tool will also take an inventory of all of the software installed on servers and match those up with the licenses that the client possesses. The software inventory also supports software updates and system patch management.
The Atera monitors supervise the actions and performance of applications, such as database management systems and web and email servers. The combination of network, server, and application monitors make this tool an ideal system for keeping track of the performance of virtualizations. Atera is particularly adept and monitoring Hyper-V implementations.
The Atera platform is delivered from the cloud – the MSP doesn’t need to install any software. The technicians of the MSP access the Atera dashboard through a standard web browser or a special mobile app. As it is geared to monitoring remote systems, the Atera service is able to serve multi-site networks, and can also monitor cloud servers.
Who is it recommended for?
Atera is charged for on a subscription per technician and there is no minimum order quantity, so even if you are a sole technician, you get all of the functionality experienced by big organizations, while only paying for one seat. The RMM has versions for MSPs and IT departments.
Pros:
- Intuitive User Interface: Features a streamlined dashboard that simplifies monitoring and management tasks, making critical metrics easily accessible.
- Versatile Pricing Structure: Adopts a per-technician pricing model, making it an economical choice for businesses of any size, from solo operators to large teams.
- Integrated Professional Services Automation: Combines remote monitoring with PSA functionalities, enhancing efficiency for helpdesk operations and MSP service delivery.
- Effective SLA and Time Tracking: Includes tools for tracking service level agreements and maintenance tasks, optimizing service quality and accountability.
Cons:
- Limited Appeal for Smaller Organizations: While highly functional, some of the MSP-specific features may not be fully utilized by smaller businesses or solo practitioners.
Atera is a subscription service, charged for per technician per month. There is also a yearly subscription rate, which works out cheaper. You can get a 30-day free trial to test Atera before subscribing.
7. SolarWinds Server & Application Monitor
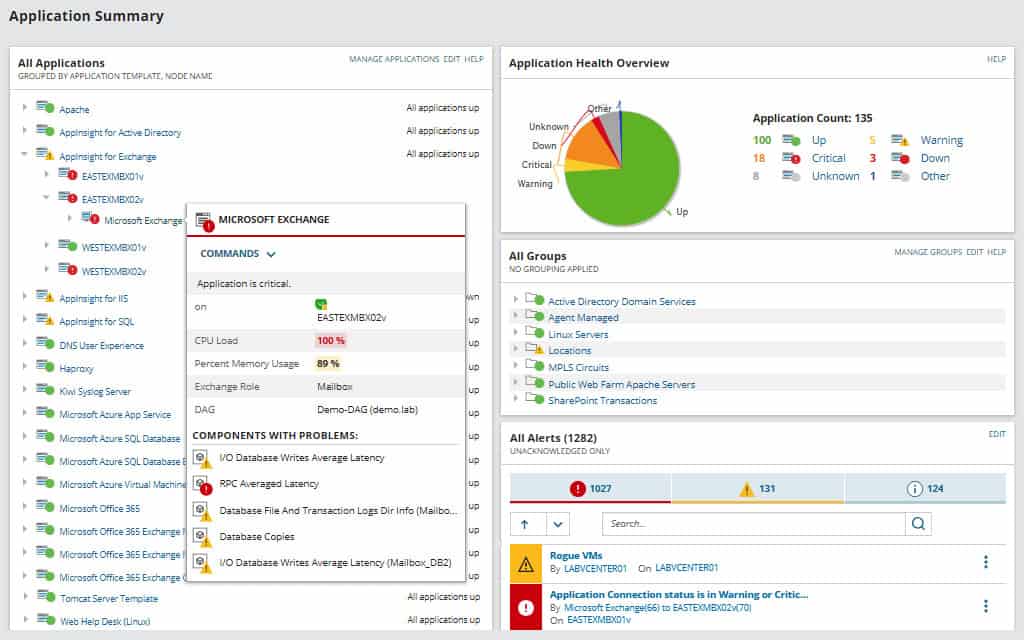
The first entry on this list, SolarWinds Server & Application Monitor, is a standalone product in the overarching Orion platform family developed by SolarWinds. An extremely versatile application monitor that is designed to scale with your network, Server & Application Monitor can be set up to be a one-stop-shop for a variety of networking needs.
Key Features:
- Comprehensive Server Monitoring: Offers detailed monitoring of on-site servers, ensuring their optimal performance and availability.
- Cloud Platform Oversight: Extends its monitoring capabilities to cloud environments, including AWS and Azure, for a unified view of infrastructure health.
- Application Dependency Mapping: Automatically maps the relationships between applications, aiding in understanding complex interdependencies.
- Flexible Configuration Controls: Allows for tailored monitoring settings to meet specific network and application requirements.
- Hardware Warranty Tracking: Keeps track of hardware warranties, ensuring timely renewals and replacements.
Why do we recommend it?
SolarWinds Server & Applications Monitor has a lot of capabilities that take a long time to explore. The headline functions of the system monitor servers and then detect applications. The package traces all applications and identifies their relationships to create an application dependency map. It also monitors cloud platforms.
Thanks to its quick and easy setup, Server & Application Monitor can be rapidly deployed to monitor large and complex network environments. SolarWinds provides an exhaustive list of application monitoring templates so that it can be tailored to fit almost any environment.
It allows for infrastructure monitoring on both AWS and Azure cloud-based IaaS configurations, giving administrators the control they need over their entire network, regardless of physical location or setup. Virtualization monitoring is also available, giving Server and Application Monitor the versatility it needs to fit into the vast majority of network and service designs.
Automatic asset discovery and an active inventory help make even complex networks a breeze to establish within the software, and SolarWinds product enables storage performance monitoring to help ensure smooth data access across large storage platforms. The software is able to help diagnose and identify the root cause of application problems for quick solutions to potential issues.
Who is it recommended for?
This is a package for large businesses. It is designed for companies that use applications rather than for those that build them. Its capabilities include Web application monitoring and it provides response time monitoring for systems, such as databases and Web servers. The package runs on Windows Server and is stronger at monitoring Microsoft systems.
Pros:
- Scalable Solution: Capable of adapting to the growing needs of large networks, making it suitable for enterprise environments.
- Dynamic Auto-Discovery: Automatically detects new devices on the network, simplifying the setup and maintenance of network topology and inventory.
- Advanced Alerting: Features sophisticated alert mechanisms that are both effective and user-friendly, minimizing alert fatigue.
Cons:
- Complexity for Non-Technical Users: While highly effective for IT professionals, its extensive features and capabilities may pose challenges for those without technical expertise.
As a part of the larger Orion platform, SolarWinds Server & Application Monitor can be combined with other products to give comprehensive management coverage over web performance, network, database, and virtualized resource configuration and monitoring. SolarWinds offer a free 30-day download for evaluation on their site.
8. OpenNMS
The second open-source entry on this list, OpenNMS is a network management software with a lot of utility and a dedicated user base. There are two branching distributions of OpenNMS, each with their own unique advantages.
Key Features:
- Dual Editions: Provides both Horizon and Meridian distributions, catering to different user needs and preferences.
- Comprehensive Monitoring: Capable of monitoring both servers and networks, ensuring broad oversight of IT infrastructure.
- Hardware Inventory Management: Automatically generates and maintains a detailed inventory of networked hardware assets.
Why do we recommend it?
OpenNMS is available in two editions: Horizon and Meridian. The Horizon package is a free Community Edition and the Meridian version is implemented as a cloud server fed by on-premises agents, called Minions, which is available for Linux or as a network appliance. The Horizon edition runs on Linux.
The first, Meridian, is the standard OpenNMS distribution. It is essentially the “stable release” of OpenNMS and features the most product and community support of the two releases. The majority of OpenNMS users will choose to run Meridian.
The second distribution is Horizon. It could loosely be described as a beta platform for new technologies, ideas, and implementations. There is significantly less documentation and community support for Horizon, as most users will be coding and documenting for Meridian. It exemplifies the leading edge of OpenNMS open-source framework.
OpenNMS features configurable service monitoring, performance management via a range of standard protocols, and allows for customized alerts. Automatic network discovery combined with topology discovery helps for quick and easy setup along with additional insights into the framework of its assigned network.
Who is it recommended for?
Small businesses will appreciate the OpenNMS Horizon version because it is free to use. However, large businesses often require professional support for their business insurance cover and so they would be more interested in OpenNMS Meridan. This package will monitor networks and servers but not applications.
Pros:
- Open-Source Flexibility: Offers the freedom to customize and extend the system with personalizations and add-ons.
- Extensive Documentation: Benefits from a wealth of user-generated documentation, facilitating the setup and customization process.
- Version Options: Users can choose between the stable, support-rich Meridian version or the cutting-edge Horizon edition for access to the latest features.
- Diverse Monitoring Capabilities: Supports a variety of monitoring tasks and protocols, with flexible alerting options to meet specific requirements.
Cons:
- Complex Setup: The initial setup and customization may be more involved compared to more streamlined, commercial alternatives.
- Community-Based Support: While there is a significant amount of support available through documents and forums, the absence of dedicated professional support can slow down issue resolution.
- Customization Required: Achieving the desired functionality and integration may require significant time investment and technical skill.
OpenNMS also integrates easily into existing infrastructure, with a significant amount of documentation from its community, to help with easy setup and integration into an existing platform. Read the installation docs to get started.
9. OP5 Monitor
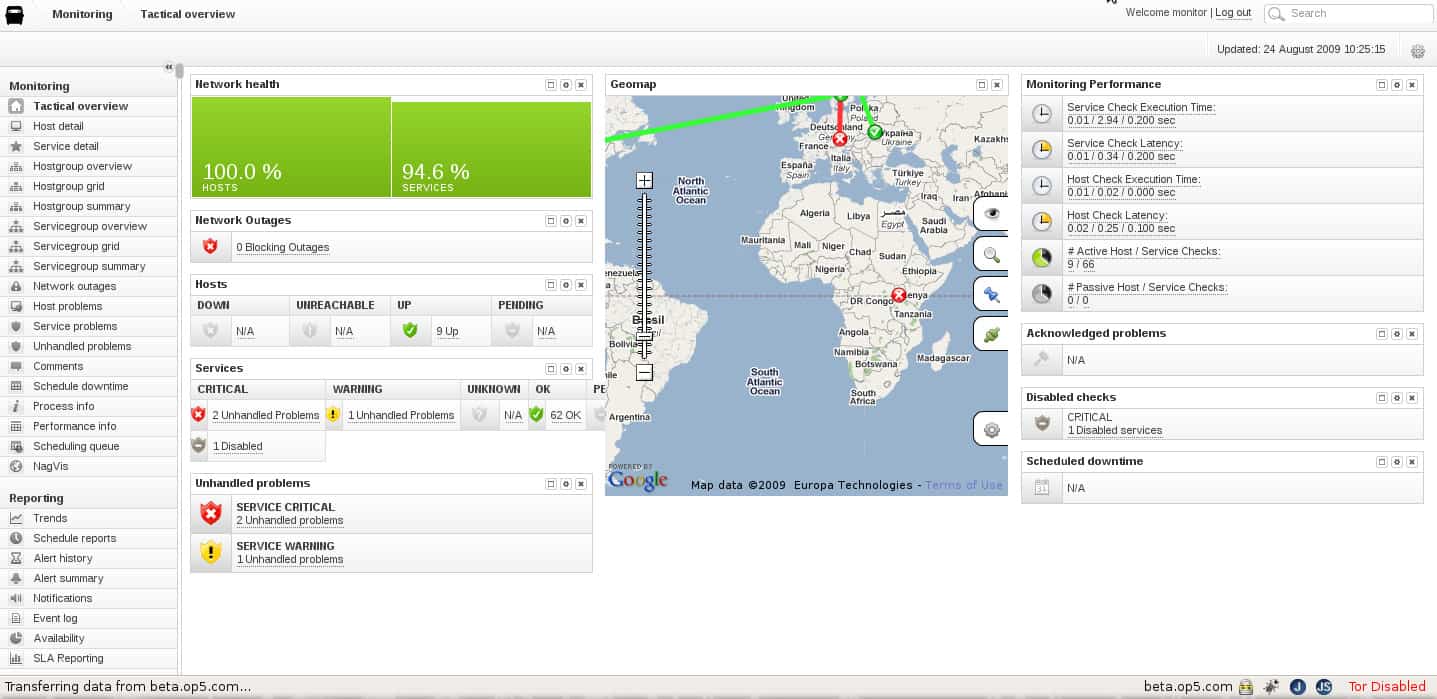
Designed specifically to be used as an enterprise-scale network performance monitoring solution, OP5 handles expansive networking environments extremely well. Everything from its dashboard, to its network mapping display, to the customization available within the software points to OP5’s intended usage as a service-provider scale monitoring platform.
Key Features:
- Enterprise-Scale Monitoring: Tailored for large, complex networking environments, offering comprehensive performance insights.
- IT Asset Tracking: Provides thorough monitoring of IT assets across on-site and cloud resources, ensuring complete visibility.
- Predictive Analytics: Utilizes AI-based techniques to forecast demand and potential issues, enabling proactive resource management.
Why do we recommend it?
ITRS OP5 Monitor is a full-stack monitoring package for networks, servers, cloud platforms, services, and applications. The tool uses SNMP to discover and map all devices connected to a network and it can track multiple sites, showing all equipment in different locations on a world map.
A great example of this is OP5’s macro view of monitored network nodes. An available map widget gives a real, global picture of how each system is interconnected based on geographic location.
OP5’s flexibility comes from its inclusion of widgets that can be added or removed from the central dashboard, giving administrators full control over the amount of information displayed. These widgets can be configured to display compartmentalized information to different departments to help personnel focus on critical data.
Visual reporting gives detailed information on potential bottlenecks or problem areas. These visual representations include graphs and charts to get a clear picture of when and where an issue could arise.
Who is it recommended for?
This is a great service for mid-sized businesses that have multiple sites and also use both on-premises and cloud-based resources. The cloud monitoring unit includes a cloud cost calculator. The package also has synthetic monitoring and real user monitoring for Website performance tracking.
Pros:
- Designed for Large Enterprises: Built to manage and monitor extensive network infrastructures, supporting expansive and multi-site environments.
- Customizable Dashboard: Features adaptable widgets that can be tailored to display essential data, facilitating focused monitoring for different teams.
- Advanced Visualization: Includes geolocation and dependency mapping for a clear, visual representation of network connectivity and performance issues.
- In-Depth Reporting: Offers visual reporting tools, including graphs and charts, for detailed analysis of network health and performance trends.
Cons:
- Pricing Transparency: Potential users must contact sales for pricing, which can complicate budget planning for interested organizations.
- Interface Complexity: While feature-rich, the user interface could benefit from simplification to enhance usability and accessibility for all users.
Additional redundancy monitoring helps further reinforce OP5’s design goal of being a one-stop-shop for enterprise-scale networking monitoring needs. Find out more about pricing on their download page.
10. Icinga 2
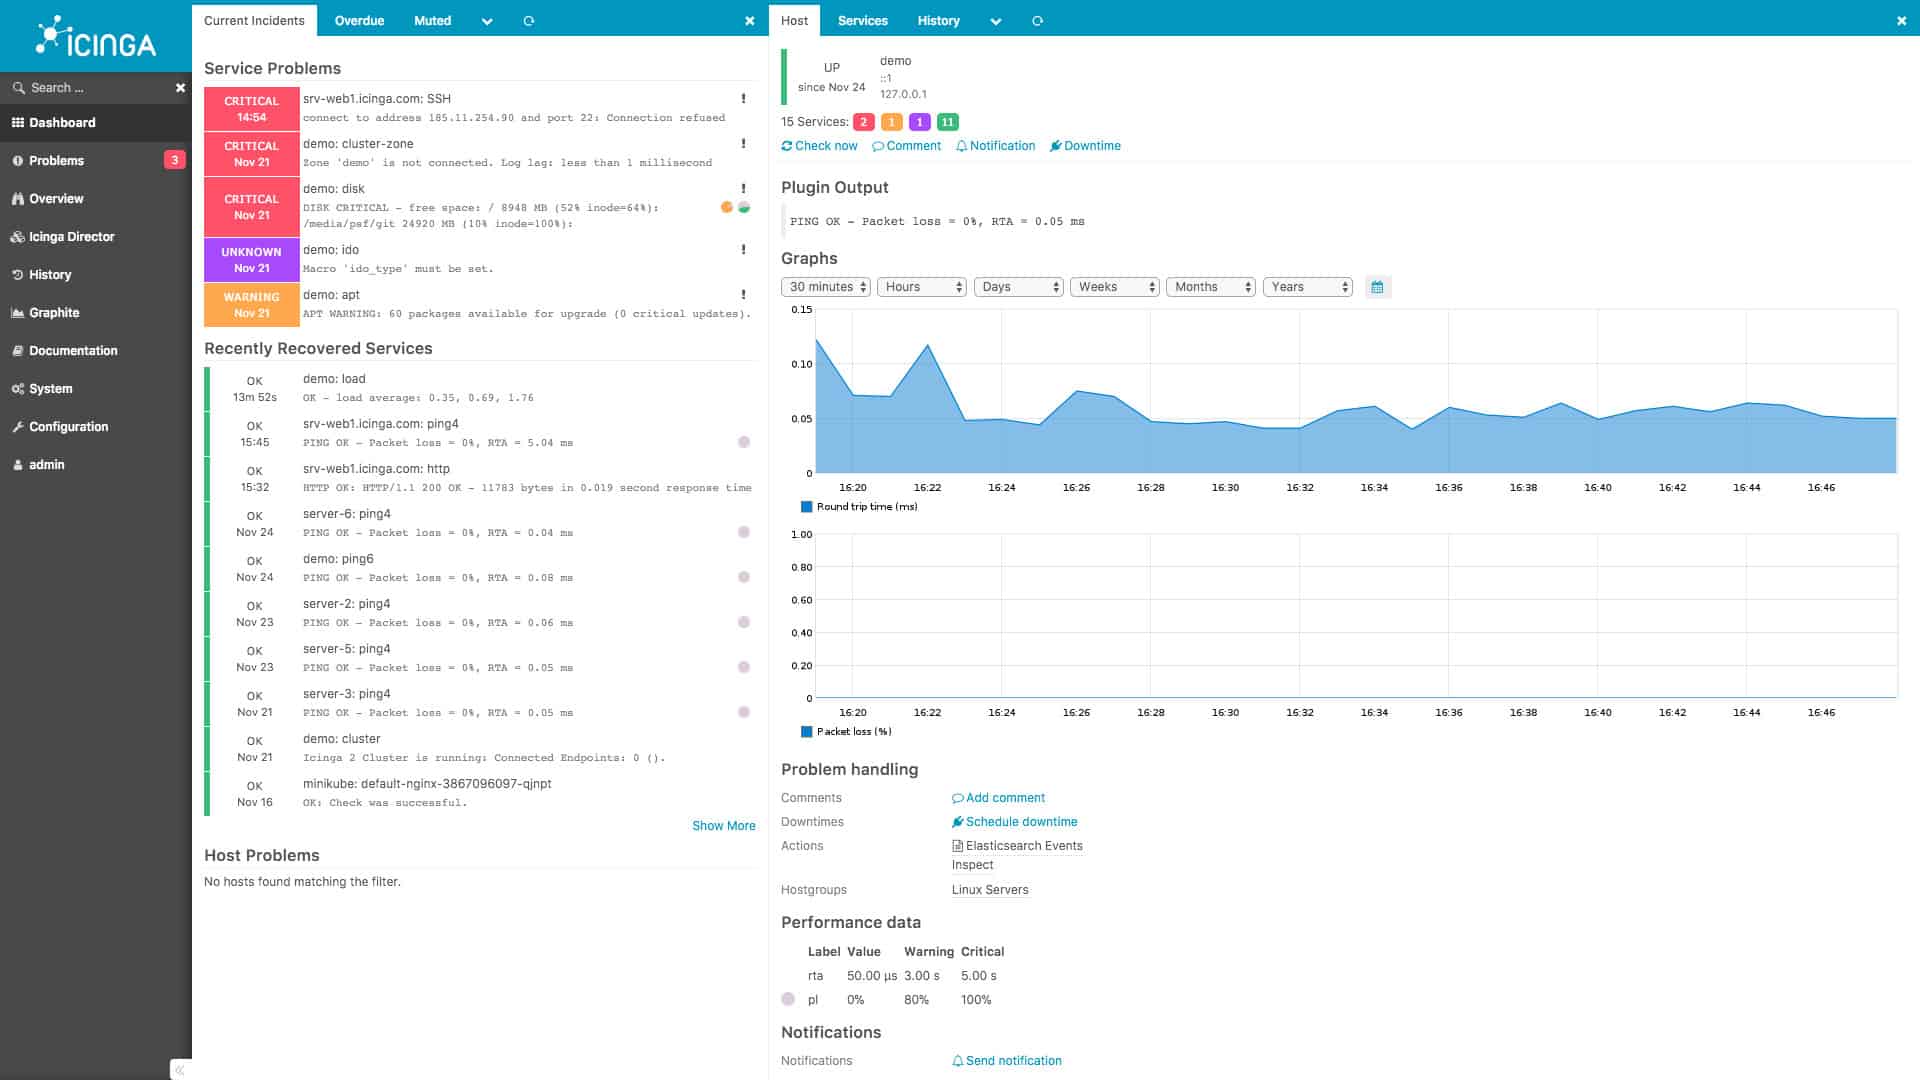
Another open-source performance monitoring tool, Icinga 2 is designed to provide robust performance monitoring while consuming a minimal amount of system resources. Available in a number of different variants and distributions, Icinga touts a huge amount of flexibility in an entirely free package.
Key Features:
- Open-Source Flexibility: Offers a highly customizable and adaptable monitoring solution that is completely free to use.
- Comprehensive Monitoring: Capable of monitoring networks, servers, and applications, including cloud-based resources and virtualizations.
- Extensive Plugin Library: Compatible with Nagios plugins, providing a vast range of additional functionalities and integrations.
Why do we recommend it?
Icinga 2 was created as a copy of Nagios. The breakaway group wanted to give Icinga all of the great functions of Nagios XI but keep it free, like Nagios Core. This design means that Icinga 2 is compatible with the large plug-in library of Nagios.
Able to be integrated with other popular open-source tools, Icinga 2 can comprise one part of a complete network performance monitoring solution that is scalable to almost any size. Dynamic customization within the software itself, along with rules-based performance configurations allows administrators to tweak Icinga’s installation to meet their needs.
Icinga 2 efficiently uses system resources to create a bare-bones resource footprint while still providing enterprise-grade performance monitoring and statistics. Detailed performance data help guide users to potential problem areas, and a comprehensive alert system warns administrators of impending disaster.
Who is it recommended for?
Because it is free and comprehensive, Icinga 2 is a good choice for small businesses. However, the package is also used by large organizations, including Adobe, Audi, and Vodafone. Big businesses can pay a subscription to get professional support. A big appeal of this tool is access to the free Nagios Exchange extensions library.
Pros:
- Cost-Effective: As a free, open-source tool, it provides a robust performance monitoring solution without any financial investment.
- Highly Customizable: Supports customization through both a graphical user interface and a domain-specific language, catering to different user preferences.
- Built-In Visualization: Includes native support for visual reporting, making it easier to analyze and interpret performance data.
- Modular Design: Allows users to add functionality as needed without bloating the core system, ensuring efficient operation.
- Cross-Platform Compatibility: Runs on both Linux and Windows, offering flexibility in deployment environments.
Cons:
- Community-Dependent Support: Lacks dedicated professional support in its free version, relying on community forums and documentation for troubleshooting.
- Technical Skill Requirement: Geared towards users with a technical background, possibly presenting a steep learning curve for beginners or those preferring more intuitive systems.
As an open-source tool, much of Icinga’s flexibility comes in the numerous variants and plugins that can be utilized with the application. Even without extensive tweaking and research, Icinga 2 is incredibly capable as an out-of-the-box performance monitoring solution, but open-source enthusiasts will welcome the additional versatility that design philosophy provides. Visit their repositories on Github for download and installation information.
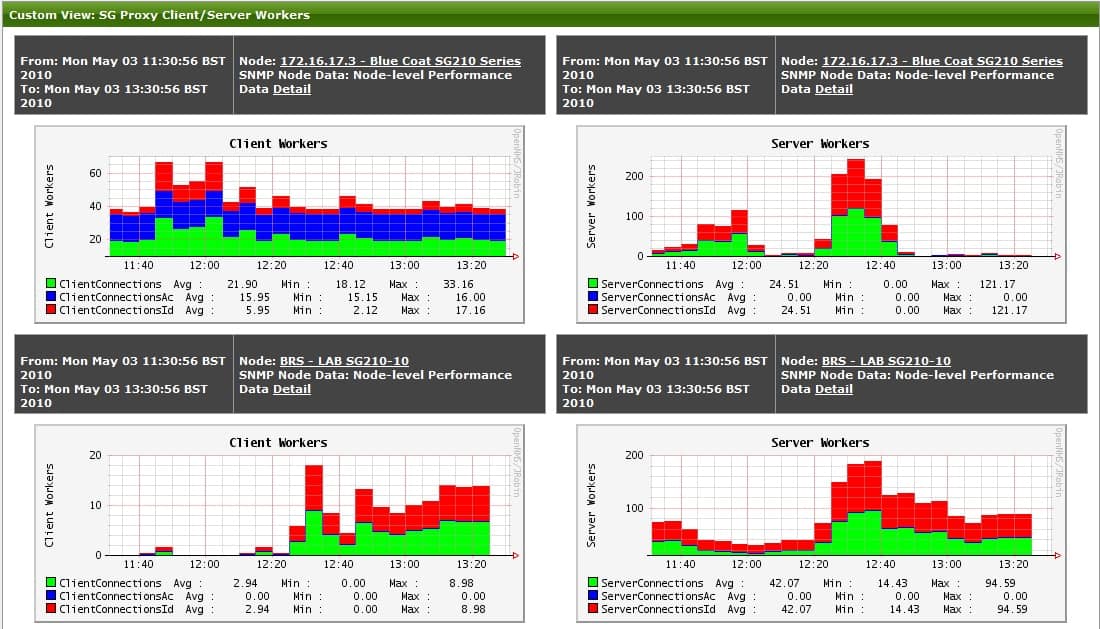
11. LogicMonitor
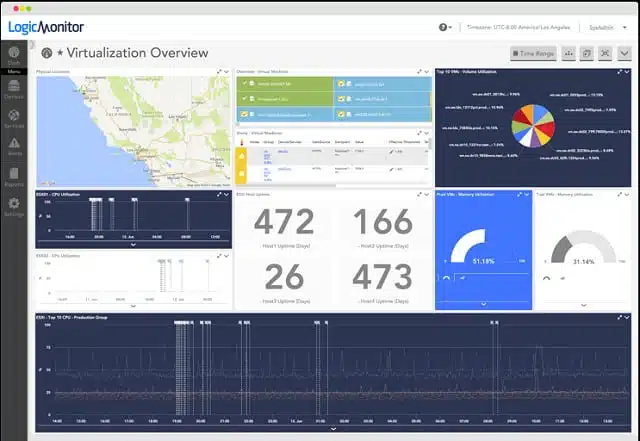
Another SaaS cloud-based performance monitoring solution, LogicMonitor gives the same flexible advantages to dynamic networking environments that can utilize a more mobile monitoring application. Able to be quickly deployed and take advantage of automated device discovery, LogicMonitor can analyze resource usage on both on-site and cloud-based infrastructure.
Key Features:
- Cloud-Based Deployment: Offers a scalable, cloud-based solution for monitoring network and infrastructure performance.
- Predictive Capacity Planning: Utilizes analytics to forecast capacity exhaustion, aiding in proactive resource management.
- Enhanced Database Monitoring: Provides in-depth monitoring capabilities for databases, ensuring optimal performance and availability.
Why do we recommend it?
LogicMonitor is a cloud-based network and infrastructure monitoring platform and its best feature is its attractive dashboard that crowds a lot of features on each page. This well-planed dashboard means that an administrator doesn’t have to keep switching pages to get a full system overview.
A customized dashboard can have information compartmentalized to provide information to groups or personnel that need it most. With a wide range of data presentation options, this information can be customized to quickly give important details on usage statistics, system loads, and application performance.
Who is it recommended for?
The LogicMonitor system is offered in three modules, which you can combine. The units are network, infrastructure, and cloud monitoring, so you can tailor your own package by selecting only those modules that you need. This is a particularly good service for businesses that use both cloud and on-premises systems.
Pros:
- Rapid Deployment and Discovery: Facilitates quick setup and automated device discovery, streamlining the monitoring process from the outset.
- Versatile Dashboard: Features a highly customizable dashboard that consolidates crucial metrics, reducing the need for page switching.
- Customizable Data Presentation: Allows for a wide array of data visualization options, catering to different user needs and preferences.
- Hybrid Cloud Monitoring: Capable of monitoring resources across both on-premises and cloud environments, making it suitable for hybrid infrastructures.
Cons:
- Limited Trial Duration: The 14-day trial period may not provide enough time for users to fully assess and explore all features.
Flexible alerting and the ability to monitor and analyze network configurations in real-time give additional utility to LogicMonitor. It can actively monitor configuration changes and look for performance impacts to help give ever-changing networks valuable insight into the overall health of the network. LogicMonitor offers a 14-day free trial on their website.
Choosing a Server and Applications monitoring tool
PRTG Network Monitor and ManageEngine Applications Manager are two of the highest-performance tools on this list. The variety of infrastructure they can monitor has made them two of the best performance monitoring tools in the world.
PRTG Network Monitor has its own unique sensors that you can download to monitor individual tools. For smaller organizations, PRTG Network Monitor is a particularly great choice. The reason is that there is a free version that supports up to 100 sensors. 100 sensors will cover many smaller networks without the hefty price tag that is associated with network monitoring products.

