
Docker has become one of the most widely-used containers in the world but it isn’t without its challenges.
The best Docker container monitoring tools help eliminate this lack of transparency. Monitoring services located somewhere between the host and the application layer is tricky without the right software.
Here is our list of the best Docker Container monitoring tools:
- Site24x7 Docker Monitoring (FREE TRIAL) A cloud-based monitoring system that has an Infrastructure module that covers servers and services, including Docker activity. Start a 30-day free trial.
- ManageEngine Applications Manager Gives you a dashboard view on the containers including metrics on CPU, disk usage, availability, and health.
- Dynatrace Easy to configure online service with autodiscovery on installation for containers and micro-services.
- CrowdStrike Falcon Cloud Workload Protection A security monitoring system for virtual services that includes container systems, such as Docker and Kubernetes.
- Datadog Docker Monitoring This cloud-based service is an infrastructure monitoring package that can be expanded by a plug-in to add Docker-specific performance tracking capabilities.
- SolarWinds Server & Application Monitor Industry stalwart runs on a Windows server that can measure Docker performance data like CPU, memory, uptime, and more.
- AppOptics Docker Monitoring with APM An application and infrastructure monitoring system that includes a Docker performance monitor.
- Sematext A cloud-based system monitoring server that tracks Docker and Kubernetes metrics and logs.
- Sumo Logic Docker compatible application and log monitoring software with good dashboard use of metrics and graphs.
- Splunk Obervability Infrastructure Monitoring This package from Splunk tracks the performance of the systems that support Web applications and cloud packages.
Before we look at the tools themselves we’re going to look at why you need to monitor Docker.
Why do I need to monitor Docker containers?
In just a matter of years, user experience expectations have risen to unprecedented levels. Users aren’t satisfied with anything less than applications that perform seamlessly. However, living up to expectations and delivering a high-quality user experience requires ongoing maintenance and performance management.
If you don’t have a Docker monitoring tool then you don’t have a point of reference to make sure that performance is up to scratch. In other words, you won’t be able to measure its performance. Without the necessary visibility, you won’t have the tools you need to stave off performance degradation and poor user experience.
In addition, with the necessary visibility, you will also be able to detect performance issues at the production level and benefit from long term capacity planning.
See also: How to create, host & manage a Docker network
The best Docker container monitoring tools
Our methodology for selecting a Docker container monitor
We reviewed the market for Docker container monitoring systems and analyzed tools based on the following criteria:
- The ability to collect activity data from within a Docker container
- Server resource monitoring
- Network performance logging
- Correlation between system resources and Docker activity
- The ability to monitor other container brands and virtual systems
- A free trial or a demo package that provides a way to try the system before buying
- Value for money from a monitoring tool that fully tracks Docker activity and is offered at a reasonable price
With these selection criteria in mind, we identified container monitors that can track the performance of a range of virtual systems, including Docker.
1. Site24x7 Docker Monitoring (FREE TRIAL)

Site24x7 is an online monitoring service for networks and websites. The Infrastructure plan from the service includes container monitoring that covers Docker activity. It doesn’t matter where your server is located or what operating system it has, Site24x7 Docker Monitoring will give you full control over its activities.
Key Features:
- Full Stack Observability: Live monitoring and historical analysis
- Hybrid Systems Monitoring: Monitors on-premises and cloud hosts
- Virtual System Monitoring: VMware, Hyper-V, Nutanix, Docker, and Kubernetes
Why do we recommend it?
Site24x7 Docker Monitoring is part of a cloud platform that offers full-stack monitoring packages. This system can track Docker on sites and on cloud platforms. The system also provides server, network, and cloud platform monitoring. Specific technologies can be monitored through the activation of add-ons.
Site24x7 tracks all Docker container activity. It collects metrics on each and shows that data in the service console. The dashboard doesn’t just monitor containers, it has the ability to control them with a Start/Stop facility. This system can track containers on cloud services, such as AWS EC2, Google Cloud Platform, and Azure as well as activities generated by your own in-house servers.
A Site24x7 Infrastructure account can get you full supervisory control over a range of networking and application services, not only Docker containers. It is also able to monitor hypervisor systems, including Hyper-V and VMWare.
As well as providing real-time feedback on Docker activity, the Site24x7 Infrastructure plan stores data for time series analysis.
Who is it recommended for?
Site24x7 is priced to be accessible to small businesses. The base packages of the platform don’t offer much capacity. However, larger businesses can pay for extra volume. It is easy to combine the monitoring of multiple sites in one account on the Site24x7 system. There is also a plan for MSPs.
Pros:
- Monitors Cloud-Based Docker Hosts: Also provides distributes tracing
- System Discovery: Identifies devices and software devices and build charts, network maps, and inventory reports
- Intuitive Platform: Easy to use
Cons:
- Can’t Subscribe to Just One Unit: Plans provide access to all of the modules on the platform
The Infrastructure plan has a complicated pricing structure. It is a subscription service with a base price of $7 per month. That package will monitor up to 10 servers and there is a list of add-on services available. You can get a 30-day free trial of Site24x7 Infrastructure.
2. ManageEngine Applications Manager (FREE TRIAL)
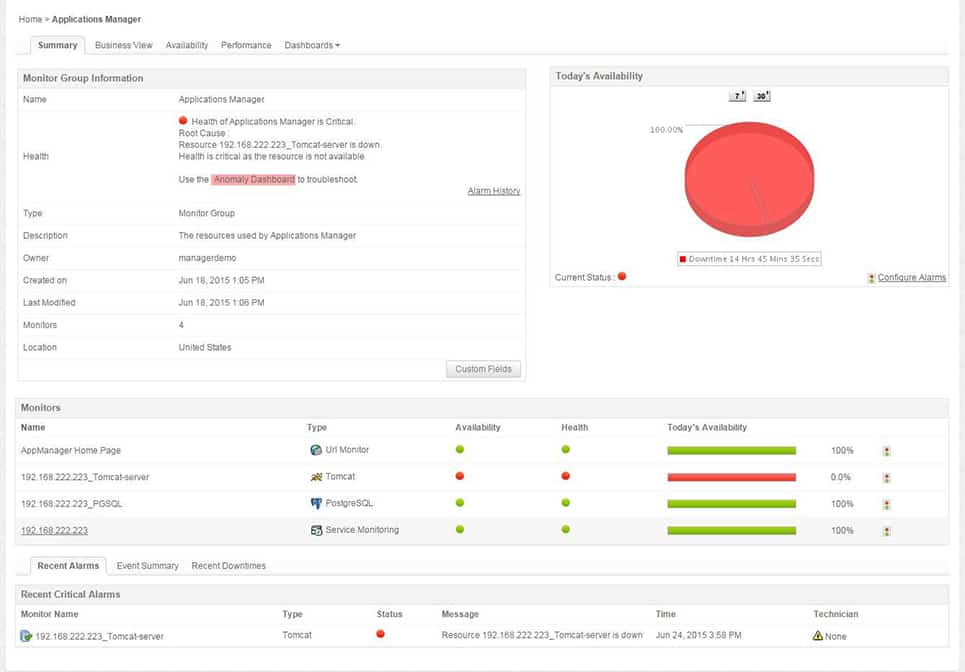
ManageEngine Applications Manager is an application monitor that can monitor Docker. The software provides information on the containers within a Docker host including metrics on CPU, disk usage, availability, and health. This information can be viewed in the form of graphs to monitor the Availability or Performance History of Docker over a predefined time period (these are color-coded to make them easier to read at a glance).
Key Features:
- Dependency Mapping: Identifies connections between applications and services
- Root Cause Analysis: Support by the application dependency map
- Server Resource Availability and Use Metrics: For memory, CPU, and disk monitoring
Why do we recommend it?
ManageEngine Applications Manager is a similar package to the SolarWinds Server & Application Monitor. This service discovers and maps all software, applications, services, and server resources and it is able to monitor Docker containers. The package installs on Windows Server or Linux and you can also get it as a service on AWS and Azure.
You can also generate detailed reports in ManageEngine Applications Manager. Reports include details on active files, inactive files memory paging, and cache. This data is useful for identifying how efficiently your resources are being allocated.
The software also includes an alerts system that generates notifications based on alert rules. You can configure alerts to be sent by email and SMS. You also automate certain actions such as starting, stopping, or restarting a container. Automation is useful for addressing issues that keep recurring.
Who is it recommended for?
ManageEngine is produced by the same company as Site24x7, so you will see some similarities between these two systems. There is a Free edition of this software that will monitor up to five hosts – the same as the free Sematext and Datadog plans. There are two paid plans.
Pros:
- Deployment Options: Runs on Windows Server, Linux, AWS, or Azure
- Offers Log Monitoring: Can track metrics like memory usage, disk IO, and cache status
- Can Automatically Detect in Real-Time: Databases, server hardware, and devices
Cons:
- Limited Free Edition: Only support five apps or servers
ManageEngine Applications Manager is available for free for monitoring up to five applications or servers. There are two paid versions you can purchase; Professional and Enterprise. The Professional Version ranges from $945 (£759) for 25 monitors up to $7,195 (£5,780) for 250 monitors. The Enterprise version ranges from $9,595 (£7,708) for 250 monitors up to $83,995 (£67,476) for 5000 monitors. You can download the 30-day free trial to get started.
3. Dynatrace
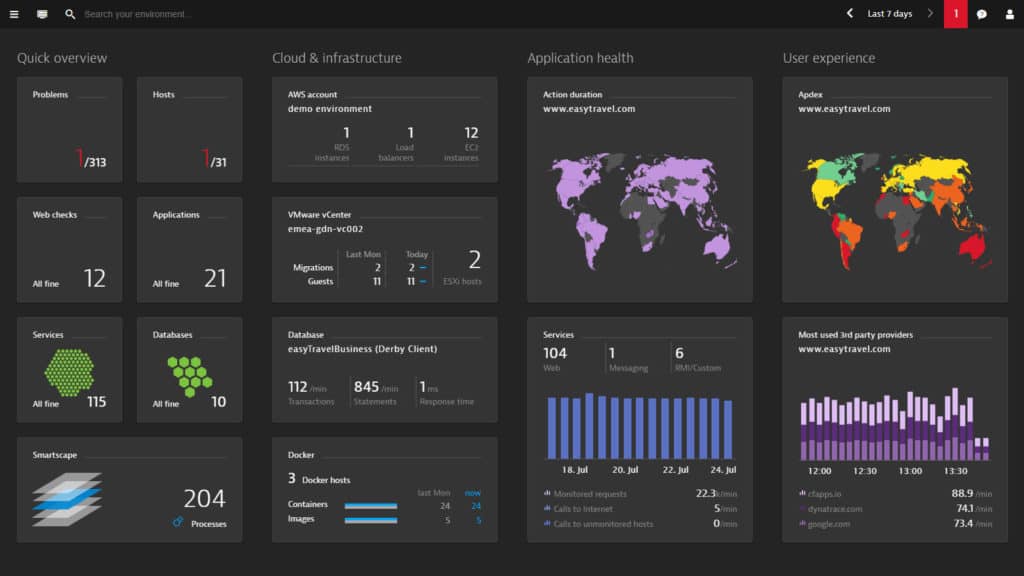
Dynatrace is an application and performance monitoring solution that’s easy to configure. All you need to begin is install Dynatrace on a Docker host. Once complete, the next step is for the program to automatically discover containers and micro-services. After the platform has finished discovering your infrastructure, you can view the containerized processes through the dashboard in real-time. The software can also monitor the performance of applications and microservices located inside the containers.
Key Features:
- Container Discovery: Also documents the microservices that they support
- Records Instances: Logging creation and destruction
- Application Dependency Mapping: Identifies links between applications and also supporting services
Why do we recommend it?
Dynatrace provides an Infrastructure Monitoring package that includes Docker activity tracking. Those containers can be run on your servers or on cloud accounts. The Dynatrace also offers an APM, which includes all of the services of the Infrastructure plan. That higher edition uses AI to predict server resource shortages.
Log analytics is another useful feature provided with Dynatrace. You can view all the log messages associated with an application inside one log file. Every log entry provides you with additional information that can be used to filter your search. For example, log entries will show the container image, ID that logged the message, and the output used.
Who is it recommended for?
The Infrastructure plan of Dynatrace is affordable and easy to set up. So, it will appeal to all sizes of businesses. The APM is aimed towards larger businesses and its AI processes wouldn’t be needed by straightforward enterprises that are limited to on-premises systems.
Pros:
- Log Analytics: Provides a second source of information on Docker activity
- Spots Potential Shortages: Correlates container activity with server resource availability
- Monitors Application Uptime: Also monitors user experience
Cons:
- Short Free Trial Period: The free trial only lasts 15 days
If you’re looking for a scalable Docker monitoring solution then Dynatrace is an excellent choice. In order to view the price of Dynatrace you’ll have to contact the company directly.
4. CrowdStrike Falcon Cloud Workload Protection

CrowdStrike Falcon Cloud Workload Protection offers monitoring of Docker and Kubernetes activity as well as security protection. The service includes a discovery module that can track down your Docker containers no matter where they are hosted. The Docker containers might be operating on your own servers, on AWS, on Azure, or on Google Cloud Platform. The system is able to unify all Docker monitoring activities across platforms.
Key Features:
- Live Activity Tracking and Security Monitoring: Also tracks Kubernetes
- Specializes in Protecting Cloud Systems: Including containers managed by Kubernetes
- Alerts for Performance Problems: Live attack warnings
Why do we recommend it?
The CrowdStrike Falcon Cloud Workload Protection Platform (CWPP) is a monitoring tool that provides both performance tracking and security monitoring for cloud services. This service provides monitoring for Docker and other containers as well. This system will also monitor Docker running on your servers.
The container identification and monitoring service is useful and you might end up thinking this is the sole purpose of the CrowdStrike service. However, this is just the beginning. While tracking containers, the service also assesses them. It will produce recommendations on how to tighten up the settings of your containers and their related management in Kubernetes. The system will also watch where they run and any attempts to access or interfere with them.
If an attack is launched against your Docker system or a specific container, the CrowdStrike system spots this unusual activity and begins a trace. It can chain back through command execution and running processes to identify the account from which they were launched and examine all other activity by that user. This quickly identifies a threat that can be isolated by shutting down the account and killing all of the processes that it launched. Reaction is instant and automated and everything is documented.
Who is it recommended for?
This cloud system is able to monitor on-premises Docker instances, but it is primarily designed for the protection of cloud-based assets. Therefore, it is recommended for businesses that manage cloud-based assets and particularly for those that provide their own software as SaaS packages.
Pros:
- A Discovery Service: Locates and maps all of your Docker containers
- Multiple Platform Scanning: AWS, Azure, and Google Cloud Platform
- Automated Threat Detection System: Threat actor tracing
Cons:
- Only Monitors Cloud Platform: Provides security monitoring rather than performance monitoring
You can evaluate CrowdStrike Falcon on a 15-day free trial.
5. Datadog Docker Monitoring

Datadog is an application and service monitoring platform that offers integration with Docker. The ‘cluster agent’ detects when containers are created and destroyed so that your monitoring environment keeps up to speed with your virtual environment. Metrics you can monitor include CPU, I/O, and memory. All of this information can be viewed in one pane of glass through the dashboard via a combination of numerical values and graphs. Datadog combines Docker monitoring with applications, server, and network monitoring to get a full-stack monitoring suite.
Key Features:
- Tracks Container Creation and Destruction: Stores activity metrics for historical analysis
- Server Resource Monitoring: Looks at the availability of the services that Docker needs in order to operate
- Alerts for Performance Problems: Can be sent as notifications by email, Slack, or PagerDuty
Why do we recommend it?
Datadog Docker Monitoring is a very close competitor to the Site24x7 system. This service is part of the Infrastructure module on the Datadog platform. This package can be expanded by integrations. However, Docker monitoring is part of the core package of the system. The Docker instances can be based on premises or on cloud systems.
Dashboards are drag-and-drop so they can be customized according to what you want to see. To help diagnose performance issues more easily, Datadog grants you visibility over application code performance. In addition, you can also view CPU and memory forecasts to help you implement capacity planning over the long term.
The alerts system included with the program is also of high quality. You can set alert thresholds to dictate when alerts are generated. To reduce the likelihood of false positives Datadog takes into account regular fluctuations that could trigger a false alarm. The advantage of this is that you only see legitimate alerts.
Who is it recommended for?
Datadog provides a Free edition of its Infrastructure Monitoring package, which will attract small businesses. This plan allows the monitoring of up to five hosts, so it offers the same service as the Sematext platform. The Free system doesn’t include access to the integration library.
Pros:
- Cloud-Based SaaS Product: Allows monitoring with no server deployments or onboarding costs
- Cloud Monitoring: Will monitor Docker containers hosted on cloud platforms
- High-Frequency Polling: Gather Docker activity data every 15 seconds
Cons:
- Short Trial Period: The free trial lasts 14 days
The Datadog platform is solid choice for a Docker container monitoring system because this package is able to watch over servers, networks, and applications, which gives it a view of all of the elements that contribute to a Docker container. The service can also create application dependency maps that identify which services support Docker and which reply on containers. With this information, you can quickly perform root cause analysis when any part of your IT infrastructure displays performance problems. Opt for the core Datadog Infrastructure package or set up a combined module package to keep your entire system running smoothly.
There are four versions of Datadog available to purchase: Infrastructure, APM, Log Management, and Synthetics. The cost of these ranges: Infrastructure is available in three plans that cost $0, $15 (£12), and $23 (£18.40) per host per month. The APM package is available for $31 (£24) per host per month and the log management service, called Ingest, is priced at $0.10 (£0.08) per GB per month. You can get the Synthetic Monitoring package for $5 (£4) per 10,000 API test runs or $12 (£9.60) per 1,000 browser-based tests. You can get started with a 14-day free trial.
6. SolarWinds Server & Application Monitor
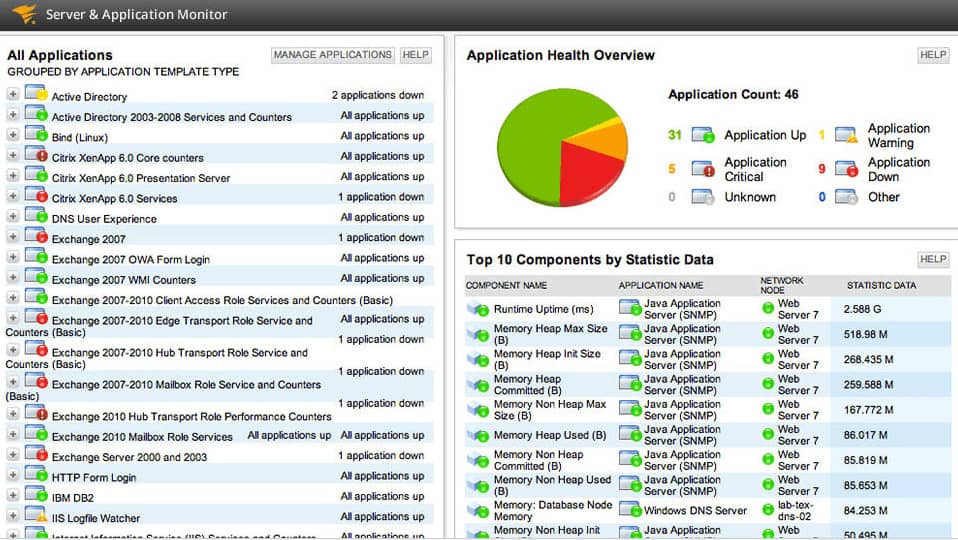
SolarWinds Server & Application Monitor is an application monitor that provides visibility into Docker. The program can measure Docker performance data such as CPU, memory, uptime, and more.
Key Features:
- Monitors a Range of Virtual Systems: Hyper-V, VMware, and Citrix virtualizations plus Docker containers
- Tracks Activity: Isolates metrics for containers that share resources
- Watches Resource Utilization: CPU, memory, and uptime
- Dependency Mapping: See how Docker links to other applications
- Root Cause Analysis: The real reason for Docker performance problems could be a related application or service
Why do we recommend it?
SolarWinds Server & Application Monitor tracks the performance of all assets from user-facing software through to servicer resources. This chain of dependencies includes the platforms that deliver applications and Docker is on that list. This is an on-premises package and it extends its monitoring service to cloud-based systems.
Performance information can be viewed on a dashboard that breaks down Container Details and Container Performance. To make things easier to monitor, SolarWinds Server & Application Monitor provides performance graphs so you can see how the CPU and Memory of Docker have changed over time.
Capacity planning is one of the most useful features included with SolarWinds Server & Application Monitor. The software uses your current usage data to forecast when the container’s capacity is going to expire in the future. For example, there is a CPU Capacity Forecast Chart so you know whether you have the resources to support future usage requirements.
Who is it recommended for?
This system is suitable for large businesses that operate assets both on-premises and on the cloud. The system can also be set up to monitor resources on multiple sites.
Pros:
- Useful for Monitoring Many Applications: Including email systems and Web servers
- Can Track Docker Hosted on the Cloud: AWS, Azure, and Rackspace
- Raises Alerts when Performance Deviates from the Baseline: Provides time to fix problems before they impact performance
- Customizable Console Screens: Uses drag and drop widgets
- Diagnostics for SLA Tracking: See delivery time statistics
Cons:
- Too Big for Small Businesses: Designed with large and enterprise networks in mind
As both a docker monitoring solution and application monitor, SolarWinds Server & Application Monitor provides you with everything you need to maintain your containerized infrastructure. The product starts at a price of $2,995 (£2,406). There is also a 30-day free trial.
7. AppOptics Docker Monitoring with APM (FREE TRIAL)
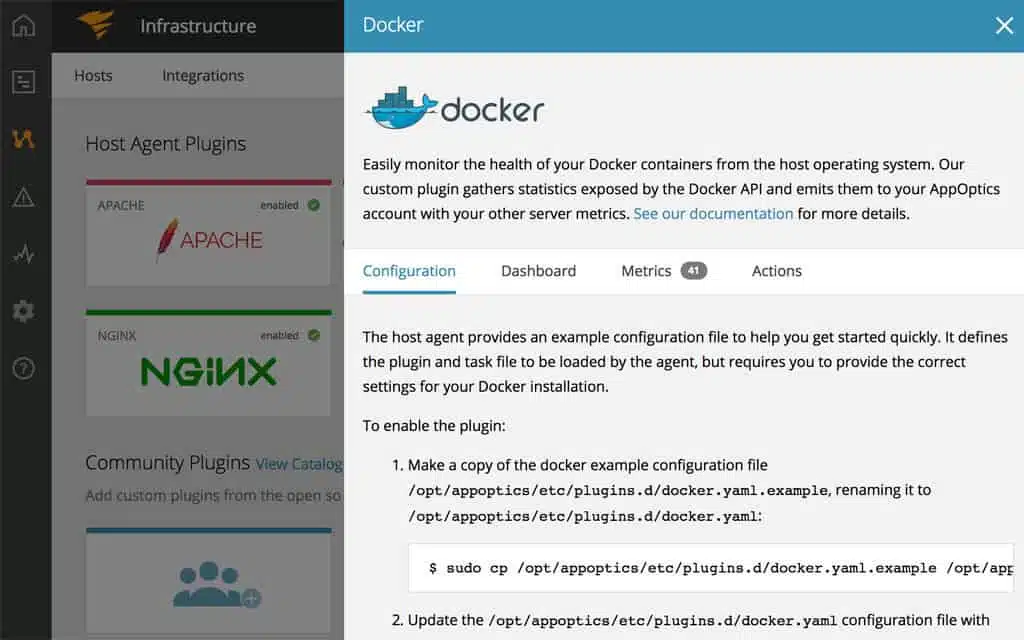
AppOptics is a cloud-based application monitoring service run by SolarWinds. The system was formed in 2017 through the combination of Librato and TraceView. AppOptics is marketed at two levels of service. The upper level of the service is called APM, which is an application performance monitor. The lower level plan of AppOptics is called AppOptics Infrastructure. The Infrastructure system is included in the APM plan. Docker monitoring is included in AppOptics Infrastructure.
Key Features:
- Dependency Mapping: Between applications and services
- Infrastructure Module: Includes Docker monitoring
- Correlates Activity with Resource Availability: Looks at each application’s resource usage
- Graphs for Container Activity: See performance over time
Why do we recommend it?
AppOptics Docker Monitoring with APM is the higher of two plans of the AppOptics service. SolarWinds has two packages that provide very similar services because the Server & Application Monitor covers much the same work as AppOptics. The lower Infrastructure edition provides Docker monitoring and the APM includes that plan.
The AppOptics system requires an agent program to be installed on the monitored system. This agent is called the SolarWinds Snap Agent. This agent is able to track resource usage by Docker containers through the inclusion of a Docket plug-in, which is available for free with AppOptics Infrastructure but needs to be enabled and configured.
The Docker plug-in reports on server statuses as they relate to docker activity. These factors include CPU usage and memory activity for each container and for Docker overall. The plug-in also reports on server I/O activity and network statistics, such as the number of packets sent from the server for a container and the number of packets lost.
If you just want to monitor Docker, then the AppOptics Infrastructure plan will be enough. However, if there are other applications that you feel could be delivered more efficiently, then you should check out AppOptics APM, which also gets you the Docker-monitoring Infrastructure package.
Who is it recommended for?
SolarWinds charges for AppOptics by subscription, which makes it more affordable than the Server & Applicaiton Monitor. This system also runs on Windows Server and will monitor cloud systems as well as on-premises assets. The Infrastructure plan is less than half the price of the APM.
Pros:
- Offers Great Visualizations: Displays live and historical health metrics and resource consumption
- Scalable: Built as a cloud service with subscription pricing per host
- Tracks All Major Resources: CPU, memory, and network usage
- Virtual System Monitoring via Plug-Ins: Can monitor Docker, AWS, Azure, and Hyper-V
Cons:
- No Kubernetes Monitoring: Would be useful for deployment monitoring
AppOptics is a subscription service with charges levied in advance. The AppOptics APM plan is more expensive than AppOptics Infrastructure. You can get a 14-day free trial of the full AppOptics APM service to see whether you need the full services of that package or could get all of your requirements fulfilled with just the Infrastructure module.
8. Sematext

Sematext is a cloud-based infrastructure monitoring service. It doesn’t only monitor cloud systems, it supports the monitoring and management of any network anywhere. Sematext deploys containers itself. The Sematext Agent uses containerization to not only collect statistics on Docker performance but also system-wide performance data.
Key Features:
- Part of an Infrastructure Monitoring Package: Good for hybrid environments
- Container Discovery: Populates the dashboard with metrics
- Log Message Collection: Blended with observation data
Why do we recommend it?
Sematext is a cloud-based system that is based around log management. All performance messages are, essentially, log messages and so the Sematext system can adapt its log starches to different monitoring purposes. One of the plans on the platform implements Infrastructure Monitoring that is able to track Docker performance.
It isn’t necessary to set up the service by listing the applications running in containers because the Sematext Agent will automatically find them.
The agent is able to record the host resource utilization of each Docker container. It details the CPU, memory, page swaps, disk I/O, and errors. The service also gathers data on the volume of network traffic generated by the active Docker containers.
A second Sematext process examines log files. This investigation agent is also Docker-based. As well as looking at the log files generated by Docker, this agent will collect information from Syslog, database systems, web servers, and other native logs.
The Sematext processor searches through collected logs and live performance metrics looking for errors and security breaches.
As a cloud-based system, the dashboard for Sematext can be accessed from anywhere through any standard browser.
Who is it recommended for?
The Sematext service can collect logs from any site or platform and it is able to track the activity of Docker as it delivers applications. There is a Free edition for small businesses that is limited to monitoring five hosts with three containers on each. Paid plans add capacity to that free tier.
Pros:
- Multi-Level Monitoring: Performance data on sites, services, and supporting infrastructure
- Threshold-Based Alerts: Ideal for maintaining SLAs
- Has a Free Edition: Monitors up to five hosts
Cons:
- No On-Premises Version: Only available on the cloud
As a cloud-based system, the dashboard for Sematext can be accessed from anywhere through any standard browser. The service is charged for by subscription with log monitoring levied at a monthly rate and live monitoring charged for per hour.
9. Sumo Logic
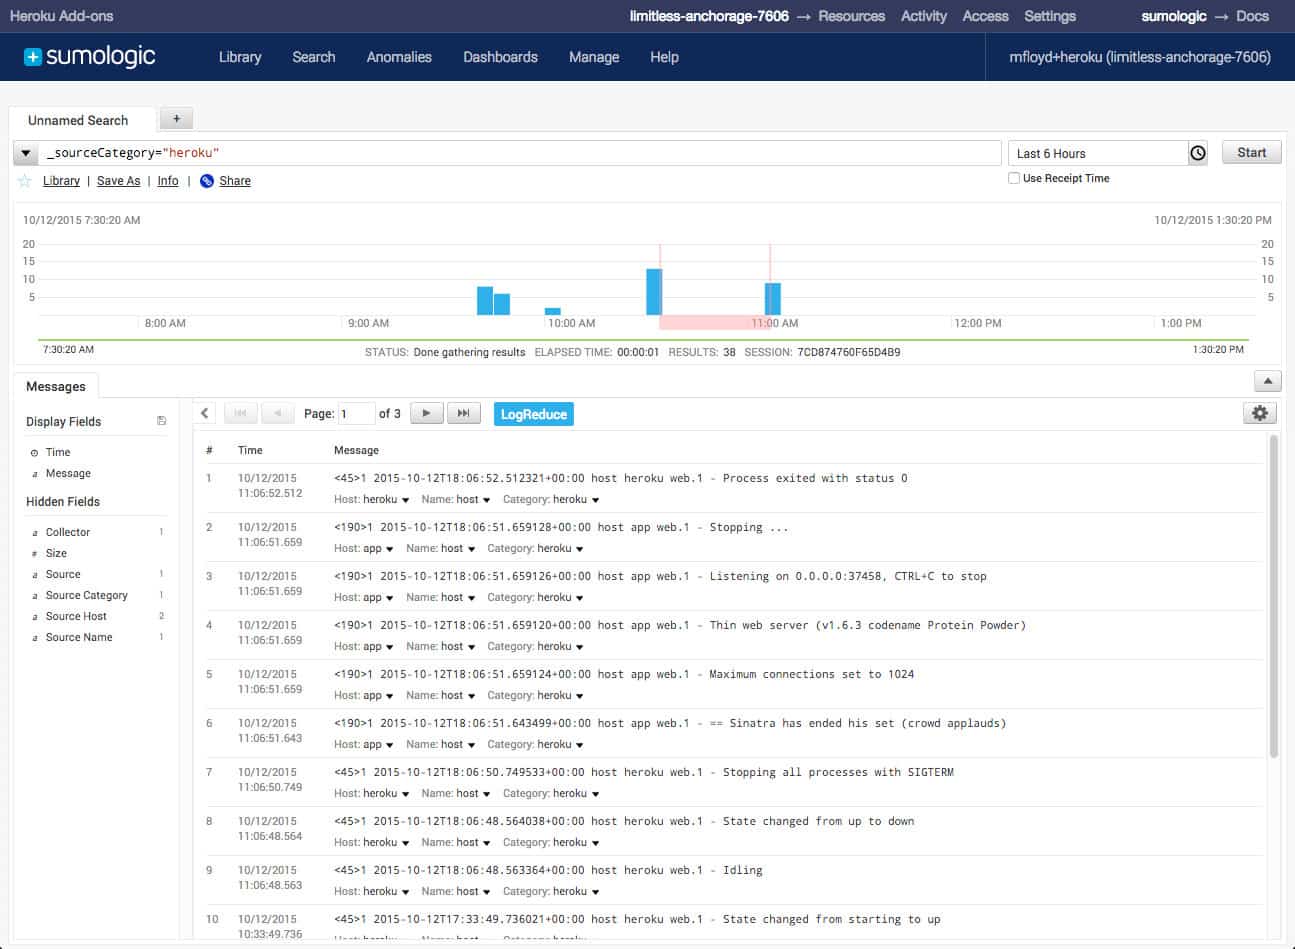
Sumo Logic is an application and log monitoring solution that’s compatible with Docker. Sumo Logic can monitor containers in real-time. The dashboard view is broken down into metric boxes and graphs. In one dashboard you can view a graph on the Top 10 Containers by CPU Consumption or the Top 10 Containers by Traffic Sent and Received alongside the number of containers created and the number of hosts.
Key Features:
- AI-Based Problem Detection: Analyzes log data
- Includes a Log Server: Collects logs from different sources and converts them into a common format
- Anomaly-Based Detection: Uses machine learning for baselining
Why do we recommend it?
Sumo Logic offers a similar service to that of the CrowdStrike CWPP. this is a cloud-based system that monitors other cloud-based systems, including Docker. The main aim of the Sumo Logic service is to provide performance and security monitoring for Web applications, many of which are delivered in Docker containers. This extends to APIs and microservices.
Advanced analytics is one of the features that makes Sumo Logic a particularly strong product. The analytics capability can automatically detect anomalies in your virtual infrastructure. In effect, this means that the program can automate the process of identifying performance issues.
Who is it recommended for?
The Sumo Logic system is made for companies that develop and support We applications and SaaS packages. The platform includes a cloud-based SIEM that will process log messages fed into it from any source, which includes Docker containers. The tool can also coordinate the defense of dispersed systems against hacker attacks.
Pros:
- Customizable Dashboards: Data visualization formats available
- Uses AI to Automatically Group Suspicious Events: This enables focused activity tracking
- Uses Intelligent Alerting: Reduce duplicate notifications
Cons:
- Set Up Takes Time: Integrations and initial onboarding can be complicated
There are three versions of Sumo Logic: Sumo Free, Professional, and Enterprise. Sumo Free costs nothing, supports up to 500Mb of log input, and. 4GB of log storage. The Professional version costs $108 (£86) per GB/month with a minimum of 3GB log input and 30Gb log storage. The Enterprise version costs $180 (£144) per GB per month with the same log limits as the Professional version. You can sign up for the 30-day free trial.
10. Splunk Observability Infrastructure Monitoring
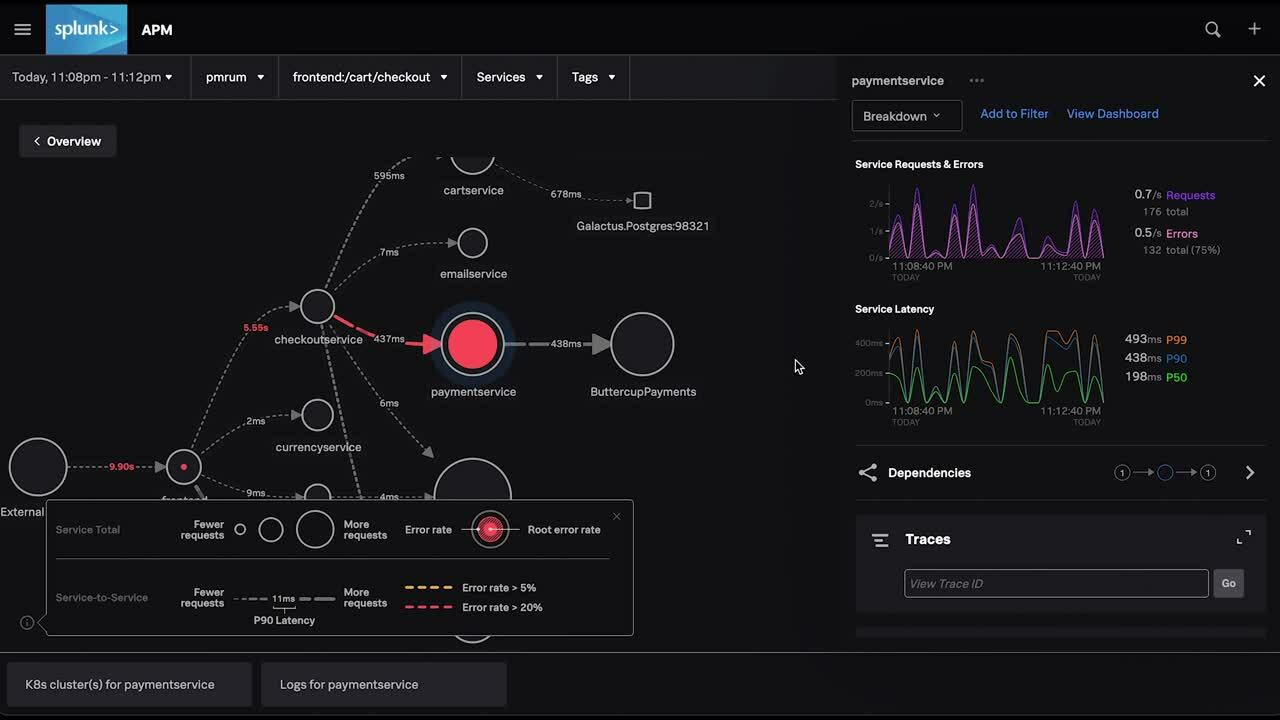
Splunk Observability Infrastructure Monitoring watches those systems that support Web applications and cloud SaaS packages. This is part of a platform of services that also includes an application performance monitor, so those two units can work together to provide full observability of any offsite system and it includes Docker monitoring.
Key Features:
- Tracks Activity Across Platforms: Cloud platforms and on-premises systems
- Watches Supporting Resources: Correlates server resource availability with demand from applications
- Alerts: Trigger when resources are low or application responses are slow
Why do we recommend it?
Splunk Observability Infrastructure Monitoring works best when combined with the application monitoring service in the Splunk Obsrrvability Cloud platform. This system will discover and map your cloud infrastructure, identifying resource demands. Multiple systems based on a single account can create resource shortages and the Infrastructure Monitor alerts on that event.
As with the other cloud infrastructure monitoring tools on this list, the Splunk core package can be expanded by cloud service integrations. The Splunk package includes a library of 250 of these plug-ins. Docker monitoring is fundamental to the core monitoring services of the Splunk Observability Cloud platform.
Who is it recommended for?
This system is recommended for businesses that manage cloud systems and Web applications, especially those that provide SaaS services and APIs for use by other businesses. The tool is also suitable for continuous testing in a CI/CD pipeline for development.
Pros:
- Cloud-Hosted: Also available for in-premises installation
- Discovers and Maps Cloud Infrastructure: Also discovers on-premises systems
- Fits Together with an APM: Available on the Splunk Observability platform
Cons:
- No Standard Price List: You have to request a quote
Splunk Observability Cloud has a complicated price calculation system based on the type of cloud service being monitored, the frequency of metric extraction, the throughput of monitoring data, and the volume of statistics that need to be stored times the retention period. You can get to know the Splunk Obervability Cloud system with a 14-day free trial.
Deciding on a Docker container monitoring tool
The variety of container monitoring tools on the market might make it difficult to know which to choose. All of the tools on this list have their strengths. Some have better dashboard-based experiences, others offer a greater depth of metrics, and others are easier to configure. Pick a tool that is most in line with your approach to network monitoring.
Related post: Docker vs Virtual Machines
Docker container monitoring FAQs
How does Docker provide isolation?
Docker provides isolation through a system of “namespaces.” The actual isolation structure is called a “container.” Thing of a container like a cardboard box that someone would use to carry a collection of their items. There is a set of namespaces for each container and they mediate with the surrounding environments, preventing direct contact with the container and external services.
Is Docker a security risk?
There are security risks involved in using Docker because one compromised container opens up a possible avenue to other containers operating in the system and also to the host. This is similar to the security risks on a network, where one compromised endpoint makes the entire network and all of its equipment vulnerable to attack. Therefore, it is important to implement security features within Docker to strengthen the security of each container.
Are Docker images secure?
Not all Docker images are secure. Be careful where you get them from. When making your own Docker structures, be sure to limit the access rights of its contents and implement appropriate security measures.
How do I prevent root access to my Docker container?
It is safer to run your Docker container as a non-root user. By default, the Docker system inherits the privileges from the user account that launches it. The settings of a container can impose further resource access limits.

