

A syslog server is a centralized log management system that collects, stores, and manages syslog messages generated by various network devices, servers, applications, and other sources. It acts as a central repository for log data and provides a platform for analyzing and monitoring system events.
Syslog servers stand as invaluable tools for network administrators, enabling them to consolidate logs from various devices into a central repository for easy monitoring, troubleshooting, and analysis.
Here are some key pain points these syslog servers can address for you:
- Fragmented log collection that can make centralized monitoring difficult
- Troubleshooting takes a long time due to limited visibility
- Poor documentation makes security and compliance challenging
- No log-based real-time alerts
- Standardizing data from different devices is challenging
Syslog servers address the above pain points, as they collect and manage syslog messages and logs from different devices. While there are several premium options available in the market, there’s a notable range of free syslog servers that offer robust features without stretching your budget. Read on, as we explore these free and paid Syslog servers for Linux and Windows.
Here’s our list of the best free and paid Syslog servers for Linux and Windows:
- ManageEngine EventLog Analyzer EDITOR’S CHOICE This log manager can be used as a SIEM tool and it will collect log messages from all over your system, collecting Syslog, Windows Events, and application status messages. Available for Windows Server or Linux. Start a 30-day free trial.
- Paessler PRTG Network Monitor (FREE TRIAL) A comprehensive network, server, and application monitor that includes sensors for Syslog management. The first 100 sensors are free. Access the 30-day free trial.
- ManageEngine Log360 (FREE TRIAL) A SIEM system that includes a log collector and server that is able to extract Syslog messages from Linux computers. Runs on Windows Server. Access a 30-day free trial.
- Site24x7 Server Monitoring (FREE TRIAL) A network, server, and application monitor that includes a log manager for Syslog and also Windows Events and application log messages. This is a cloud-based service. Get a 30-day free trial.
- FirstWave opEvents (FREE TRIAL) A log file manager that is able to collect log messages from a range of sources, including Syslog. Installs on Linux. Access the 30-day free trial.
- Syslog Watcher A free Syslog server for Windows that writes Syslog messages to files or a database and includes record sorting and filtering functions.
- The Dude Free network analysis tool with an integrated Syslog server for Windows, Linux, and macOS.
- Visual Syslog Server Collects Syslog messages and stores them to file as well as displaying them in a dashboard. The program is free and runs on Windows and Windows Server.
- SolarWinds Kiwi Syslog Server The top choice for collecting, viewing and archiving syslog messages and SNMP traps. With a variety of filters and real-time monitoring options you can closely monitor your network and also send daily summaries. Free for up to five devices.
- NxLog A free Syslog server for Windows, Linux, Unix, and Android.
- Logstash A system message monitoring service for Linux that includes the storage of Syslog messages.
- TFTPD32 Lightweight, free system message logger for Windows that includes monitoring for Syslog.
Syslog servers by OS
| Syslog server | Linux | Windows | Other |
|---|---|---|---|
| ManageEngine Log360 | No | Yes | No |
| Kiwi | No | Yes | No |
| Paessler PRTG | No | Yes | Yes |
| ManageEngine EventLog Analyzer | Yes | Yes | No |
| Site24x7 | No | Yes | No |
| FirstWave opEvents | Yes | No | No |
| Syslog Watcher | No | Yes | No |
| The Dude | Yes | Yes | Yes |
| Visual Syslog Server | No | Yes | No |
| Nxlog | Yes | Yes | Yes |
| Logstash | Yes | No | No |
| TFTPD32 | No | Yes | No |
Key points to consider while choosing a Syslog server
Selecting the right Syslog server is necessary to gain complete control and visibility over the state and performance of different devices. Some factors that can help you decide on the right server are:
- Log Volume: Assess the volume of log messages generated in your system, and accordingly, look for a tool that can handle this volume. Also, make sure to provision for future growth.
- Real-Time Alerts: A critical feature of a Syslog server is the real-time alerts. You’d want a tool that can send alerts based on specific log events or patterns, so you can take action right away.
- Search and Filter: These are key features in a Syslog server, especially if it’s going to handle large log volumes. It must allow you to search through logs and filter the content based on specified criteria.
- Storage and Retention: Some compliance standards require you to store log data for a few months. If you operate in such industries or if you prefer to store data for a certain time, check if your Syslog server can store and retain data for this duration.
- Security: Security is another important feature, so look for options that encrypt data at rest and during transit. It also helps to have access controls to prevent unauthorized access.
- Multiple Format Support: The more formats your Syslog server can support, the better it is for you. It offers more flexibility and makes your system scalable.
- Integration with Other Tools: The Syslog server you choose must be compatible with the other tools used in your ecosystem for a smooth flow of data.
Based on these features, you can zero in on the appropriate Syslog server.
How to calculate the ROI of Syslog servers
Buying a Syslog server can provide many financial benefits for your organization, provided you select the one that aligns with your goals and infrastructure. Here is a structured way to calculate the ROI of Syslog servers.
Step 1: Establish the Metrics
The first step is to decide what aspects you want to measure while calculating the ROI of your Syslog server. Some metric choices are:
- Number of devices generating logs.
- Average IT hours spent on manual log collection, filtering, and analysis.
- Frequency of undetected security or operational issues and their associated costs.
- Time to resolve incidents without centralized logging.
- Compliance-related penalties for insufficient logging.
Step 2: Calculate the Costs
In the next step, calculate the costs of your software. It can include the following.
- Subscription or licensing costs.
- Cost of implementation and initial setup.
- Ongoing maintenance costs.
- Training costs.
Step 3: Estimate the Benefits
In the next step, estimate the benefits or savings that come from implementing a Syslog server when compared to not having one. Some potential benefits are:
- Time saved on incident response.
- Reduced system downtime due to proactive issue detection and remediation.
- Fewer compliance violations.
- Quicker alerts and the resultant savings from security incidents.
- Reduced cost of multiple logging tools.
Step 4: Put It All Together
In this last step, put all the above calculations together.
- Annual Cost Savings = (IT Hours Saved * Hourly Rate) + Downtime Reduction Savings + Avoided Compliance Penalties + Security Tool Consolidation Savings
- Total Investment = Licensing + Deployment + Training + Maintenance
- ROI (%) = ((Annual Cost Savings – Total Investment) / Total Investment) * 100
Use Our Syslog ROI Calculator
Syslog Server ROI Calculator
The Best Syslog Server Tools for Linux and Windows
Features Comparison Table
| Features/Syslog Servers | ManageEngine EventLog Analyzer | Paessler PRTG | ManageEngine Log360 | Site24x7 Server Monitoring | FirstWave opEvents | Syslog Watcher | The Dude | Visual Syslog Server | SolarWinds Kiwi Syslog Server | NxLog | Logstash | TFTPD32 |
|---|---|---|---|---|---|---|---|---|---|---|---|---|
| Real-time Monitoring | Yes | Yes | Yes | Yes | Yes | Yes | Yes | Yes | Yes | Yes | Yes | No |
| Email Alerts | Yes | Yes | Yes | Yes | Yes | Yes | No | No | Yes | Yes | Yes | No |
| Log Forwarding | Yes | Yes | Yes | No | Yes | Yes | No | Yes | Yes | Yes | Yes | No |
| Log Archiving | Yes | Yes | Yes | Yes | Yes | Yes | No | Yes | Yes | Yes | Yes | No |
| Log Analysis & Reporting | Yes | Yes | Yes | Yes | Yes | Yes | No | No | Yes | Yes | Yes | No |
| Multi-Platform Support | Yes | Yes | Yes | Yes | Yes | No | Yes | No | No | Yes | Yes | No |
| GUI Interface | Yes | Yes | Yes | Yes | Yes | Yes | Yes | Yes | Yes | No | No | Yes |
1. ManageEngine EventLog Analyzer (FREE TRIAL)
Best for: Comprehensive SIEM capabilities
Relevant for: Organizations that want an integrated solution for log management, threat detection, and compliance reporting
Price: Negotiated
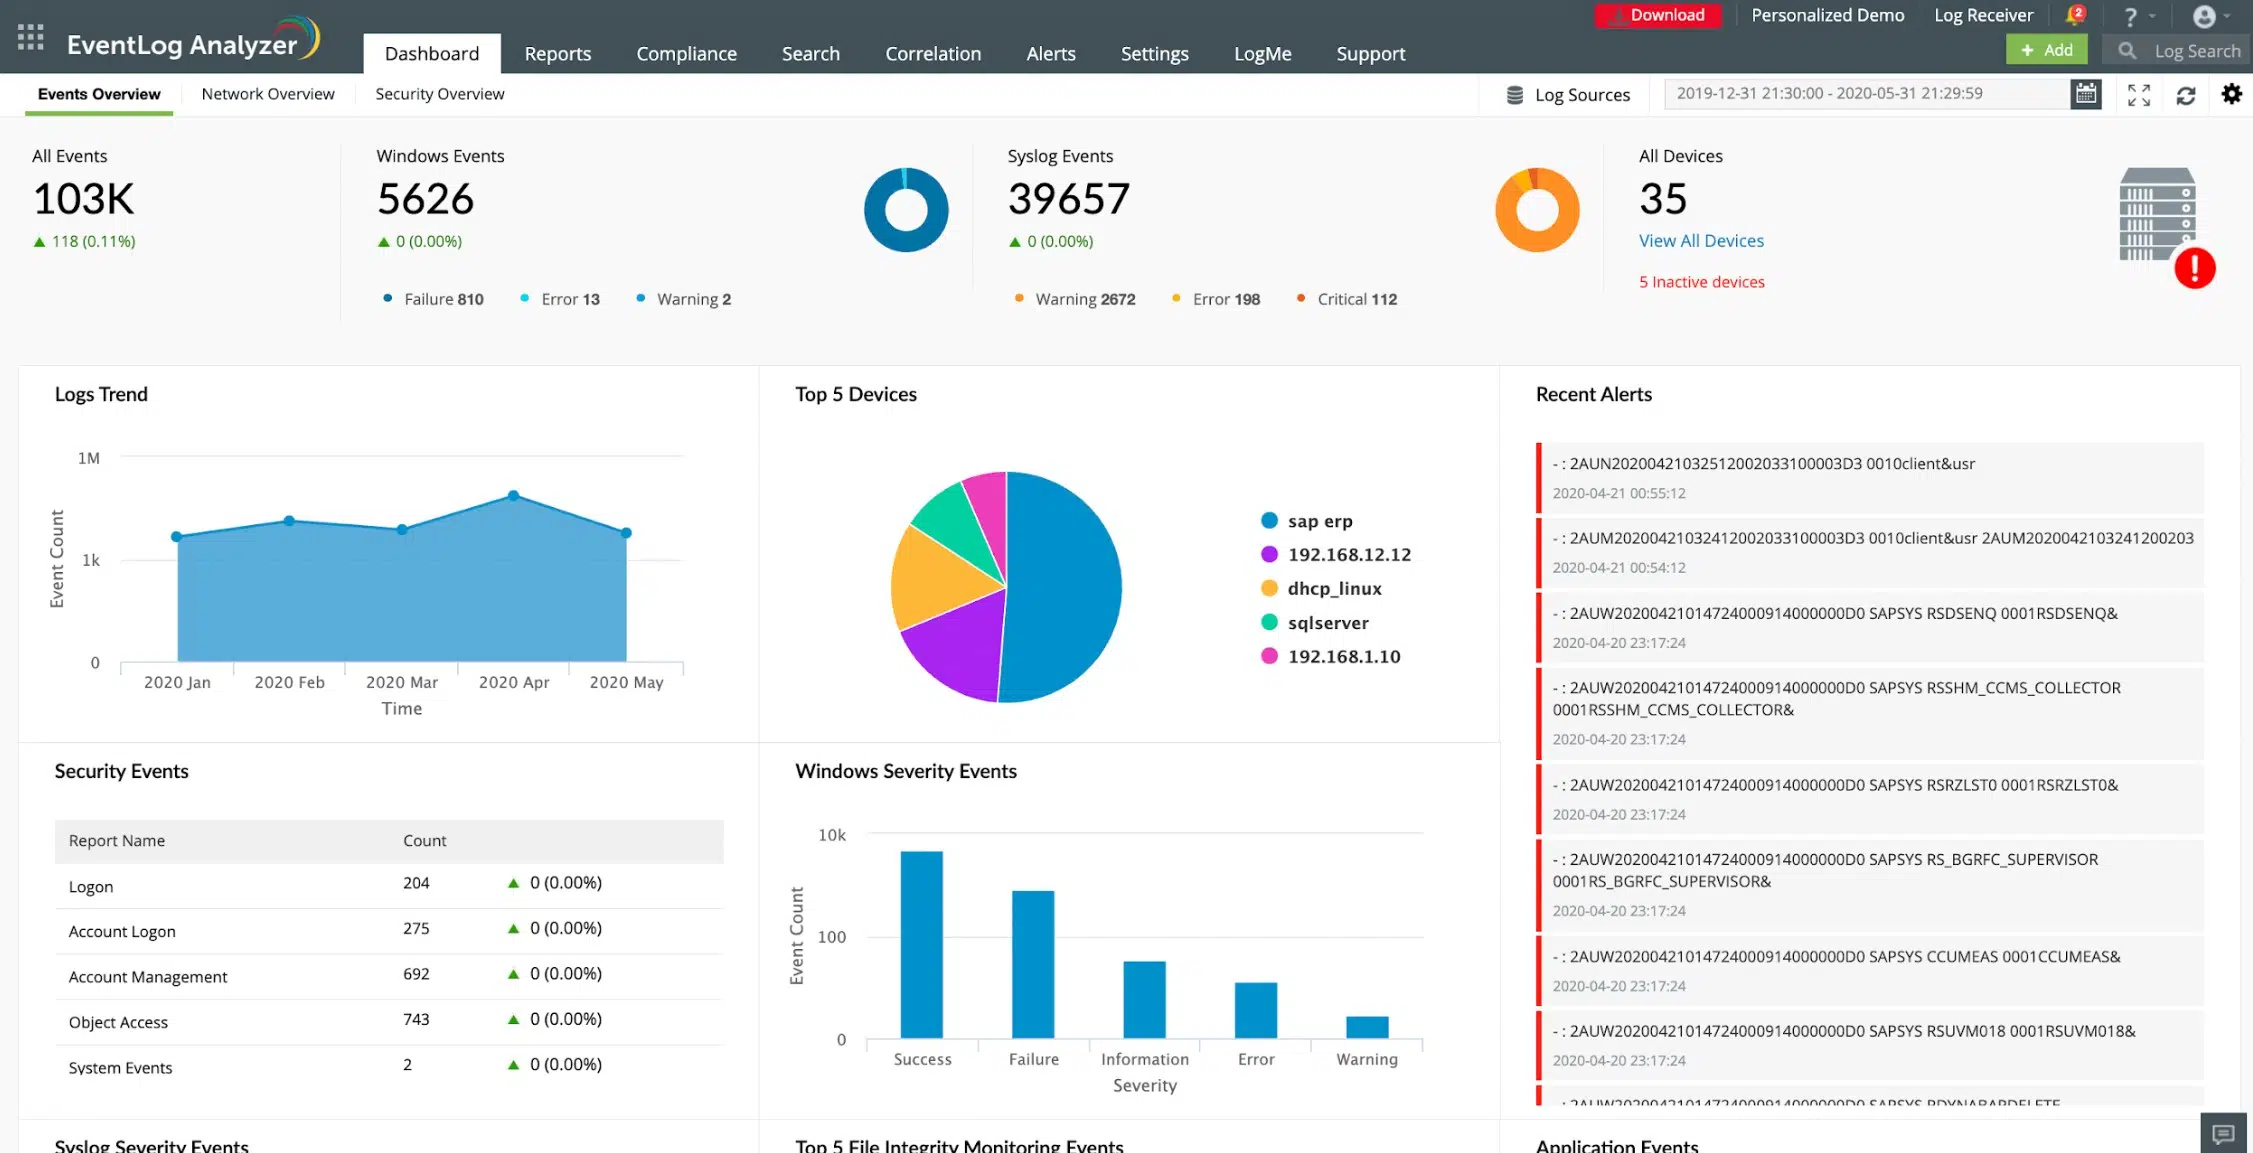
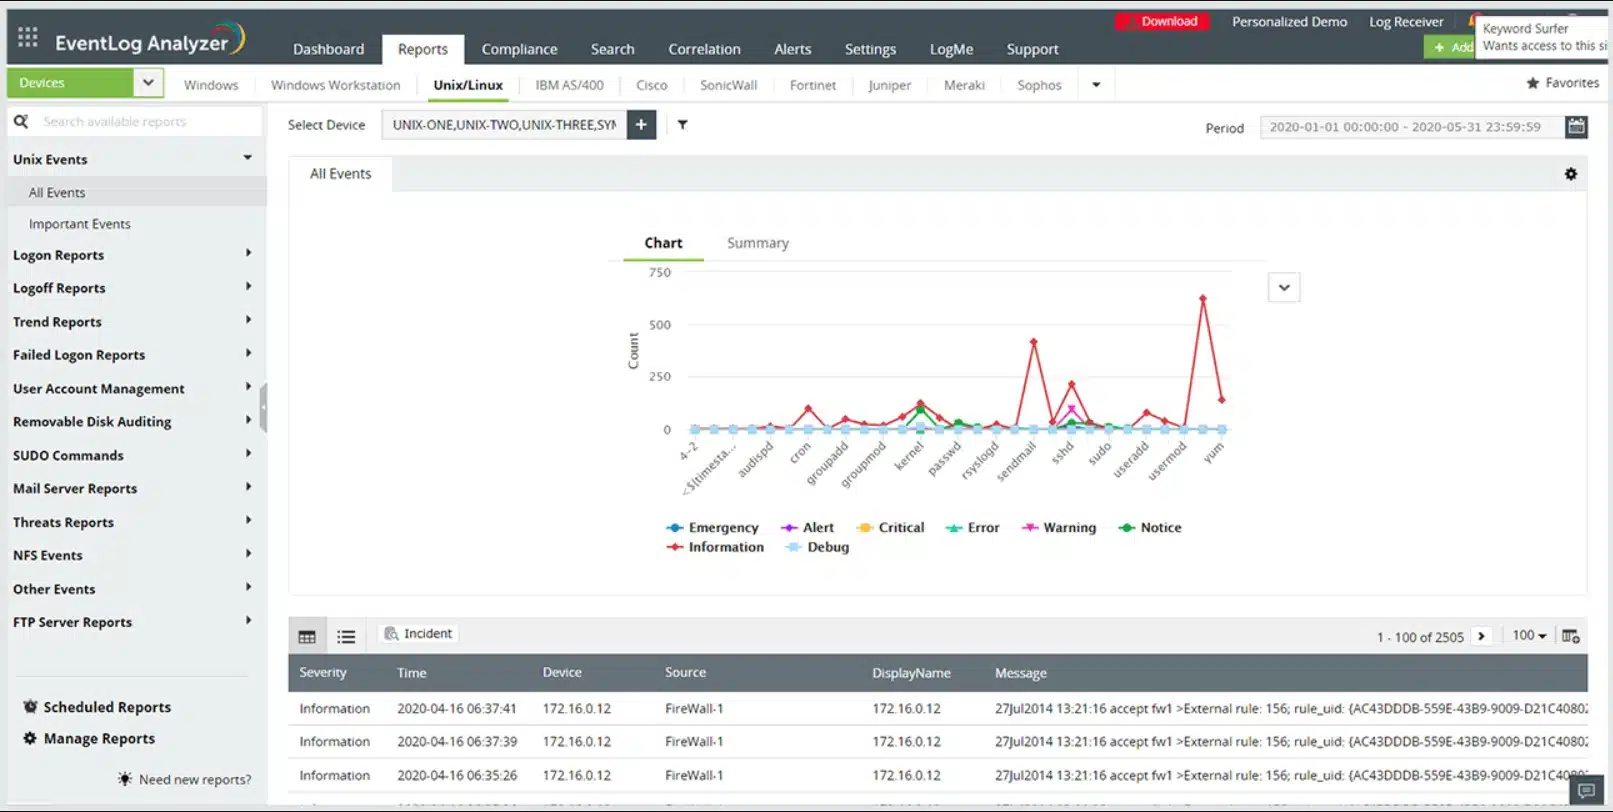
ManageEngine EventLog Analyzer operates as a Syslog server and is free for up to five log sources. The monitoring software can be installed on Windows or Linux, but it can monitor events arising on any operating system. The syslog data can originate in any type of network-connected equipment, including switches, routers, and virtual machines.
When we tested ManageEngine EventLog Analyzer we found the following key features.
ManageEngine EventLog Analyzer’s Key Features:
- Centralized Log Management: Collects logs from various sources like servers, network devices, applications, and security systems into a single platform for unified management.
- Log Parsing and Normalization: Parses logs from different sources into a standardized format for easier analysis and correlation.
- Real-Time Monitoring: Provides real-time visibility into IT infrastructure activity and potential security threats.
- Alerting and Reporting: Generates alerts for suspicious activity and offers comprehensive reports for security analysis and compliance purposes.
- Security Information and Event Management (SIEM): Offers advanced features like threat intelligence, user entity and behavior analytics (UEBA), and incident response tools.
Unique Business Proposition
This is a comprehensive tool that combines multiple features like log collection, analysis, and correlation. It is also highly scalable, as it can support more than 750 different log sources. Its predefined templates for compliance reporting are a bonus as well.
Feature-in-Focus: Real-time Event Correlation
A highlight of this platform is its robust correlation engine that analyses syslog messages in real-time to provide immediate alerts when needed. It also comes with 300+ predefined alert criteria that you can use to configure your alerts.
Comparitech SupportScore – 9.3
ManageEngine is known for its excellent customer support backed by a well-written self-supporting documentation. Its financial stability and employee headcount are other high points. Though the employee job satisfaction is lower than some vendors, we don’t anticipate any drops in the future.
Why do we recommend it?
ManageEngine EventLog Analyzer can collect and store many log message formats, not just Syslog. The tool also has deployment options – you can host it on Windows Server or Linux. This tool is more than a log server because it provides a viewer with analysis tools and also implements automated threat hunting as a SIEM service.
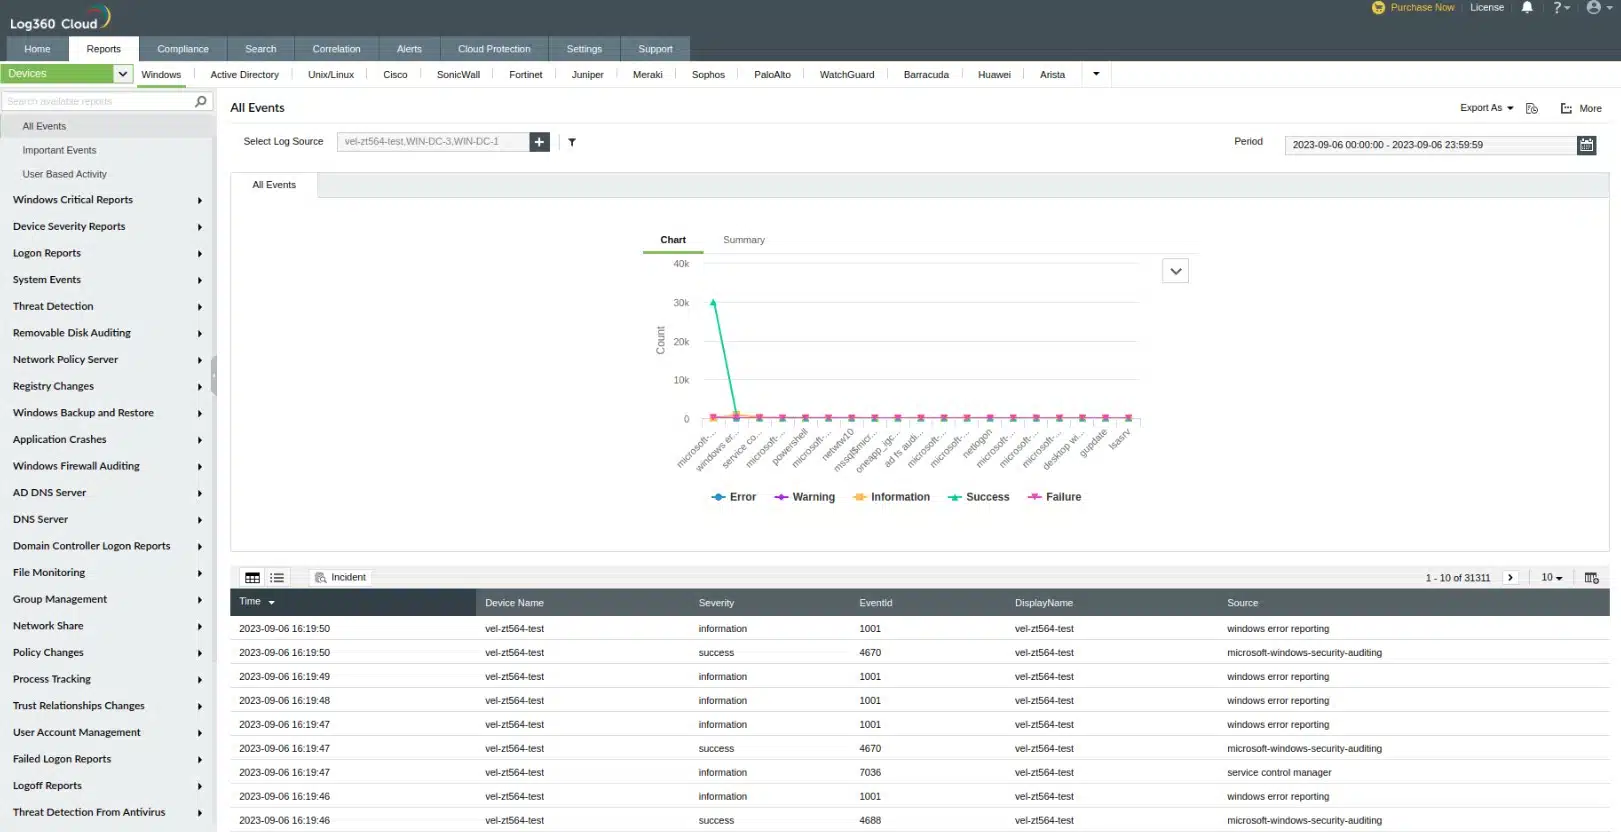
You don’t have to put much work into setting up the system thanks to its autodiscovery feature. Syslog is a messaging standard implemented by just about all network-connected devices, so the EventLog Analyzer just needs to listen on the network for all Syslog-compliant messages sent out by the equipment connected to it. Each message contains a header that identifies its origin. That enables the EventLog Analyzer to build up a list of all hardware on the network and list alerts and status reports by IP address/origin.
The ManageEngine dashboard includes a lot of functionality that enables you to specify actions to perform on the collected Syslog data. A typical Syslog server requirement is to write all records to event logs. This action is available, but you can also query records in the dashboards and sort and filter messages. Archived logs can be compressed and encrypted. The encryption enables access rights to be imposed on user accounts, so the visibility of the data in Syslog files can be restricted to just a few network users with admin rights.
Who is it recommended for?
The EventLog Analyzer system is suitable for use by businesses of all sizes. Very small businesses should take up the offer of the Free Edition, which is limited to collecting logs from five sources.
During our testing, we identified the following pros and cons related to EventLog Analyzer.
Pros:
- Compliance Management: Helps organizations meet compliance requirements for data security regulations like HIPAA, PCI DSS, and GDPR.
- Improved Security Visibility: Real-time monitoring and event correlation help identify potential security threats faster.
- Enhanced Threat Detection: Advanced features like threat intelligence and UEBA improve threat detection capabilities.
- User-Friendly Interface: Relatively easy to set up and use compared to some complex SIEM solutions.
- Log Viewer and Analyzer: Supports manual data analysis for troubleshooting.
Cons:
- Lack of SaaS Option: Not available as a Software as a Service (SaaS) package, limiting deployment flexibility for some users.
The EventLog Analyzer can also monitor SNMP messages. ManageEngine produces a comprehensive network monitoring system, called OpManager. A Free Edition of this tool is available allowing up to 5 log sources only. You can also download a 30-day free trial of the Premium Edition. For more pricing options, you can contact their sales team.
EDITOR'S CHOICE
ManageEngine EventLog Analyzer is our top pick for a Syslog server because this log management package is designed to monitor and analyze logs from various network devices and applications. It serves as a centralized syslog server, collecting logs from devices like routers, switches, firewalls, Unix/Linux servers, and more. This helps organizations gain real-time visibility into their network activity and detect potential security threats. EventLog Analyzer’s built-in syslog server collects syslog messages from network devices and provides in-depth insights into security events. It supports both Windows and Linux environments, allowing for comprehensive monitoring and management of logs from these systems. The tool automates the tracking of security-related event IDs, helping organizations meet their operational, security, and compliance requirements. The free edition of EventLog Analyzer allows users to monitor up to five log sources. It includes essential features like log collection, real-time event correlation, and automated alerts. This edition is ideal for small-scale environments or for those who want to evaluate the tool before committing to a paid plan. ManageEngine also offers a free trial of the full paid package. The system can be used to collect logs from Windows environments as well as Syslog-compatible assets. ManageEngine EventLog Analyzer is a powerful tool for log management and network security, offering flexible solutions for different organizational needs.
Download: Get a 30-day free trial
Official Site: https://www.manageengine.com/products/eventlog/download-free.html
OS: Windows Server or Linux
2. Paessler PRTG Network Monitor (FREE TRIAL)
Best for: Flexible monitoring
Relevant for: Organizations that want to monitor across multiple devices and operating systems
Price: Depends on the number of aspects you use, where each aspect is one metric measured on one device. It starts at $179/month for up to 500 aspects
Paessler PRTG Network Monitor is a very comprehensive network monitoring system. However, you can use PRTG for free if you have a small network. Paessler charges per “sensor.” A sensor is a condition or status on a network. The company counts Syslog as one sensor, and if you monitor 100 sensors or less, the system is free of charge. So, you will have 99 other network conditions that you can monitor before you have to pay.
When we tested PRTG Network Monitor we found the following key features.
Paessler PRTG Netowork Monitor’s Key Features:
- Network Discovery and Asset Inventory: Automatically discovers network devices and creates an inventory, simplifying network management.
- Topology Mapping: Creates visual representations of network topology for better understanding and management.
- Live Performance Graphs: Provides real-time visualizations of network performance metrics through graphs.
- SNMP Methodology: Utilizes SNMP (Simple Network Management Protocol) for network monitoring and management.
- Wireless Footprint Mapping: Maps wireless network coverage and performance for better optimization and troubleshooting.
Unique Business Proposition
PRTG is a flexible platform that allows you to customize what you want to monitor across different devices. It also integrates syslog monitoring with IT infrastructure monitoring to provide comprehensive visibility. It comes with more than 250 preconfigured sensors to meet a wide range of requirements.
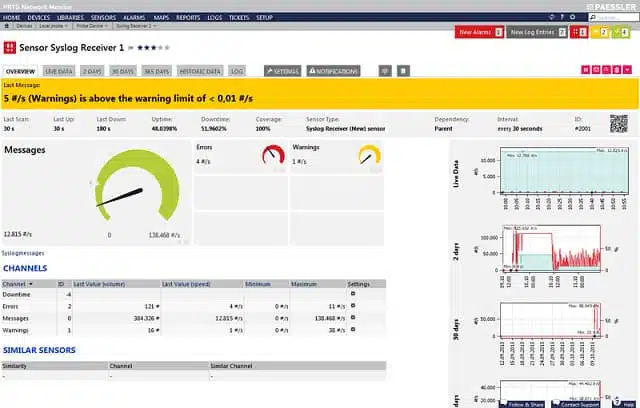
Feature-in-Focus: Syslog Receiver Sensor
The Syslog Receiver Sensor acts as a centralized sensor that can capture and analyze syslog messages from different network devices. Also, it displays the critical information that users need to handle emergency situations. You can also set up real-time alerts to specific events.
Comparitech SupportScore – 8.8
Paessler offers excellent customer support and self-supporting documentation. However, its employee headcount and job satisfaction levels are low, and this means, you must keep an eye out for drops, though we don’t expect any major impact.
Why do we recommend it?
Paessler PRTG Network Monitor runs on Windows Server so if you need to collect Syslog messages from other operating systems and store them through your Windows system, this is a great option. The Syslog Receiver Sensor inserts logs into a database and that provides options over how the messages can be used and managed.
You can download the PRTG software from the Paessler website and install it on Windows. There isn’t a version for Linux. However, you can opt to access the software as a cloud service, which is system agnostic.
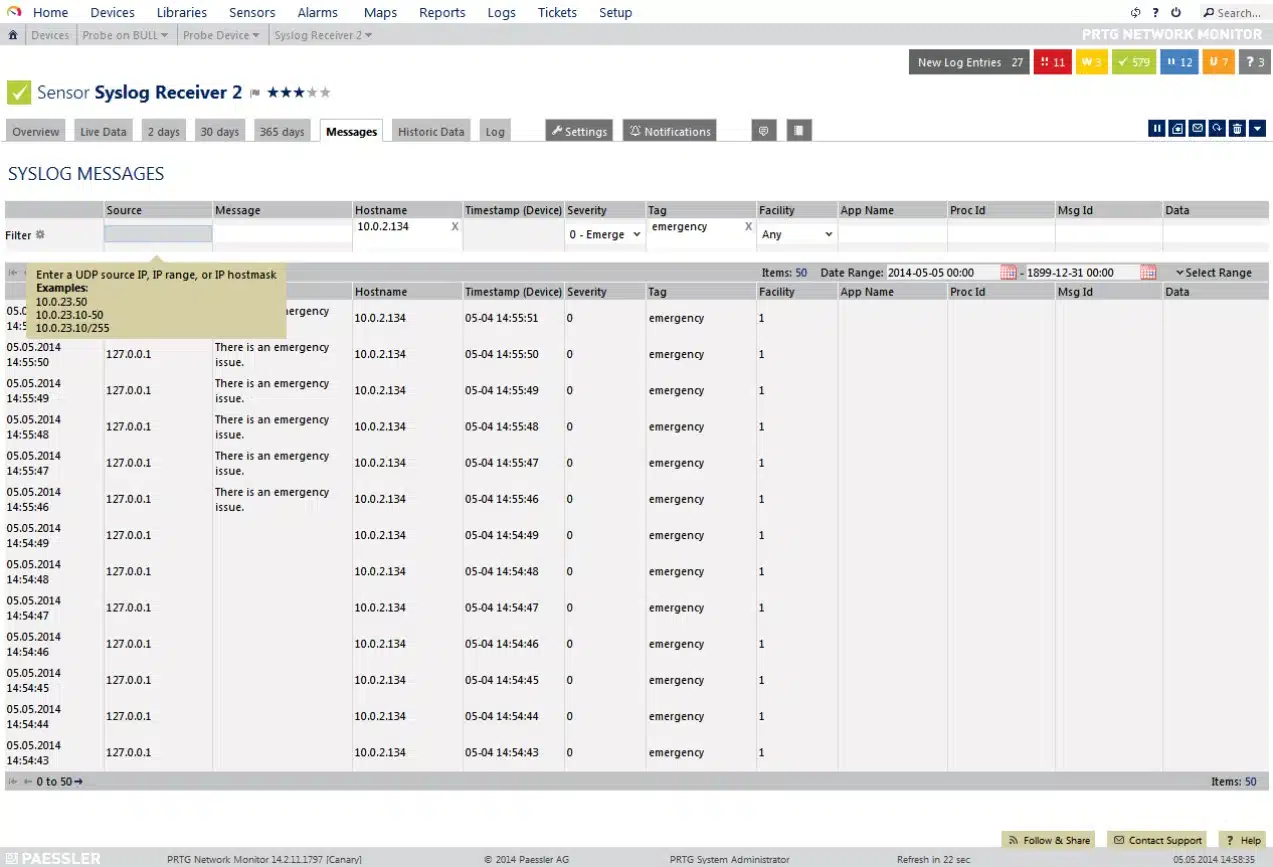
The Syslog function in PRTG is called the Syslog Receiver. This sensor will gather all Syslog data traveling around your network and write them to a database. Once the messages are in the database, the subsequent management of those records depends on the settings that you specify for the system. You can get them written to log files, query them in the PRTG dashboard, and trigger actions under certain conditions.
Who is it recommended for?
All businesses need to collect log messages for security monitoring and compliance reporting, so getting this Syslog manager for free is a great option for businesses of all sizes.
During our testing, we identified the following pros and cons related to Network Monitor.
Pros:
- Scalability: It supports distributed monitoring, allowing users to monitor multiple networks and locations from a centralized console.
- Multi-Vendor Support: PRTG supports a wide range of vendors, devices, and technologies, including network equipment, servers, virtual machines, cloud services, and applications.
- Real-time Monitoring: PRTG provides real-time monitoring and alerting capabilities, allowing users to receive instant notifications of network issues or performance degradation.
Cons:
- No Patch Manager or Configuration Manager: Lacks features for patch management and configuration management, which are essential for comprehensive network maintenance and security.
PRTG is free if you only activate up to 100 sensors, which is more than enough to access the Syslog server monitors. Get started by downloading a 30-day free trial.
3. ManageEngine Log360 (FREE TRIAL)
Best for: Integrated security and compliance management
Relevant for: Organizations that want threat detection and comprehensive log analysis for security and compliance monitoring
Price: Negotiated

ManageEngine Log360 is a SIEM system that also acts as a log manager – those logs are the source data for the SIEM. This software package installs on Windows Server. However, it is able to collect Syslog messages from computers running Linux. It is also able to collect logs from computers running macOS and Windows. The different log messaging standards produce different message layouts, so the log manager in Log360 converts all of the messages that it receives into a common format.
When we tested ManageEngine Log360 we found the following key features.
ManageEngine Log360’s Key Features:
- Log Correlation: Correlates log events from different sources to identify patterns, trends, and relationships indicative of security incidents or operational problems.
- Threat Intelligence Integration: Integrates with threat intelligence feeds to enhance threat detection capabilities and provide contextual information for security events.
- Automated Responses: Enables automated responses to security incidents through predefined rules and actions, improving incident response times and efficiency.
- User Activity Monitoring: Tracks user activity across the network, including logins, file accesses, and changes to permissions, to detect unauthorized or suspicious behavior.
- Log Archiving and Retention: Archives log data for historical analysis and compliance auditing purposes, ensuring data integrity and regulatory compliance.
Unique Business Proposition
It’s a SIEM solution that combines multiple tools for comprehensive coverage. Its centralized log collection and analysis provide the control and visibility you need over security threats. Also, its preconfigured compliance templates help you meet the requirements of different compliance standards.
Feature-in-Focus: Advanced Threat Analytics
Log360 uses an AI-driven anomaly detection system that helps identify and respond to threats in real time. With intelligence feeds and contextual data, it reduces false positives and ensures that you have the information for making the right decisions.
Why do we recommend it?
ManageEngine Log360 is a very large package that includes many of the log-related systems offered by ManageEngine. Among these is the LogEvent Analyzer, which both collects and searches log messages. The system consolidates log messages of different formats, including Syslog and Windows Events.
The log messages can be viewed within the console as they arrive and they are also filed. The data viewer can recall a file for analysis. While manual analysis is possible, the system’s main value is its automated SIEM scanning.
The SIEM service identifies anomalous behavior. In order to do this, the service establishes a framework of normal behavior through the deployment of user and entity behavior analytics (UEBA). Differences from the standard trigger an alert. You can adjust the threshold for alert generation. Alerts can be fed through service desk ticketing systems, including ManageEngine ServiceDesk Plus, Jira, and Kayoko.
ManageEngine Log360 doesn’t just collect Syslog, it will receive all the major formats of log messages, including Windows Events. The package will consolidate all incoming log messages into a neutral format and enable them to be searched and sorted together. The tool will also store those messages together. When it converts Syslog messages, the service adds on its own field designating the source and type of the original message. This means that even though the distinction of “Syslog” is lost by the consolidation process, those records can still be identified by filtering on the source type field. The package also includes a SIEM tool that can provide security monitoring by scanning incoming logs.
Who is it recommended for?
ManageEngine Log360 is a very comprehensive package with many utilities in it. A small business that doesn’t have a dedicated systems administrator would probably find that they just don’t have the time to even set up all of the utilities. So this bundle is a better choice for large organizations that have a team of system management technicians.
During our testing, we identified the following pros and cons related to ManageEngine Log360.
Pros:
- Freeware Version: Offers a limited freeware version suitable for smaller businesses, providing cost-effective log management.
- Compliance Reporting: Generates compliance reports for regulatory standards such as GDPR, HIPAA, PCI DSS, and SOX, helping organizations demonstrate compliance.
- Alerting and Notifications: Sends alerts and notifications via email, SMS, or SNMP traps for critical events, security threats, or predefined thresholds.
- Integration with ManageEngine Tools: Works seamlessly with other ManageEngine tools, ensuring compatibility and easy integration into existing environments.
Cons:
- Complexity: The platform may be complex to set up and configure, requiring expertise and time for implementation.
- Resource Intensive: EventLog Analyzer may require significant resources, including hardware and personnel, for optimal performance and management.
ManageEngine Log360 is available in a Free edition to monitor up to 25 endpoints. The Professional edition is available for a 30-day free trial.
4. Site24x7 Server Monitoring (FREE TRIAL)
Best for: Integrated log monitoring
Relevant for: IT teams that need both syslog management and full-stack integrated monitoring on the same platform
Price: All-in-One option priced at $35/month for SMBs, $89 for SMEs, and $225 for enterprises

Site24x7 is a cloud-based platform of system monitoring tools. The services are sold in bundles of monitors and management tools and all include the Log Manager.
When we tested Site24x7 Server Monitoring we found the following key features.
Site 24×7’s Key Features:
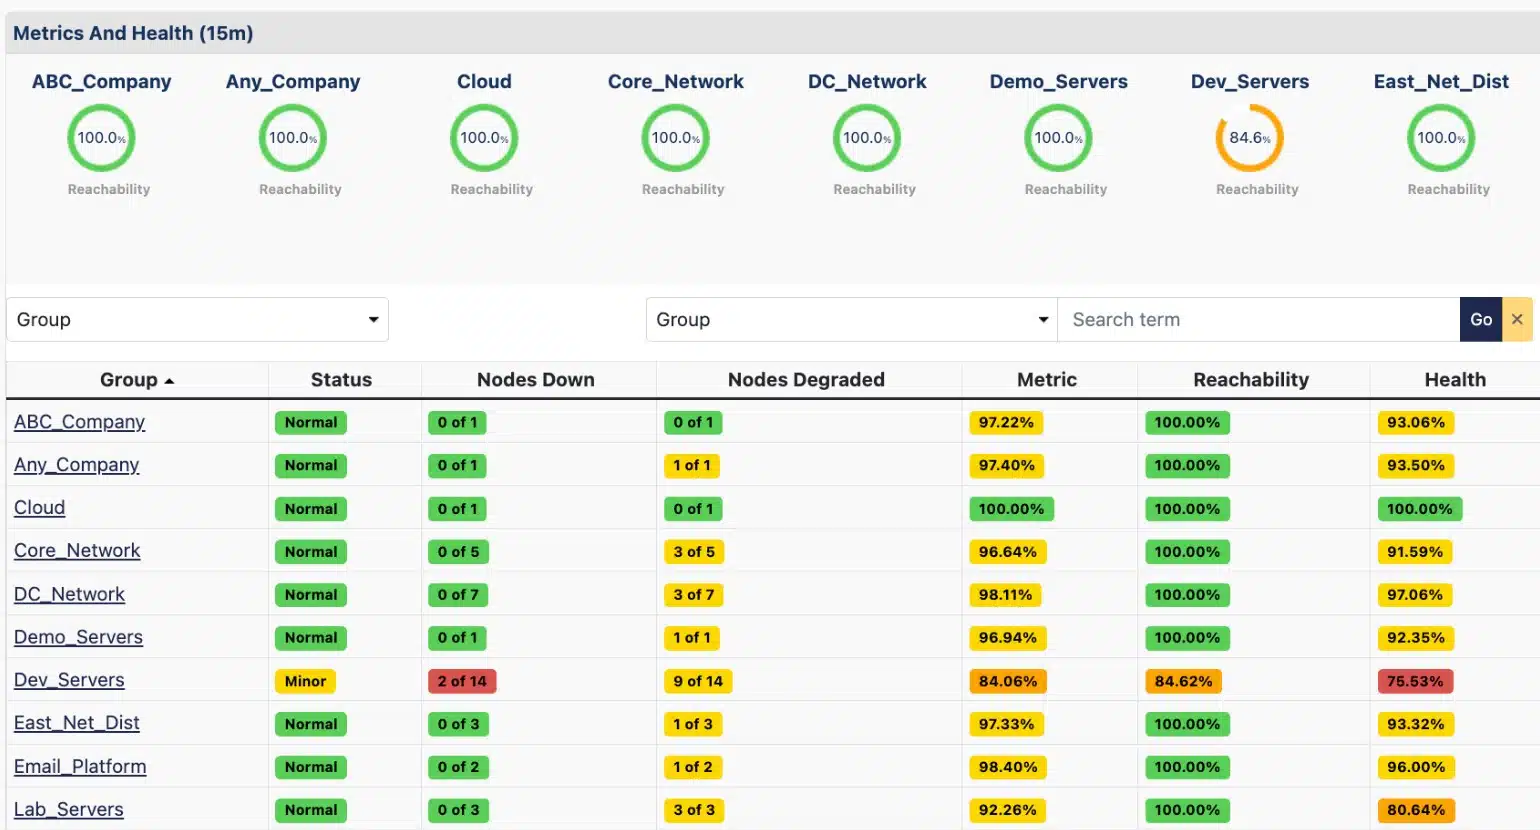
- Server Performance Monitoring: Tracks key metrics like CPU usage, memory utilization, disk space, and network traffic to identify potential performance bottlenecks.
- Application Monitoring: Monitors the health and performance of applications running on your servers, ensuring smooth operation.
- Website Monitoring: Monitors website uptime, performance, and user experience from various locations around the world.
- Cloud Monitoring: Extends monitoring capabilities to cloud resources like AWS, Azure, and GCP.
- Synthetic Monitoring: Simulates user interactions with your website or application to proactively identify issues that might affect real users.
- Log Management: Collects and analyzes server logs to identify potential issues and security threats.
- Historical Data Analysis: Stores historical performance data for trend analysis, capacity planning, and troubleshooting.
Unique Business Proposition
Site24X7 combines log and infrastructure monitoring, so organizations can get more visibility from just a single tool. It is also highly flexible and scalable, making it ideal for organizations with multiple devices and environments.
Feature-in-Focus: Integrated Log Analysis
A salient feature of Site24X7 is its ability to ingest logs from multiple sources, including Linux and Windows syslogs. It combines and categorizes these logs for easy search and filtering. Also, with this combined data, it becomes easier to detect patterns, and you can even set up alerts that match preconfigured patterns.
Comparitech SupportScore – 9.3
Since Site24X7 is owned by Zoho, the parent company of ManageEngine, it shares the same resources.
Why do we recommend it?
Site24x7 offers packages of monitors and services on a cloud platform. While monitoring networks and servers, the bundles also includes log collection that consolidates different formats of log messages, including Syslog and Windows Events. The great thing about this package is that you effectively get log management added for free to a full system monitoring package.
The Site24x7 Infrastructure plan is one of those bundles. IT offers networks, server, application, and website monitoring utility as well as the Log Manager. This system is almost entirely based in the Cloud. However, it requires an agent program to be installed on the monitored system. There is a version of the agent for Linux and another for Windows Server. Whichever version gets installed, the system can collect Syslog messages because it is able to gather data across a network.
The agent program uploads data, including Syslog messages, to the Site24x7 server for processing. The server puts all of the log messages that it receives into a common format and then files them. The standardization of message formats allows log messages gathered from different sources to be analyzed together.
The Site24x7 dashboard includes a log file viewer that has a number of data analysis tools built into it. These tools include the ability to search, sort, filter, and group messages.
Who is it recommended for?
Any business of any size would benefit from the Site24x7 service. The platform is based on the cloud, so you don’t need to install or maintain any software on your site. This means that even own-run businesses with free staff and no technical expertise can get log management sorted out.
Pros:
- Log Visualization: Offers one of the best platforms in terms of log visualization, enhancing data interpretation and analysis.
- Plug-and-Play Configuration: Provides numerous templates and configurations that make the platform plug-and-play, simplifying setup and deployment.
- Cloud Service: Operates as a cloud service, reducing infrastructure costs and enabling easy scalability.
- Cross-Platform Support: Log collector agent available for both Windows and Linux, ensuring compatibility across different operating systems.
- Flexible Pricing: Pricing based on data processed and retention rates, making it suitable for both large and small businesses with varying log management needs.
Cons:
- Alert Noise: Users may experience alert fatigue or noise due to false positives or overly sensitive alerting policies, requiring fine-tuning of alert thresholds and policies.
- Dependency on Internet Connectivity: Site24x7 relies on internet connectivity for monitoring and alerting, which may be a limitation for organizations with restricted internet access or security concerns.
The Site24x7 Infrastructure plan costs $9 per month when paid annually and it includes a log message processing allowance of 500 MB per month. This allowance can be upgraded for a fee: 10GB at$10 per month, 100GB at $95 per month and 1TB at $900 per month.
Site24x7 Infrastructure is available for a 30-day free trial.
5. FirstWave opEvents (FREE TRIAL)
Best for: Automated event correlation
Relevant for: Organizations that need intelligent event correlation based on syslog and other log data
Price: Negotiated

FirstWave opEvents is a Syslog collector that is also able to collect Windows Events and log messages from applications. The opEvents service will consolidate log messages from all sources by converting them into a common format before storing them in files.
When we tested FirstWave opEvents we found the following key features.
FirstWave opEvents’ Key Features:
- Log Consolidation: Acts as a consolidator for Syslog and other log sources, facilitating centralized log management.
- Log File Management: Manages log files, ensuring efficient storage and retrieval of log data.
- Powerful Log Consolidation: Provides robust log consolidation capabilities, suitable for pulling data from diverse log sources.
- Configurable Alerts: Alerts can be configured based on log message arrival rate, allowing for customized alerting based on specific criteria.
- Data Viewer: Provides a data viewer for easy visualization and analysis of log events.
- Alerts: Generates alerts based on log message arrival rate, enabling proactive monitoring and response.
Unique Business Proposition
This tool brings together troubleshooting and event log data into a single platform to offer unified views of your infrastructure. Besides speeding up the troubleshooting process, this approach also reduces false notifications and alert fatigue.
Feature-in-Focus: Log Consolidation and Alerting
A notable feature of this tool is that it consolidates log data from different sources, including syslog, SNMP, and log files, and combines them into a standardized format. Its intelligent automation processes can send alerts based on detected patterns for faster troubleshooting and improved decision-making.
Comparitech SupportScore – 7.6
While the self-supporting documentation is good, you cannot expect much support otherwise. The employee headcount and their job satisfaction index are below average, and this could be attributed to the slower-than-expected time for troubleshooting issues.
Why do we recommend it?
FirstWave opEvents is a good option for those who want to run log management on a Linux computer. This system isn’t limited to Syslog because it will collect other formats and merge them all into a common format. This enables the messages to be searched and sorted. The package will also store log messages in files.
The system rotates files and gives them meaningful names, storing them in a logical directory structure so that individual log messages can be located manually. The dashboard for opEvents shows the arrival rate and sources for all messages as they are processed and it is possible to place performance expectation thresholds on this arrival rate. If log messages stop arriving or arrive at a faster or slower rate than expected, the system will raise an alert.
The dashboard also includes a data viewer. You can load in log files and then sort, group, and search through them, creating manual analysis queries. These queries can be stored so they can be applied to other files.
Who is it recommended for?
The FirstWave opEvents system is recommended for businesses of all sizes. Small businesses would particularly benefit from this package because they can use it for free while also using the free network monitoring system.
During our testing, we identified the following pros and cons related to FirstWave opEvents.
Pros:
- Visualization: Provides customizable dashboards and reports for visualizing event data and performance metrics, aiding in data analysis and decision-making.
- Automation: Supports automated response actions to incidents, improving incident response times and efficiency.
- User-Friendly Interface: Offers a sleek and easy-to-navigate user interface, improving user experience and usability.
- On-Premise Solution: Solid alternative to cloud-based solutions, providing on-premise deployment options for enhanced control and security.
Cons:
- No Cloud Version: Does not offer a cloud version, which may limit deployment flexibility for users preferring cloud-based solutions.
The FirstWave system is centered on the Network Management Information System (NMIS), which is a free, open-source system. You have to install NMIS first because opEvents is an add-on and not a standalone service. opEvents is free for networks of up to 20 nodes. Both packages install on Linux. It is possible to install it on Windows over an FirstWave hypervisor. The full version of opEvents is a paid service and you can get it on a 30-day free trial.
6. Syslog Watcher
Best for: High-performance syslog management
Relevant for: Organizations that want a robust syslog process for their Windows environment
Price: Starts from $585

Syslog Watcher from EZ5 Systems is available for installation on Windows. This is a free Syslog server program with several extra Syslog monitoring features. As just about every device connected to your network sends out Syslog messages, the Syslog server has to work fast if you want it to do more than just collect and write those messages to a file. Syslog Watcher uses a multithreaded architecture, so the Syslog collection of new records isn’t held up by the completion of processing.
When we tested Syslog Watcher we found the following key features.
Syslog Watcher’s Key Features:
- Log Filtering and Alerting: Allows filtering of logs based on severity, source, or keyword, and generates alerts for critical events.
- Log Search and Analysis: Offers basic search capabilities to analyze collected syslog messages for troubleshooting or security purposes.
- Multi-Threading: Utilizes multi-threading for faster and more efficient log processing, improving performance.
- Database Writing: Allows writing logs to a database, suitable for handling larger volumes of log data that require review.
- Monitoring Options: Supports monitoring over UDP or TCP, providing more port options compared to other tools.
Unique Business Proposition
This is a high-performance syslog management platform that has a multi-threaded architecture capable of processing more than 5,000 syslog messages per second. It is a Windows-native tool that integrates well with all Windows server versions to offer features like monitoring and alerting.
Feature-in-Focus: Advanced Filters
Syslog Watchers is best known for its capability to support complex and advanced filters. Using this tool, you can set up multiple filters to trigger alerts for precise events. It can even consolidate multiple alerts into a single notification to reduce fatigue.
Why do we recommend it?
Syslog Watcher is a free Syslog server that runs on Windows. This is a big advantage for companies that have Linux machines and run applications that use the Syslog format but want to centralize all log management on a Windows computer.
The control dashboard gives you options on how to process messages. You aren’t limited to storing them in files because you have the option of writing them to a database. Getting your Syslog messages in a database gives you a lot more power to deal with event records because you can sort, filter, group, and count them. It allows you to combine events to generate customer alert conditions. You can get alert messages sent to you by email through the Syslog Watcher.
Syslog Watcher can monitor messages both over UDP and TCP, and it can operate with both the IPv4 and the IPv6 address systems.

Who is it recommended for?
There is nothing to stop businesses from using the Free Edition of Syslog Watcher. The main problem users of this version might encounter is that it is limited to dealing with three concurrent connections. As many applications generate Syslog messages almost constantly, managing the flow of messages to open and close connections could end up being a complication that isn’t worth the bother when the paid version is available at a low price.
During our testing, we identified the following pros and cons related to Syslog Watcher.
Pros:
- User-Friendly Interface: Features a user-friendly interface with intuitive navigation and setup process, making it accessible for both novice and experienced users.
- Cost-Effective: Syslog Watcher may offer cost-effective pricing options compared to some other syslog management solutions.
- Free for Home Use: Offers a free version for home use, providing cost-effective log management.
- Real-time Monitoring: Provides real-time view of network activity through collected syslog messages.
Cons:
- Limited Functionality: Lacks advanced features like log parsing, normalization, correlation, or security analytics.
- Limited Scalability: Might not be suitable for handling large volumes of log data from complex IT environments
- Cluttered Interface: The interface may feel cluttered, especially with a high volume of logs, potentially impacting user experience.
UPDATE: Syslog Watcher is free for home use. Business users have to pay for the tool. However, EZ5 Systems offers a 30-day money-back guarantee. So, if you want to try it out for free, just use it for a month and then ask for your money back.
7. The Dude
Best for: Integrated network mapping and syslog management
Relevant for: Organizations using a Windows environment that require network visualization and centralized syslog management combined into a single tool
Price: Negotiated
The Dude is a very widely used free network analysis tool that includes Syslog server functions. This app can be installed on any Windows version from Windows 2000 on, all flavors of Linux, and macOS. This tool is produced by MikroTik, a router manufacturer from Latvia.
When we tested Dude we found the following key features.
The Dude’s Key Features:
- Auto Network Discovery and Layout: Automatically discovers and organizes any type or brand of network devices within the network topology.
- Device and Link Monitoring: Monitors the status and performance of devices and network links, providing real-time notifications for any detected issues.
- Protocol Support: Supports SNMP, ICMP, DNS, and TCP monitoring for devices that support these protocols, enabling comprehensive monitoring capabilities.
- Individual Link Usage Monitoring: Monitors and graphs individual link usage, providing insights into network traffic and performance.
- Remote Device Management: Provides direct access to remote control tools for device management, allowing users to troubleshoot and configure devices remotely.
Unique Business Proposition
The Dude blends network topology mapping and syslog server to collect and manage logs from different devices. With this integration, you can get a holistic view of your network, making it easy to correlate events with device statuses.
Feature-in-Focus: Built-in Filters
The syslog server is built into the overall network monitoring capabilities, which means you have a ton of flexibility in configuration. You can set up filters based on source IP addresses, type of content, and even incoming messages. It supports regular expressions.
Why do we recommend it?
The Dude Syslog server is part of a network monitoring and analysis tool that is free to use. The Syslog server can be used to file or forward Syslog messages. The only problem with this is that the tool doesn’t handle other formats of log messages.

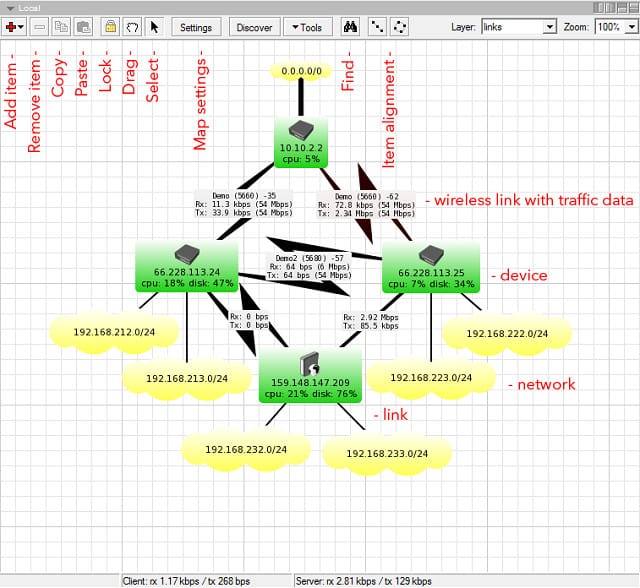
This system can monitor your network devices and collect Syslog data. It can process SNMP alerts, plus ICMP and DNS traffic. The Dude can monitor TCP traffic as well as UDP. The network monitoring features include autodiscovery and a network topology mapper.
The Syslog functions of The Dude can be accessed from a tab in the interface. The system can operate as a full Syslog server with extra forwarding and filtering capabilities. You can get The Dude just to send all records to a file, or specify rules to divert qualifying messages to other destinations, which might be separate event logs or the console of the system. You can also drop individual records and get the system to beep, flash, or display a popup message for custom alert conditions.
Who is it recommended for?
The Dude runs on Windows, so if you want to gather Syslog messages and file them on your Windows server, this is a good choice. You would need to forward messages to another server in order to consolidate Syslog messages with other log types.
During our testing, we identified the following pros and cons related to Dude.
Pros:
- Customizable Icons and Maps: Includes SVG icons for devices and supports custom icons and backgrounds, allowing users to create personalized network maps.
- Easy Installation and Usage: Features a straightforward installation process and intuitive user interface, making it accessible for users of all skill levels.
- Cross-Platform Compatibility: Runs on Windows and 32-bit Wine, ensuring compatibility with a wide range of operating systems.
- Cross-Platform Installation: Installs on Windows, Linux, and Mac systems, making it flexible and compatible across different operating systems.
- Free Version: Offers a free version for use, providing cost-effective log management solutions.
Cons:
- Limited Advanced Features: May lack some advanced features found in more comprehensive network management solutions or enterprise-grade monitoring platforms.
- Learning Curve: The interface can be challenging to learn, potentially requiring time and effort for users to become proficient.
The Dude performs actions when it detects a given alert condition, including the execution of commands. The Dude can send you an email or make a spoken announcement upon the detection of a custom alert condition.
8. SolarWinds Kiwi Syslog Server
Best for: Centralized log management
Relevant for: Organizations that handle extremely large volumes of syslog messages
Price: Free edition supports up to five devices, licensed version starts at $415

Kiwi is a syslog server utility from SolarWinds. The package costs $295, but there is a free version. You can use the system for free to monitor Syslog messages from up to five devices. The free package would only be suitable for small networks.
When we tested Kiwi Syslog Server we found the following key features.
SolarWinds Kiwi Syslog Server’s Key Features:
- Log Collection: Collects syslog messages from network devices, servers, and applications for centralized management and analysis.
- Real-Time Monitoring: Provides real-time view of network activity and potential issues through log messages.
- Log Filtering and Alerting: Enables filtering of logs based on severity, source, or keyword, and generates alerts for critical events.
- Log Reporting: Offers comprehensive reporting capabilities with historical data for trend analysis and troubleshooting.
- Search and Archive: Allows easy searching of archived logs for historical analysis and forensic investigations.
Unique Business Proposition
Kiwi Syslog Server supports the collection and analysis of syslog messages from SNMP traps and Windows event logs. It combines this data to provide a unified view of your environment. It also comes with features, like real-time log monitoring and archival.
Feature-in-Focus: Automated Response
With this tool, you can set up automated alerts and responses based on specific log events. The server will automatically trigger these actions, which include, sending emails to specific email IDs, running scripts, and forwarding messages to other systems.
Comparitech SupportScore – 8.9
SolarWinds is a company known for its financial stability and a wide range of product offerings. Its self-supporting documentation and customer satisfaction have also been excellent over the last many years. However, a cause of concern is its low employee job satisfaction score which could lead to possible gaps in customer service in the coming years.
Why do we recommend it?
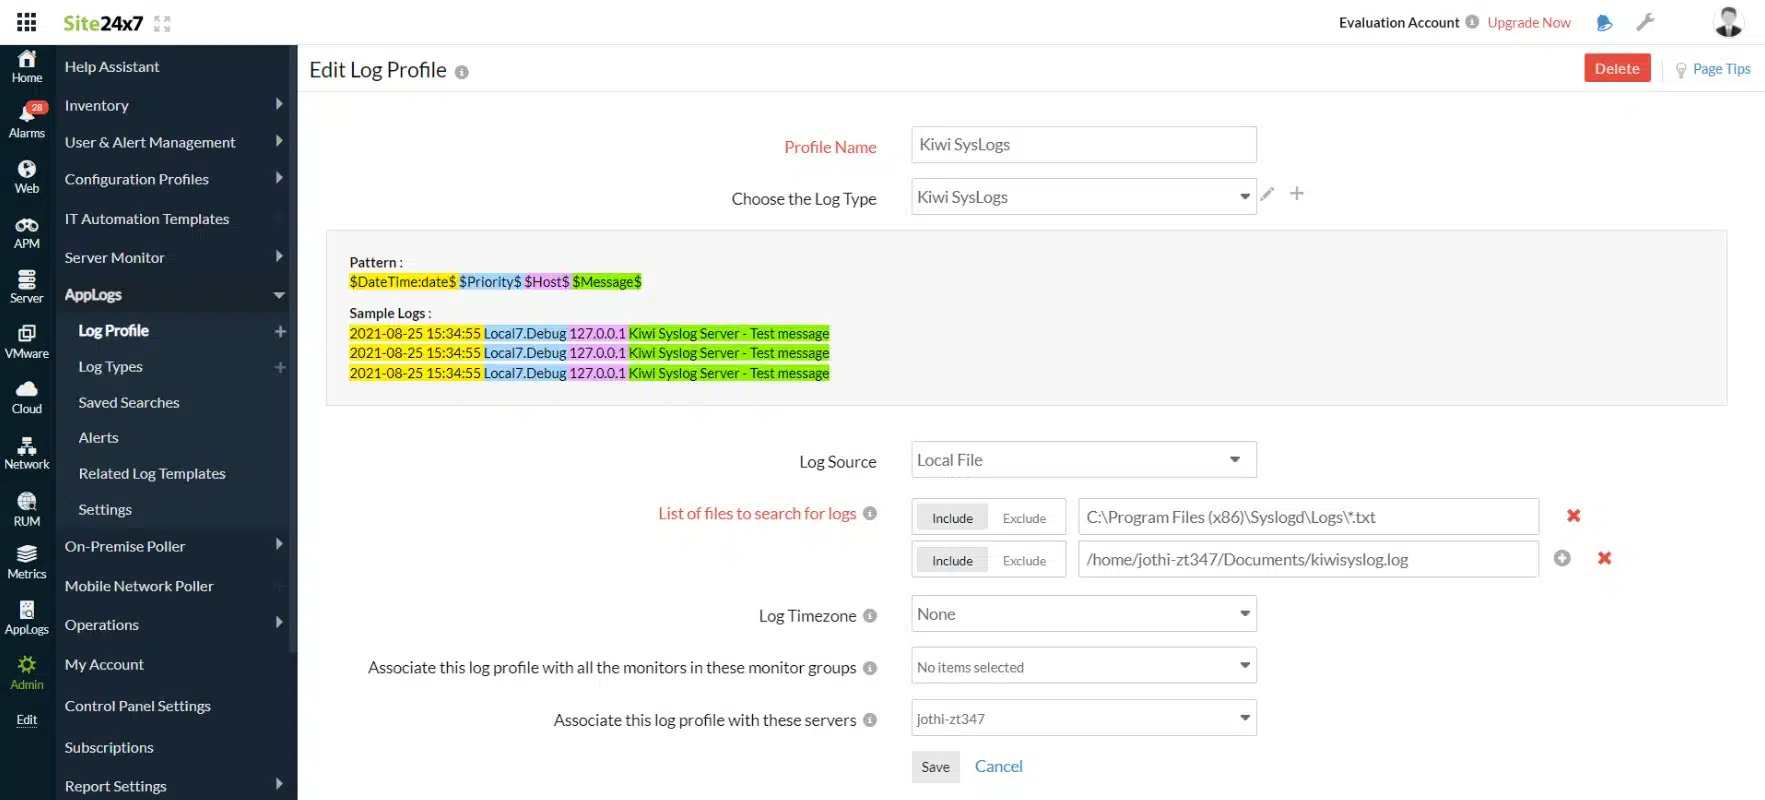
Kiwi Syslog Server Free Edition is a great service because you can get a paid tool for free. Although the paid version has a few more features, the Free Edition is a good Syslog collector that is able to store and also forward Syslog messages as well as other log formats.
The Simple Network Management Protocol (SNMP) is based on the Syslog methodology, so Kiwi can also gather SNMP messages. A device-originated alert message is called an “SNMP Trap.” The Trap is an exception to regular SNMP procedures in which devices’ agents only respond with statuses when queried by a manager program. So, Traps are designed to signify high-risk conditions. The package includes Kiwi Syslog Web Access, which is a Web interface that you host on your own server and gives access to the console of the Syslog server from anywhere through any standard Web browser.
Who is it recommended for?
Anyone can use the Kiwi Syslog Server to collect, view, and manage Syslog messages as well as SNMP Traps and Windows Events messages. Collecting log messages and filing them is an important requirement for data protection standards compliance.
During our testing, we identified the following pros and cons related to Kiwi Syslog Server.
Pros:
- Freeware Version: The availability of a freeware version makes it accessible for smaller networks and budget-conscious users.
- Lightweight: The software is lightweight and resource-efficient, allowing it to run on modest hardware configurations without impacting system performance.
- Customization: Offers extensive customization options for log filtering, alerting, and reporting to tailor the solution to specific organizational needs.
- Cost-Effective: Kiwi Syslog Server is competitively priced, making it an affordable option for organizations of all sizes.
Cons:
- Limited Log Analysis: Lacks advanced log analysis capabilities compared to some SIEM solutions.
- Support: Some users have reported mixed experiences with SolarWinds customer support, particularly for resolving technical issues or customization requests.
The Kiwi system enables you to write event logs by IP address, date or by message source type. You can get alerts on high traffic conditions sent to your email notifications. However, if you get the paid version there are many more conditions that you can elect to be notified about by email. The Kiwi Syslog Server is only available for Windows. It can be installed on Windows Server 2008 R2, Windows Server 2012, Windows 7 SP1, Windows 8.1, Windows 10, and Windows 11.
Kiwi Syslog Server is great for collecting, viewing and archiving syslog messages and SNMP traps. With a variety of filters and real-time logging windows, you can closely monitor your network and send daily email summaries. The free version is limited to 5 devices, but the full version, at only $295, is far more powerful with actions like sending emails, running programs and sending logs to a database. For both large and small networks, this is a great choice of Syslog server.
If you are tooling up a network management team, you are going to need a lot more than just the Kiwi Syslog Server. In these circumstances, consider the Small Business Network Management Bundle. This gives you the Kiwi Syslog Server plus three more systems management modules. The first of these is the Engineer’s Toolset, which is actually a bundle of more than 60 system management utilities. You also get the Network Topology Mapper and Kiwi CatTools, which manages network device configuration backup. This package runs on Windows Server and you can get it on a 14-day free trial.
9. Visual Syslog Server
Best for: A lightweight tool for Windows environments
Relevant for: Administrators who need a GUI-based tool with real-time log monitoring and customizable alerting
Price: Free
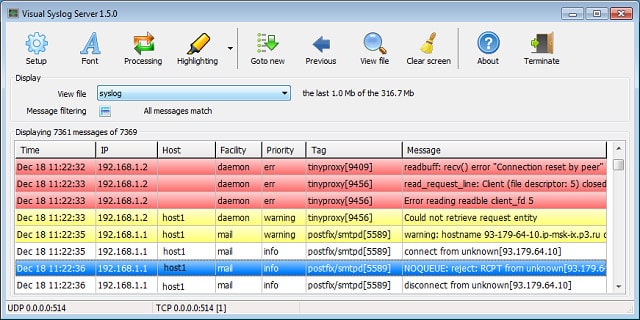
Visual Syslog Server is a small utility that collects Syslog data and displays them in a viewer. The records can also be written to event logs and rotated by date or file size. This application can be installed on Windows and it is available for free. The software can be installed on Windows XP and above and also on Windows Server 2003, 2008, and 2012.
When we tested Visual Syslog Server we found the following key features.
Visual Syslog Server’s Key Features:
- Protocol Support: Receives syslog messages from various devices via UDP or TCP protocol, compliant with RFC 3164 standards.
- Real-Time Display: Syslog messages are displayed in real-time, providing immediate visibility into network events and system activities.
- Message Storage: Stores syslog messages in files on disk, allowing for archival and historical analysis.
- Log File Management: Supports log file rotation by size or date, ensuring efficient storage management and preventing file bloat.
- Filtering Options: Filters displayed syslog messages based on various criteria such as facility, priority, host, source address, tag, or message contents.
- Email Alerting: Supports sending email notifications via SMTP server with authentication SSL/TLS, allowing for instant delivery of alarms.
Unique Business Proposition
This is a free and open-source syslog server that displays syslog messages in a way that’s easy to read and understand. Its features, like color-coding, message filtering, and customizable notifications, help find exactly what you need. It supports both UDP and TCP protocols and adheres to the RFC 3164 standards.
Feature in Focus: Real-Time Log Monitoring
A highlight of this tool is its live view that automatically switches to the newly received message pane as soon as a new message is delivered. With this option, you can get real-time views of messages as they occur. Additionally, you can also create filters and generate notifications when needed.
Why do we recommend it?
Visual Syslog Server collects Syslog messages, which are usually generated on Linux systems but this tool runs on Windows. So. this is a great tool to get your Syslog messaging over to the Windows operating system and file them. The utility includes a data viewer that lets you filter and sort messages.
In the dashboard, records are color-coded with error messages in red and warnings in yellow. Those colors can be customized. You get real-time views of the messages and you can also load records into the viewer from files.

Although this utility doesn’t have sophisticated graphics or message processing options, it is lightweight and fast, so it has a market. The viewer presents records and allows you to filter them and sort them. The interface can be set to play a sound when an alert condition is encountered. You can also set the application to send you an email when it encounters an alert or a warning. If your email system supports encryption, Visual Syslog Server will encrypt the notification emails that it sends to you.
Who is it recommended for?
Visual Syslog Server is free to use, so it will appeal to small businesses. You can set it up to provide you with alerts on factors such as throughput level variation or for the arrival of specific message codes.
During our testing, we identified the following pros and cons related to Visual Syslog Server.
Pros:
- Lightweight and Fast: Lightweight and highly efficient, providing fast performance even in demanding network environments.
- Platform Compatibility: Runs as a Windows application, compatible with Windows XP/Vista/7/8/8.1, and Windows Server 2003/2008/2012.
- User-Friendly: Easy to install and use, requiring no adjustment or configuration.
- Open Source: Free and open-source software licensed under the GPL V2, offering transparency and flexibility for customization.
Cons:
- Limited Advanced Features: May lack some advanced features found in more comprehensive syslog server solutions, such as advanced reporting or integration capabilities.
- Windows Only: Runs exclusively as a Windows application, limiting compatibility with other operating systems.
- Lacks Scalability: Better suited for smaller networks as features may not work as effectively at scale, limiting scalability.
This is a handy, free, ready to use strong Syslog tool that gets the job done.
10. Nxlog
Best for: Wide compatibility with SIEM products
Relevant for: Organizations using SIEM and log analytics solutions in a multi-OS environment
Price: Negotiated pricing, but the Community Edition that we recommend is free
This review includes Syslog server programs that can be installed on Windows and/or Linux, Unix and Android. Nxlog can be installed on either of those operating systems and also on Unix and Android. Whichever operating system you install this system on, it will be able to collect Syslog data from all the others — Unix, Linux, Windows, and Android.
When we tested Nxlog we found the following key features.
Nxlog’s Key Features:
- Flexible Log Formats: Accommodates various log formats, such as syslog, JSON, CSV, and custom formats, ensuring compatibility with different log sources.
- Wide Range of Log Sources: Supports many different log sources, including system logs, application logs, network device logs, and more, enabling comprehensive log collection from across the enterprise infrastructure.
- Multithreaded Architecture: Utilizes a multithreaded architecture for efficient processing of large volumes of data.
- Enhanced Security: Provides features such as encryption, authentication, and access controls, enhancing security posture and compliance adherence.
Unique Business Proposition
NxLog is known for its native support for multiple operating systems like Windows, macOS, Linux, Oracle Solaris, AIX, and OpenBSD. It collects audit logs from these operating systems and combines them to provide unified views.
Feature-in-Focus: Extensive Integrations
One of the most notable features of NxLog is its integration with a wide range of platforms and applications. Using NxLog, you can ship data to any SIEM or log analysis tool. You can even send the same events to multiple destinations at the same time. There is no vendor lock-in as well.
Why do we recommend it?
NXLog is a paid tool but we recommend its free counterpart, which is called the NXLog Community Edition. This service is able to connect Windows Events as well as Syslog. It will consolidate these different log files into a common format. You can set the system to file log messages or forward them to another log processor.
Nxlog is a straightforward message collection system. It can operate over UDP and TCP and it can receive messages protected by TLS encryption. Messages get written to files and can also be stored in databases. In all cases, Nxlog creates a standard record format that unites data from disparate sources. A multithreaded architecture enables this tool to handle hundreds of thousands of messages per second, making it suitable for all sizes of a network.

Who is it recommended for?
Any business could use NXLog Community Edition but it does need a little setting up, so very small businesses with no technical skills on site might struggle. Very large companies that require professional support guarantees with their software purchases should consider the NXLog Enterprise Edition.
During our testing, we identified the following pros and cons related to Nxlog.
Pros:
- Multi-Platform Support: NXLog offers a multi-platform log collection solution compatible with various operating systems, including Windows, Linux, and Unix, providing flexibility for diverse IT environments.
- Active Community Support: Benefits from an active user community, online documentation, and technical support resources, providing assistance and guidance to users
- Platform Support: Supports Windows, Unix, Linux, and uniquely Android platforms, offering flexibility in deployment options.
- Lightweight Application: Utilizes minimal system resources, making it suitable for resource-constrained environments.
- Open-Source: Completely open-source and free, providing cost-effective log management solutions.
Cons:
- Barebones Interface: The interface is barebones and lacks many features found in similar tools, potentially impacting usability.
- Not a SIEM: NXLog itself is not a log management or analysis tool. It requires integration with a SIEM or another destination for further processing.
The Nxlog system is open-source and you can use it free of charge. There aren’t any analytical functions in this tool, so if you want to view records or manipulate them in any way, you will need to find a separate front end for analysis. This is a straightforward message collection and logfile creation facility, making it a pure Syslog server.
11. Logstash
Best for: Log aggregation and transformation
Relevant for: Organizations that want to centralize logs from multiple sources and analyze them in real-time
Price: Negotiated pricing
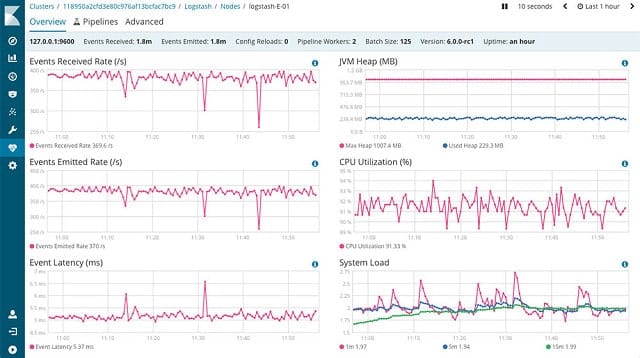
Logstash is part of a suite of utilities called “Elastic Stack.” This group of tools is produced by a group of developers whose first product is called Elasticsearch. Elasticsearch is a second element in the Elastic Stack, as is Kibana. The division of labor between these three packages is that Logstash collects log messages, Elasticsearch enables you to sort and filter those messages for analysis, and Kibana interprets and displays the data. All of the Elastic Stack programs run on Linux.
When we tested Logstash we found the following key features.
Logstash’s Key Features:
- Log Collection: Collects, processes, and transforms log data from various sources, including servers, applications, and network devices.
- Filtering: Filters and enriches log data using a wide range of plugins and configuration options, enabling users to extract valuable insights and identify patterns.
- Cloud Data Collection: Supports gathering information from cloud sources like AWS, providing flexibility in data collection.
- Elasticsearch Filtering: Uses Elasticsearch for filtering, offering one of the most flexible search tools available for data analysis.
- ELK Stack Integration: Part of the ELK (Elasticsearch, Logstash, Kibana) stack, providing comprehensive log management capabilities.
Unique Business Proposition
Logstash is an open-source data processing pipeline that can ingest data from different sources, analyze it, and send the results to an application or output you require. It works well across different data, regardless of their format or complexity. It can even anonymize or exclude certain fields, making it ideal for handling sensitive information.
Feature-in-Focus: Pipeline-based log processing
Using Logstash, you can define pipelines to meet your specific requirements. You can decide the input formats, how they must be processed, and in what format the output must be sent, and to where. Such flexibility makes it ideal for almost any situation and environment.
Why do we recommend it?
Logstash is a very powerful log processing system and it is part of a suite of tools, called the Elastic Stack, or ELK. Using Logstash, you can collect and consolidate logs in Syslog and Windows Events formats as well as many application logs. This tool can also collect log messages from cloud systems, including AWS, Salesforce, and Twitter.
Kibana makes a great front-end for any of the other Syslog servers in this list. As the event message collection service for the stack, Logstash operates as a Syslog server. The utility listens on the network for messages sent from a wide range of sources. To record a specific stream, you need to install a plug-in for that data type. You can just install the Syslog plug-in, or add in other plug-ins to include other data sources.

Logstash also gathers data from cloud services including AWS. It can collect data from applications such as Ganglia, Salesforce, Graphite, Kafka, and Twitter. You can set the collection process to include TCP and UDP messages and it can receive messages encrypted with TLS. Logstash can read messages from a file, from a database, pick up SNMP messages, IRC and RSS feeds, and get messages from mail servers.
Who is it recommended for?
Logstash and all of the ELK products offer opportunities to build your own application with ease and there are many commercial adaptations of these tools out on the market. If you don’t know much about technology, the ease of use of these tools makes setting up Syslog collection very easy. Large corporations with technical staff should jump on this package. There is a paid, cloud version of the ELK suite available.
During our testing, we identified the following pros and cons related to Logstash.
Pros:
- Open Source: Licensed under the Apache License 2.0, Logstash is open source and free to use, fostering community collaboration and innovation.
- User-Friendly Interface: Features a great user interface with a highly visual design and an easy-to-navigate toolbar, enhancing usability.
- Real-Time Processing: Provides real-time data processing capabilities, enabling organizations to monitor and respond to log events as they occur.
- Part of Elastic Stack: Integrates with the Elastic Stack, leveraging a large open-source community for support and enhancements.
Cons:
- Maintenance Overhead: Maintaining and troubleshooting Logstash deployments may require ongoing effort and expertise, particularly in distributed and high-availability setups.
- Dependency on Other Components: Logstash’s integration with other components of the Elastic Stack means that changes or issues in one component can affect the overall system’s functionality and performance.
Logstash can filter, divert, and reformat messages during processing. The program stores records in files or inserts them into databases. The utility is written to integrate with Elasticsearch and can send data directly to that application. Similarly, Logstash can be set to output data to Loggly, Nagios, AWS, Graphite, and Graylog. Other plug-ins will notify you of new log data by email or by Slack message. Logstash is available free of charge.
12. TFTPD32/64
Best for: Lightweight Syslog monitoring for Windows
Relevant for: Organizations that require a free and simple-to-use syslog server
Price: Free
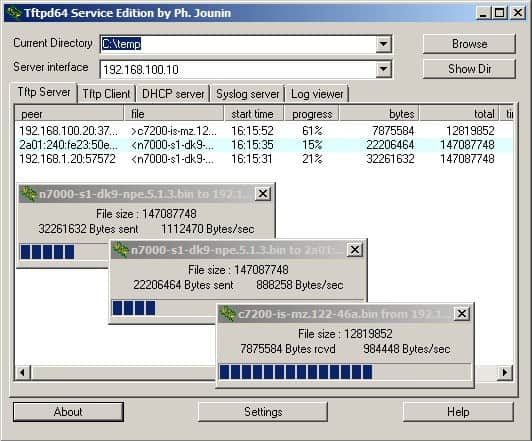
TFTPD is a small utility for Windows. The package is available as a 32-bit or a 64-bit application. The central element of this software is a TFTP client implementation. That client can be set to receive network messages from DHCP, DNS, and SNTP servers. It is also able to receive Syslog data.
When we tested TFTPD we found the following key features.
TFTPD’s Key Features:
- Multi-Server Functionality: Tftpd64 includes DHCP, TFTP, DNS, SNTP, and Syslog servers, providing a comprehensive suite of network services in a single application.
- IPv6 Readiness: Supports IPv6 protocol, ensuring compatibility with modern networking environments and future-proofing network infrastructure.
- TFTP Client and Server: Offers a fully compatible TFTP client and server with support for TFTP options such as tsize, blocksize, and timeout, optimizing data transfer performance.
- Extended Features: Includes advanced features like directory facility, security tuning, interface filtering, progress bars, and early acknowledgments.
- DHCP Server: Provides a DHCP server capable of automatic or static IP address assignment, ensuring efficient network management and connectivity.
Unique Business Proposition
This is a simple and lightweight tool that combines many network services, like TFTP, DHCP, DNS, and a Syslog server. Its simple GUI and lightweight design make it a good choice for individuals and small organizations that need to process a limited number of Syslog messages, without going through an extensive setup and configuration.
Feature-in-Focus: File Saving Capability
When you activate the Syslog settings, it will automatically receive Syslog messages through UDP port 514 and display them on the GUI. You can even configure it to save the logs in a specific file format. This feature can be particularly helpful for troubleshooting IP phones and routers.
Why do we recommend it?
TFTPD is a free utility that runs on Windows and is nominally a client and server for use with the Trivial File Transfer Protocol (TFTP). However, the tool has other utilities built in and one of those is a Syslog server. Although this package includes a log viewer and a setting that will store Syslog messages, it doesn’t collect Windows Events and it can’t perform consolidation.
This is a simple open-source utility that displays messages in the dashboard as they arrive. Buttons over the viewer give you the ability to view messages by type and Syslog is one of the message types that can be featured. You see messages as they travel on their way to event logs and the viewer also names the file that Syslog messages should be stored to. This utility doesn’t give you much functionality for data analysis. However, you can also read in records from a file and then you have the ability to sort and filter messages.
Who is it recommended for?
TFTPD is a handy free utility for a system administrator to have to hand. However, the tool is getting a little dated and there are more powerful free Syslog servers on this list that provide more features.
During our testing, we identified the following pros and cons related to TFTPD.
Pros:
- GUI and Command Line: Provides both graphical user interface (GUI) and command-line interface options for flexibility in configuration.
- Windows Service: Available as a Windows service, allowing for seamless integration and automated deployment in Windows environments.
- Lightweight and Open Source: Tftpd64 is a lightweight and open-source application, offering flexibility, transparency, and ease of use.
- Ease of Use: Offers a user-friendly interface and straightforward configuration options, making it accessible for users of all skill levels.
Cons:
- Limited Platform Support: Tftpd64 is primarily designed for Windows environments, limiting its compatibility with other operating systems.
- Lack of Data Analysis Tools: Does not provide data analysis tools, limiting its capabilities for in-depth log analysis and monitoring.
- Outdated User Interface: The user interface is outdated, potentially impacting usability and user experience compared to more modern solutions.
TFTPD can work with IPv6 addresses as well as IPv4 addresses. TFTPD32 and TFTPD64 are both available for free.
What you need to know about Syslog Servers and Clients
The concept of a “Syslog server” really refers to an application that deals with syslog messages rather than the provision of a dedicated computer to receive the messages. So, don’t get misdirected by that “server” word in there.
The server/client model is a little difficult to grasp in Syslog terms, too. Usually, the client contacts the server and the server responds. In syslog, the syslog client is just a program that broadcasts error, warning, and debugging messages. The syslog client doesn’t have any direct contact with a counterpart: it sends out the messages whether or not anyone is listening for them. Syslogd is a daemon. This is a Syslog collector and so is judged to be the server, even though it never responds to the originator of the messages. The daemon may be running locally, or it can also be implemented as a remote syslog server by connecting over the internet.
Although the Syslog standard has been codified by the Internet Engineering Taskforce, there are so many implementations of Syslog that some variation in the syslog data message format exists. With all of the different message types you could be benefiting from, you need to get a tool to sort through them all.
The definition of the Syslog standard is freely available to the public but it is not regarded as an “open source project.” This is because “open source” usually refers to freely available program code, but Syslog is a standard, rather than a program. However, there are open source Syslog server implementations.
Syslog and Windows
The Syslog standard was written for Unix and it is also available for Unix-like operating systems, including Linux and Mac OS X. Syslog is also used by many network devices for error reporting. Syslog doesn’t operate on Windows. The Windows operating system has its own log messaging system, called Events.
The division of log systems between Windows and Linux into two separate and incompatible standards shouldn’t cause you a problem. You can unify these log file messages in one central location so security software, such as intrusion detection systems can get a system-wide view of events.
Network equipment will automatically broadcast Syslog messages on the network. That means that any device can pick the messages up. The Syslog standard specified that log messages should be circulated to UDP port 514 or TCP port 1468. The destination of messages on a Linux server is dictated by the syslogd or syslog-ng configuration file. These can be directed to the network on the well-known UDP or TCP port.
Once you have the Syslog messages circulating on the network, software running on Windows can pick them up, so you don’t have to stick to Syslog server software for Linux to collect these important messages. Many excellent Syslog servers are written to run on Windows.
Syslog Messages
Syslog messages can be regarded as the Linux/Unix equivalent of Windows Event Logs. So, you could refer to them as “Syslog events.” They supply the essential information and will support your system administration tasks through:
- Warnings of equipment failure – which get written to a log file
- Capacity exhaustion monitoring – through pre-set warning levels which you set yourself
- Alerts of unexpected events – abnormal activity may indicate compromised user accounts
- Network intrusion detection – spot unauthorized devices and access to unexpected locations on the internet
The records in your syslog files are written there because the producers of your software and devices judged certain events to be of significance, so it is a mistake to ignore this rich source of system activity and status information. So download a Syslog collector and activate it.
Syslog Port Numbers
Syslog operates over UDP, so expect activity on UDP port 514 of your network devices. This is caused by all of those Syslog event messages circulating around your network. UDP port 514 is used by Syslog clients to send messages and also by Syslog servers to listen for messages. Therefore it is both the source and destination port on all standard Syslog communications. Don’t close it. Be suspicious of activity on TCP port 514. This is a port known to be used by the ADM worm and it is not used for Syslog.
There are secure Syslog implementations. A secure Syslog service needs to establish a connection, you cannot use a UDP port for them. The secure version of Syslog is known as Syslog over TLS and it uses TCP port 6514. If you want to operate a remote Syslog server connecting to a network across the internet, you need to go the Syslog over TLS route because unencrypted Syslog events being sent over the internet would seriously undermine your network security.
Choosing Syslog server software
As you can see from the description of the tools in our list, you can choose a straightforward Syslog server, or opt for an analytical tool or a network monitoring system that incorporates Syslog server functions.
Beyond the basic functions of transferring Syslog messages to files, you can look for the capabilities to sort and filter messages. The ability to vary processing according to message types and drop debug messages and information notifications is useful. A programmer might need to see those debug messages, and so the ability to selectively direct message types to a viewer, a log file, or to a database can be very useful.
The evolution of Syslog processing to store records in a database rather than a file offers you great power. It is far easier to index, sort, search, and filter records in a database than it is to manipulate file records. This is because databases include a structured query language that enables you to isolate fields in records and perform selection, grouping, and exclusion functions on data without altering the original stored records.
Another useful advancement in the Syslog servers available today is a system that can collect messages generated by other platforms and protocols, such as the Windows event logger. If your Syslog server can create standardized record formats, that takes you another step further along the route to collect important information about your system.
Getting alerts created for the conditions reported by Syslog will also give you extra power to focus your energy on essential tasks. The ability to create your own alert conditions represents an advancement in Syslog processing. Sometimes, the contents of a message might not create concern. However, a sudden surge in the frequency of such messages should become an alert and you can specify such conditions in many of the Syslog servers listed in this full review. The ability to combine a count of message types or error conditions is another useful feature that many modern Syslog servers include.
A Syslog server embedded in a network centralized management tool can provide excellent analysis capabilities. If you already have all the analytical tools you need, then you would be better off focusing on the vanilla Syslog server tools in this review. However, if you have very little budget for system management software and you don’t currently have any analytical tools, then go for a free system management utility that includes a Syslog server to keep control of your IT infrastructure.
Managing IT services requires proper tools. Take a look at the free software recommended in this full review that fits your operating system. Our Editor’s choice is an excellent place to start and the SolarWinds Kiwi Syslog Server is a comprehensive logging tool. Take a little time to play around with each tool so you can discover their features for yourself. Given that all of these tools are free, you have nothing to lose but the time it takes to learn them.
Our Methodology for Selecting Syslog Servers
We follow a strict methodology to pick our top list from hundreds of options available in the market. Our experts test every software where possible, read through user reviews, analyze real-world implementations, and do a deep dive into the features. After such extensive work, we considered the following aspects:
1. Protocol Support and Compatibility
We looked for tools that support multiple protocols, like UDP, TCP, and TLS. Additionally, we also prioritized cross-platform compatibility with Windows, Linux, and Unix, so it can support more devices in your network.
2. Log Management Capabilities
The Syslog servers we picked have extensive log management capabilities. Besides the basic functions of collecting and storing log data, our tools can also filter and parse content. Additional importance was given to features like real-time alerting, log forwarding, archival options, customizable retention policies, and more.
3. Performance
Performance is another key factor, and our top loads can take heavy loads to provide accurate results. We looked at metrics like ingestion rates, indexing speeds, and the ability to scale across multi-device environments.
4. Integration and Automation
We gave importance to tools that could automate processes, like alert triggers and script execution. Also, integration with SIEM tools and monitoring systems is another plus.
5. User Interface
At Comparitech, we are big fans of a simple interface, as it can increase adoption among users with different levels of technical skills. In this case, we also included solid documentation and easy configuration in our evaluation.
Broader B2B Software Methodology
The above aspects fall in line with our broader B2B methodology, where we evaluate the different features of a software and its “fit” in addressing the pain points that it can solve. Also, factors like usability, vendor stability and support, use of advanced technologies to update product lines, and applicability across industries help us in deciding the right set of tools for each category.
Click here to learn more about our B2B methodology.
SupportScore Methodology
At Comparitech, we have a proprietary SupportScore. This is a weighted score ranging from 0 to 10 that’s given to every vendor based on factors like the availability and responsiveness of the support team, funding and income levels that reflect financial stability, availability of self-supporting documentation, and more.
Read more about our SupportScore methodology.
Why Trust Us?
Now comes an important question – why should you trust our reviews?
The simple answer – we are authentic and strive to address your problems.
We are strong believers in technology and use our combined expertise in different tech fields to analyze a product’s features and understand its ability to resolve the problems that matter. Our analysis goes beyond just a feature overview and includes in-depth research and a hands-on try-out where possible. With such a strict methodology, you can rest assured that our reviews are factually correct.
Syslog Server FAQs
How do I access my Syslog server?
The access method for a Syslog server depends on your operating system and the specific Syslog server that you chose to install. On Linux, the Syslog server is more likely to be a command line utility. If you have a Linux flavor with a graphical interface, such as Ubuntu, you might be able to have a GUI Syslog server package.
GUI interfaces are very common for Windows-based Syslog servers. In these cases, the installer may well have created a shortcut icon on your Desktop. If you don’t see it there, click on the Start menu button and search through that list of available programs.
How do I create a Syslog server?
Syslog is a Linux utility, so it is better to create a Syslog server on a Linux machine:
- Install syslog-ng, which you can get from here. On Debian, you don’t need to download the utility. Instead type at the command line:
apt-get install syslog-ng
On RHEL, enter:
yum install syslog-ng
- Locate /etc/syslog-ng/syslog-ng.conf and make a backup of it then edit it. Alter the configuration settings so the options look like:
options {(off); flush_lines(10); use_dns(persist_only); use_fqdn(no); owner("root"); group("adm"); perm(0640); stats_freq(0); bad_hostname("^gconfd$"); normalize_hostnames(yes); keep_hostname(yes); }; - Create a listener with the flowing line in the configuration file:
source s_net { tcp((ip(127.0.0.1) port(1000) max-connections 5000)); udp (); }; - Set up a destination for the syslog messages. You can actually set up redirections for each source of message to different log file names. Here is an example line:
d_net_syslog { file("/var/log/syslog/remote/$HOSTNAME/syslog.log"); }; - Save the configuration file.
Those are the basic steps to start collecting Syslog messages and storing them to a file. You can get more sophisticated by adding in filters to direct messages to different files or add in explanations of each recorded event.
What is the default Syslog facility level?
The default Syslog facility level is Local4
How do I memorize Syslog levels?
The Syslog levels are:
- Emergency (0)
- Alert (1)
- Critical (2)
- Error (3)
- Warning (4)
- Notifications (5)
- Information (6)
- Debug (7)
Create a mnemonic to remember these. Take the first letter of each level type and make a memorable phrase with words that start with the same first letters. So, E, A, C, E, W, N, I, and D won’t make a meaningful word, but create a sentence that you can’t forget easily, put your name in there if it starts with one of those letters.
What is a Syslog server?
A Syslog server receives files sent by Syslog clients or sends out files in response to requests. The files are formatted following a protocol called Syslog, which defines the fields in each log message.

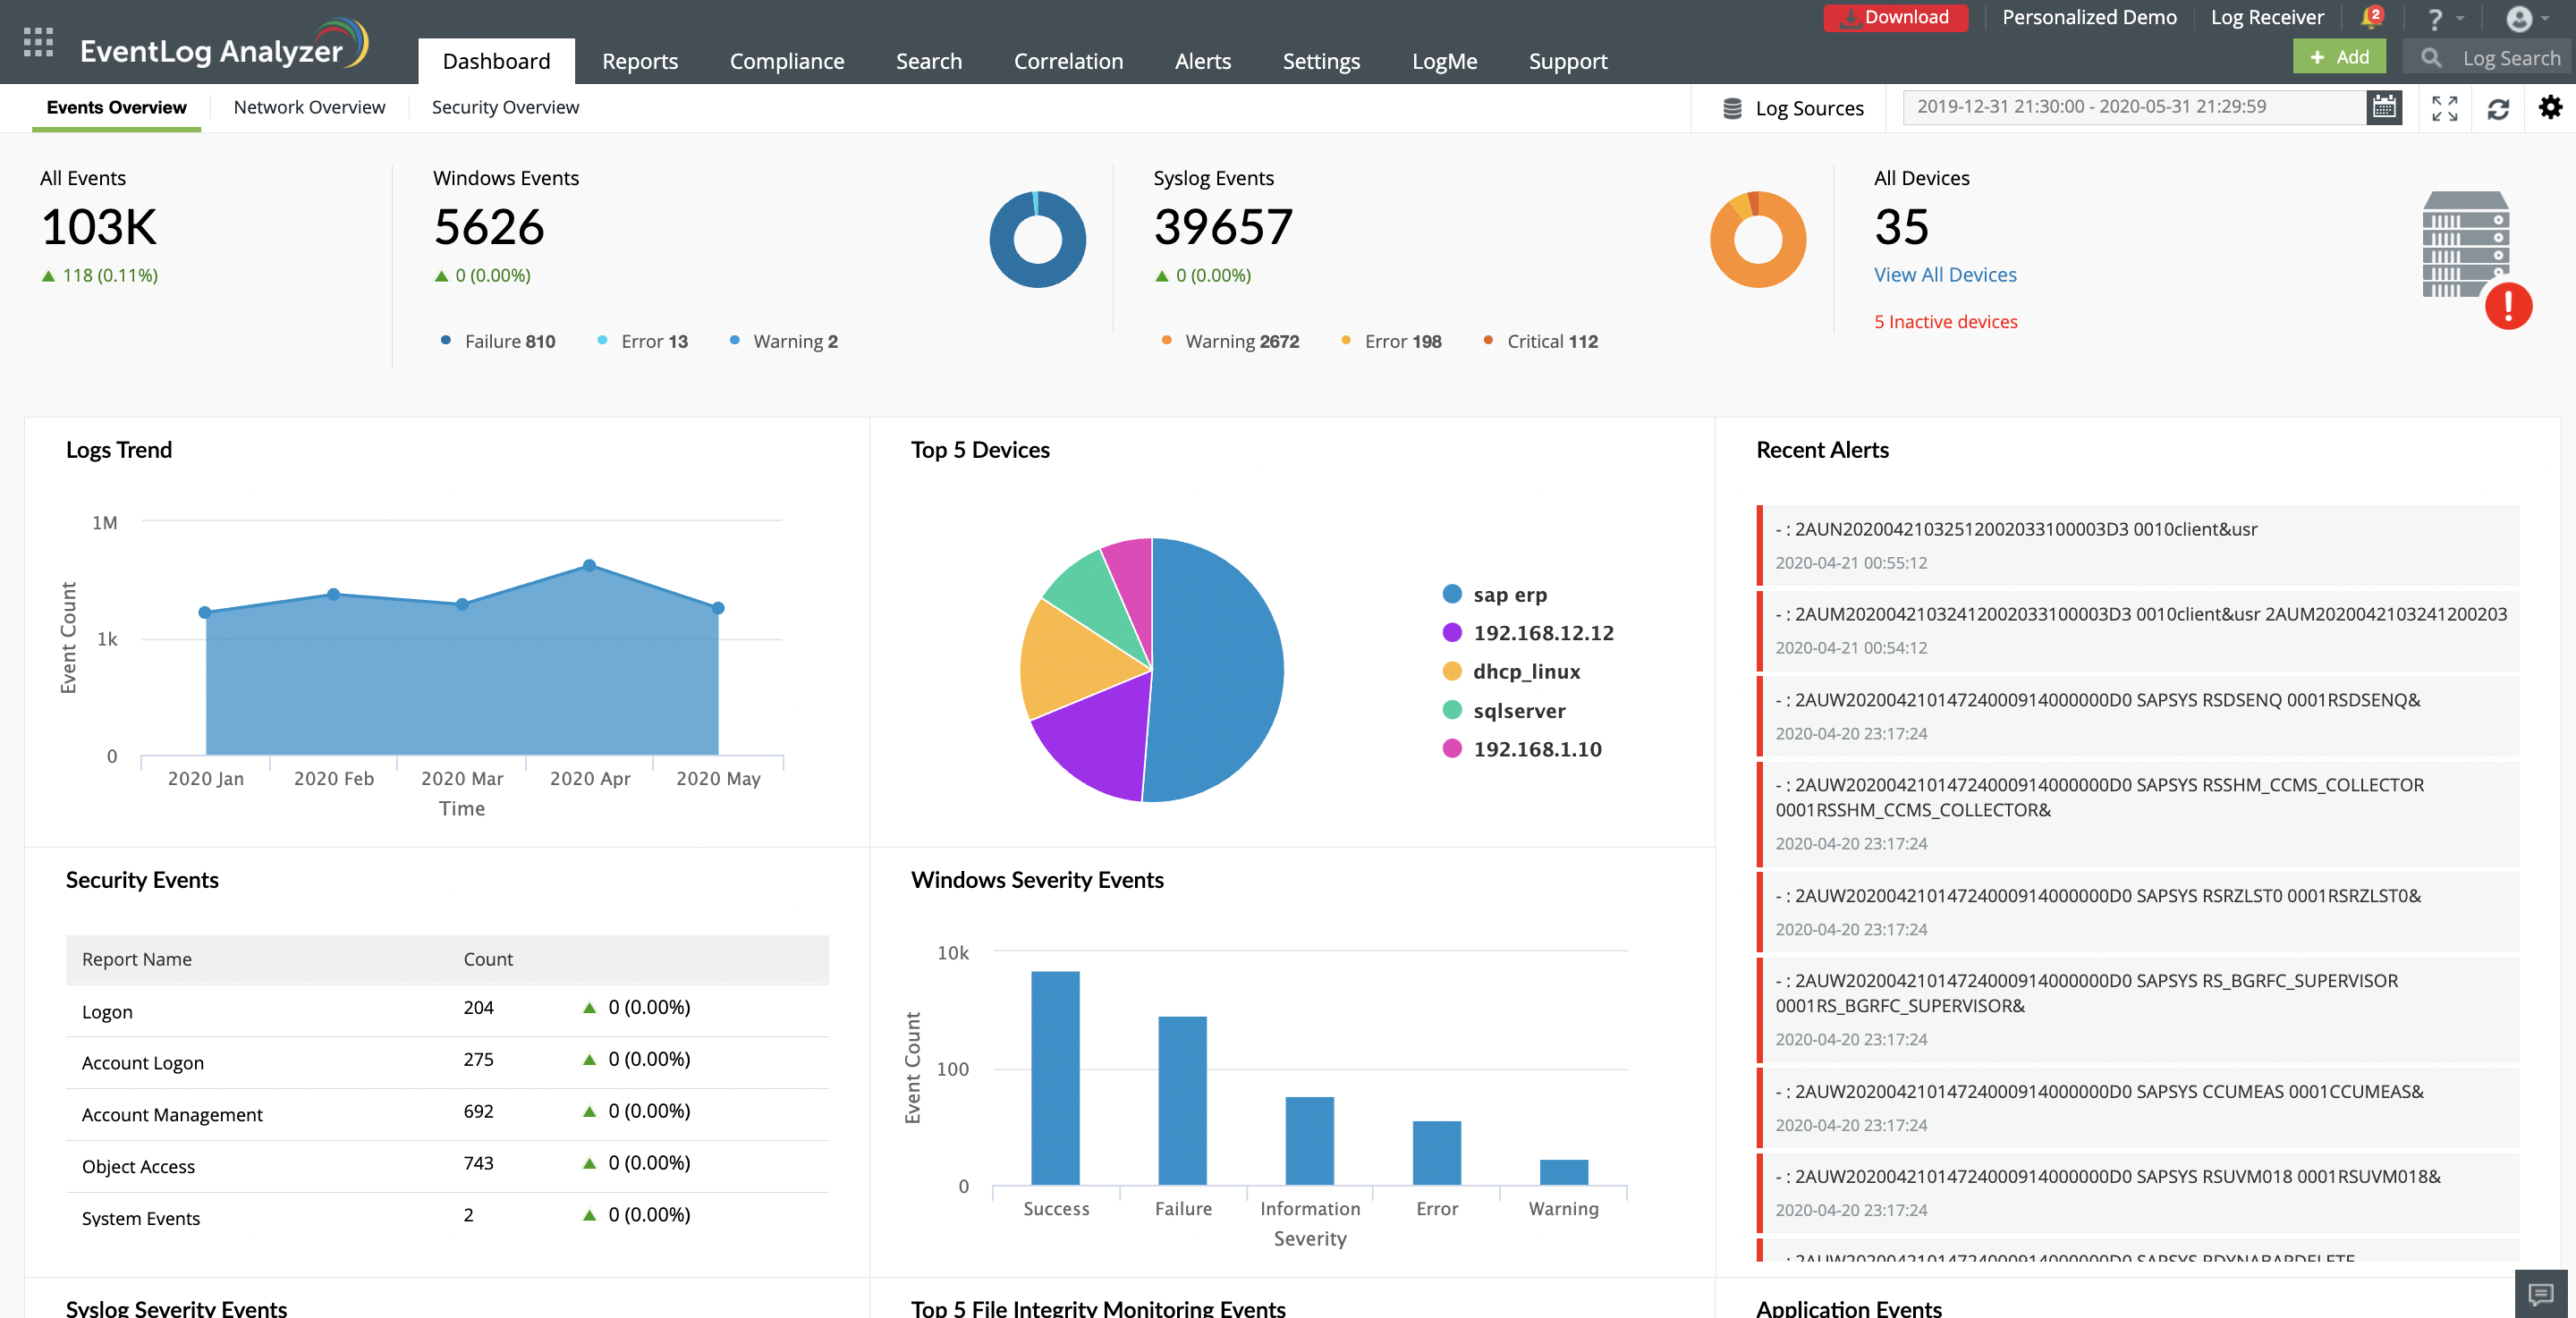
I use Syslog Watcher because it is effective for collecting and storing syslog messages from your router. It is great for managing all of your system messages on one computer. I really like the control dashboard as it gives you several options on how to process messages.
SylogWatcher is a great product. There are few products out there that have such a clean interface. It’s as stable as these apps come. Thanks
Over the last few years I’ve investigated a handful of syslog servers for home use.
However, Syslog Watcher (originally obtained under SnmpSoft Company guise) has remained the installed product which has fitted with my requirements.
It’s a lightweight installation, which is just showing filtered syslog messages in its own little window (no need to install a heavyweight NMS).
Easy to remove some noise from the displayed list. Don’t want to see debug/info messages? (click-click). Drill down to logs for a particular device? (click-click)
Also add rules to colour-code based upon contained text to make some entries stand out.
There’s the option for remote viewer installation too – which works in the same way, but without the need to be at the ‘server’ (in my case, a fanless low-powered device).
Other options for backup schedule/email alerts & exports via text & DB.
It’s certainly worked well for me with a mere 5 devices in there, but I’m sure it would scale well.
syslogwatcher.com
I have tried multiple Syslog Servers, and my favorite one without a doubt is the NETMAN
wisoft.pl
That tool looks interesting, but I don’t see any Syslog server built into it.
syslog watcher is not free. it should be removed from the list
Hi, Anton,
Thank you so much for your help with this. I realise that as a business user, it is annoying to read articles about free tools that aren’t entirely accurate. I have put an UPDATE on the end of the section on Syslog Watcher to explain that it is only free for home use. Business users can get a 30-day money-back guarantee, however.
I have tried multiple Syslog Servers, and my favorite one without a doubt is the Syslog Watcher. The thing I like the most is the ease of filtering messages. You guys you tried it out!
syslogwatcher.com