
Databases don’t get any more advanced than PostgreSQL. However just like any other database, PostgreSQL needs to be managed closely to keep the database up and running.
The group of monitoring tools for PostgreSQL is slightly more narrow than many other leading database providers.
Here is our list of the best PostgreSQL monitoring tools:
- Paessler PRTG Network Monitor (FREE TRIAL) Network, server, and application monitor that includes a specialist sensor for PostgreSQL databases. Start a 30-day free trial.
- ManageEngine Applications Manager (FREE TRIAL) This package monitors PostgreSQL, many other DBMSs plus any custom or packaged application. Available for Windows Server, Linux, AWS, and Azure. Start a 30-day free trial.
- Site24x7 (FREE TRIAL) This cloud platform offers plans that combine the monitoring of networks, servers, services, applications, and websites and has a special plug-in for PostgreSQL integration. Start a 30-day free trial.
- Datadog PostgreSQL Performance Monitoring A cloud-based monitoring package that tracks the performance of all resources up from the server’s physical properties up to user-facing software. An integration available with this package adds on specialized screens and data-exchanging capabilities to interact with and monitor PostgreSQL databases.
- Sematext PostgreSQL Monitoring This monitoring system is part of an Infrastructure Monitoring package that offers full-stack visibility alongside database performance tracking. Available as a SaaS package or for hosting over Docker.
- AppDynamics Database monitor that can watch PostgreSQL, among others, and allows a full view of database transactions right down to code efficiency.
- SolarWinds Server & Application Monitor An extensive database monitor for PostgreSQL, MySQL, Apache, MongoDB, Tomcat, and Cassandra databases.
- ClusterControl A database monitoring tool that can supervise PostgreSQL databases. Available in free and paid versions.
- pgAdmin Free, open-source PostgreSQL management tool available online or downloadable for Windows, Mac OS, and Linux.
- Pganalyze A low-cost query optimizer for PostgreSQL.
- pgCluu Free, open source PostgreSQL performance management and auditing tool.
- Nagios Core and Nagios XI Free and paid versions of an extendible infrastructure monitor that will monitor PostgreSQL database statuses.
The best PostgreSQL monitoring tools
Our methodology for selecting PostgreSQL monitoring tools
We reviewed the market for PostgreSQL monitoring software and analyzed the options based on the following criteria:
- An overview of statistics for all database instances and drill-down detail for statistics on each instance
- Live measurements of database response times
- A demonstration of indexing problems within each PostgreSQL instance
- Recommendations on SQL query optimization
- An examination of server resource utilization by each database instance
- A free trial that offers a no-cost assessment period
- Value for money in a package that delivers a good set of tools that will repay its purchase price
1. Paessler PRTG Network Monitor (FREE TRIAL)
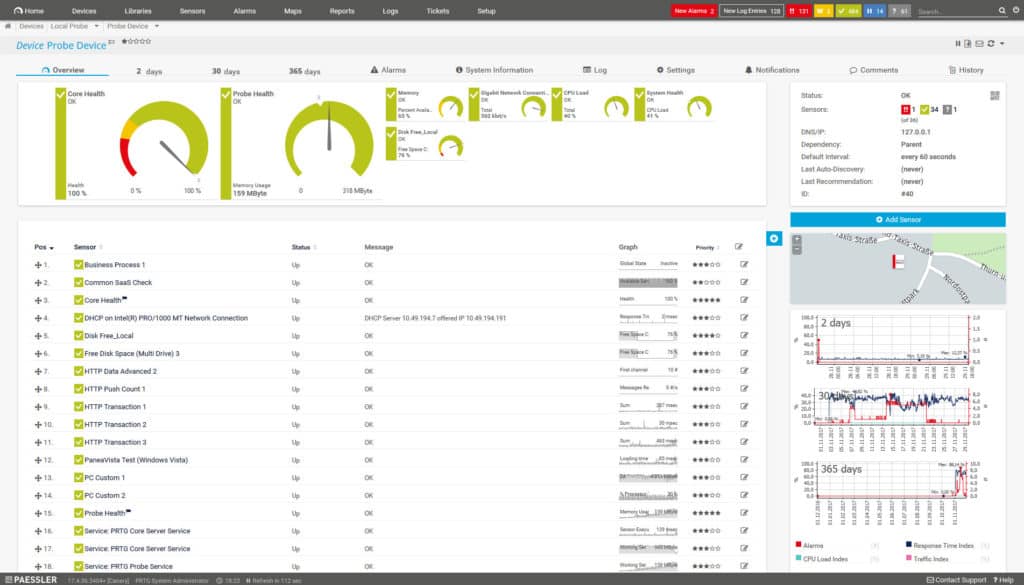
Paessler PRTG Network Monitor is a network monitoring tool that includes a sensor designed for PostgreSQL. The PostgreSQL Sensor monitors databases on a PostgreSQL server and queries it for metrics. The sensor can monitor the execution time of the request, execution time of the query, the number of rows that were addressed by the query, and access data table information. The information is broken down into dials and can be viewed as Live Data, Historic Data or over the past 2, 30, or 365 days.
Key Features:
- Real-Time Monitoring: Offers up-to-the-minute insights on database performance.
- Detailed Response Tracking: Keeps track of query response times.
- Historical Data Analysis: Provides a retrospective look at database health.
Why do we recommend it?
Paessler PRTG Network Monitor is a package of monitoring tools, which are called “sensors.” You decide which sensors to activate and there is one for monitoring PostgreSQL databases. The tool provides both live performance tracking with alerts and a facility for analysis. This sensor slots into a full stack observability package.
To help you monitor sensors when you’re not at your desk, PRTG Network Monitor uses notifications. Notifications are sent to you by email, SMS, or push notifications (to Android and IOS devices) when thresholds are breached. For example if the execution time of a query was unusually long, then the program will send you a notification to tell you there’s a problem.
One of the biggest selling points of PRTG Network Monitor is that it’s a free tool (providing you use less than 100 sensors!). If you’re looking to start out in PostgreSQL then this tool is a great entry point that provides a premium monitoring experience.
Who is it recommended for?
PRTG is offered as both an on-premises software package for Windows Server and as a SaaS platform, so it caters to all needs. The PostgreSQL sensor is just one of the features in the bundle and you can add on network, server, and application monitoring to get root cause analysis when problems arise.
Pros:
- Customizable Dashboard: Tailored monitoring views for different user needs.
- Diverse Alert Options: Supports various notification methods including SMS and email.
- SQL Monitoring Flexibility: Pre-built and custom SQL monitoring capabilities.
- User-Friendly Interface: Simplifies navigation and reporting.
Cons:
- Complexity: The extensive feature set requires time to fully understand.
Paid versions of PRTG Network Monitor start at $1600 (£1,284) for 500 sensors and go up to $14,500 (£11,643) for unlimited sensors with one server installation – there is also a version that supports five server installations for $60,000 (£48,180). You can download the 30-day free trial.
2. ManageEngine Applications Manager (FREE TRIAL)
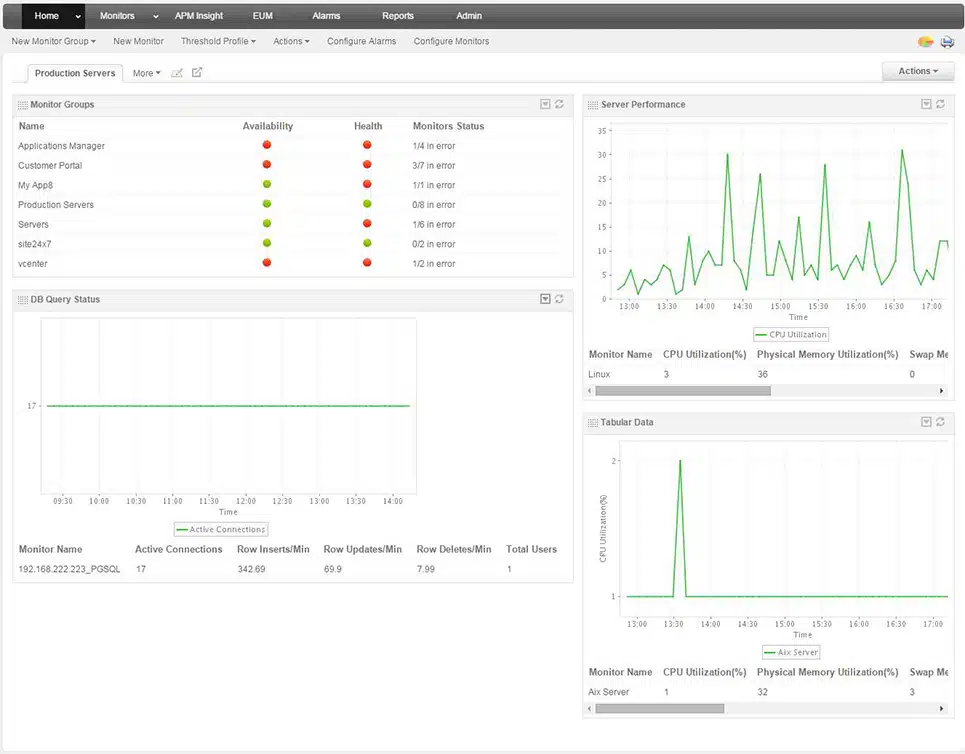
ManageEngine Applications Manager is a good option for PostgreSQL monitoring because it tracks activity in connected applications and supporting services as well as the database instances. The package includes a discovery service that traces all contributing modules for each of your user-facing applications. It then chains through to identify supporting applications such as databases. Passing through these systems, the discovery process identifies the server that hosts each component. With this information, Applications Manager constructs a live application dependency map.
Key Features:
- Transactional Monitoring: Delivers insights on PostgreSQL database transactions.
- Server Health Tracking: Monitors resource usage and availability.
- Application Mapping: Visualizes dependencies between applications and databases.
- Response Time Analysis: Keeps tabs on the responsiveness of applications.
Why do we recommend it?
ManageEngine Applications Manager provides monitoring and analysis of application activity and server resource availability. The tool creates an application dependency map that can predict the demand on a PostgreSQL instance. This tool also provides live capacity tracking for database instances and raises an alert when resources are running short.
The Applications Manager package provides real user monitoring and synthetic monitoring so that you can quickly identify problems in the delivery of your Web applications. The application dependency map shows the root cause of any issue, so you can go straight to the system that needs to be fixed without wasting time investigating. A system of thresholds also warns you of impending problems. These trip alerts that can be forwarded to your phone, email, or Service Desk ticketing system.
Applications Manager also offers distributed tracing and code profiling to track through the activities of serverless systems and other Web applications. These utilities also feed through to PostgreSQL monitoring if those systems rely on database instances. The dependency maps chain right down to each server resource underpinning the whole system.
Who is it recommended for?
This tool is very similar to the SolarWinds Server & Application Monitor but this software package can run on more platforms. It is available for Linux as well as Windows Server and it can also be run on the AWS and Azure cloud platforms. A free edition will monitor five assets.
Pros:
- Robust PostgreSQL Template: Provides out-of-the-box monitoring setup.
- Historical Data Recording: Useful for long-term performance analysis.
- Effective Query Analysis: Helps optimize database queries.
- Alert Mechanisms: Notifies administrators of emerging performance issues.
Cons:
- Learning Curve: Might require time to master the feature-rich platform.
ManageEngine Applications Manager is available in a free edition but that only offers five monitoring instances. There are two paid editions, which are Professional for a single network, and Enterprise for multi-site implementations. The software package runs on Windows Server or Linux or you can get the system as a service on AWS and Azure. You can get a 30-day free trial and if you decide not to buy at the end of the trial period, your implementation reverts to the free version.
3. Site24x7 (FREE TRIAL)
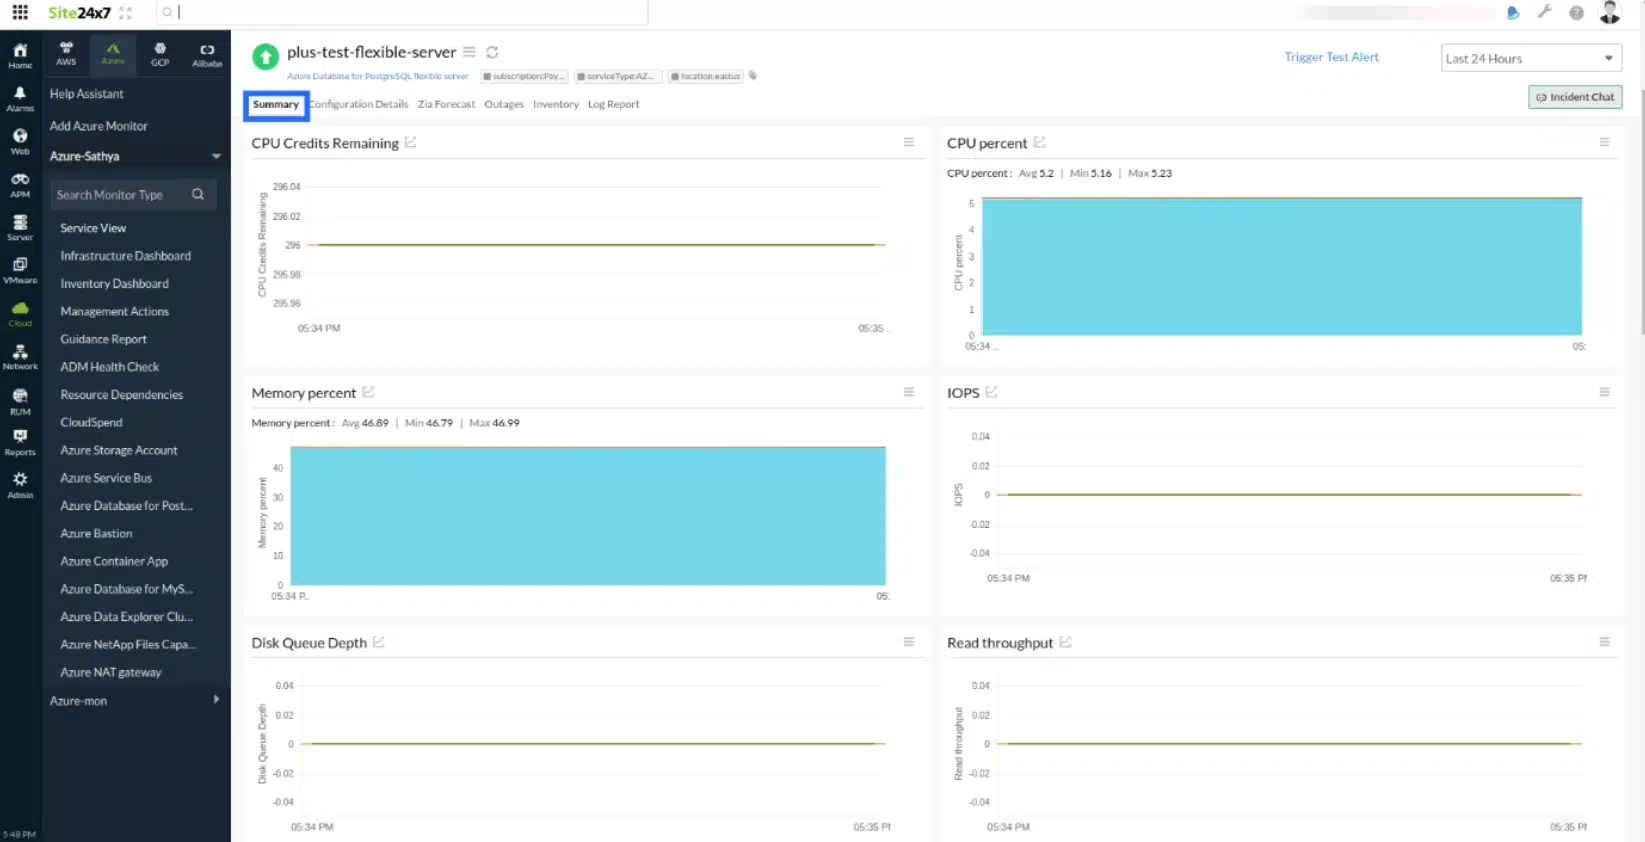
Site24x7 is a cloud platform of system monitoring tools that includes network, server, application, infrastructure, and website monitoring systems. The service also offers log management. You can get specific PostgreSQL monitoring by accessing a plug-in. The screens for Site24x7 are customizable and you can create your own, showing a mix of monitors, including the PostgreSQL monitoring sensor output.
Key Features:
- Comprehensive PostgreSQL Monitoring: Detailed insights into database performance.
- Integrated Service Monitoring: Tracks both services and server health.
- Root Cause Analysis: Quickly identifies the origin of performance issues.
Why do we recommend it?
Site24x7 is a cloud platform that provides packages of modules to monitor servers, networks, and applications. It is able to monitor PostgreSQL databases through the activation of an integration. This adds on extra sensors and new screens in the system console that provides reporting on database activity and capacity.
By combining information from all of the sensors in the Site24x7 package you get a better idea of which element in the full system stack is causing responses to slow or services to hang or fall over. As Postgres is a back-end service, performance issues with databases would show up first in a user-facing system because problems with the database will cause response problems elsewhere.
The database monitoring service in Site24x7 is able to watch the responses of the database itself and drill down further to correlate PostgreSQL activity with the availability of supporting services.
The Site24x7 package includes a series of performance expectation thresholds and if one of those is breached anywhere, it will receive an alert, which you can choose to receive by email, SMS, or voice message. By scrolling through the alerts in the Site24x7 console, you will identify which of the batch was raised first, thus immediately seeing where the problem began.
Who is it recommended for?
This system is a rival to the Datadog platform. The difference between them is that the plans of Site24x7 combine all of its modules, while the buyer of services from Datadog selects and pays for each module individually. Both tools provide alerts for resource shortages or long-running queries in PostgreSQL.
Pros:
- Versatile Thresholds: Customizable for various monitoring aspects.
- Platform Agnostic Monitoring: Effective across different operating environments.
- Comprehensive Stack Monitoring: Includes performance tracking at all levels.
- Demand Pattern Visualization: Aids in planning for database capacity.
Cons:
- Lacks On-Premises Option: May not suit all business requirements.
The Postgres monitoring plug-in is part of the Server Monitoring service of the Site24x7 Infrastructure plan, which starts at $9 per month (£7.57). The service is also included in the All-in-One (starting at $35/£29.44 per month) and MSP (starting at $45/£37.85 per month) editions. You can get any plan on a 30-day free trial.
4. Datadog PostgreSQL Performance Monitoring
Datadog is a SaaS platform that includes system monitoring tools. The Datadog Infrastructure module has a specialist integration that allows it to monitor PostgreSQL databases. The monitor will track the operating throughput of the RDBMS and help spot inefficient queries that are gobbling up resources.
Key Features:
- AI-Driven Insights: Advanced algorithms identify performance bottlenecks effectively.
- Comprehensive Monitoring: Tracks every aspect of PostgreSQL performance.
- Customizable Dashboard: Tailor the interface to your specific monitoring needs.
- Real-Time Alerts: Stay informed of issues immediately as they arise.
- Watchdog Feature: AI system detects problems beyond typical thresholds.
Why do we recommend it?
Datadog PostgreSQL Performance Monitoring provides query analysis for database instances running on all platforms. The tool can identify long-running queries in the context of database resource availability and all other activity. This enables the service to identify whether the problem is caused by insufficient resources, locks, poor indexing, or badly written queries.
The PostgreSQL monitoring dashboard is packed with data visualizations, which you might find a little overwhelming. However, you can set alert thresholds on all of those metrics, so you don’t have to watch the passing metrics on live activities to keep ahead of potential problems.
The Datadog Infrastructure deploys an AI-based system, called Watchdog, which can spot potential problems more accurately than straightforward thresholds because it will combine event metrics to derive potential bottlenecks. The combination of monitoring notification techniques means that you can leave the system to monitor your PostgreSQL databases for you.
The dashboard of Datadog can be customized, letting you place all of the information that is important to you in one place. With this, you can create stack views that cover the services that support your PostgreSQL database as well as the RDBMS and query performance.
Who is it recommended for?
The Datadog system is a cloud platform, so it relives the suer of finding a host for the monitoring software. This system can reach out to other cloud systems and your on-premises server to track the performance of your PostgreSQL databases and other applications and resources. This package is suitable for businesses of all sizes.
Pros:
- Versatile Deployment: Cloud-based functionality for diverse IT environments.
- Holistic Monitoring: Captures a complete picture of PostgreSQL health.
- Automatic Network Mapping: Effortlessly visualizes network topology.
- Responsive Updates: Reflects network changes almost instantly.
- Scalability: Adapts to varying business sizes with flexible pricing.
Cons:
- Trial Limitation: A longer trial period would be beneficial for thorough evaluation.
- Complex Interface: Some may find the data-rich dashboard overwhelming at first.
Analysis tools in the SaaS platform enable you to identify inefficient queries and code and optimize them. The analytical capabilities and live monitoring functions of Datadog can be extended by adding on other modules. These include Datadog APM, which performs distributed tracing for Web applications, Network Performance, to check on traffic patterns and network capacity, and Synthetic Monitoring, which monitors the uptime and performance of websites.
5. Sematext PostgreSQL Monitoring
Sematext PostgreSQL Monitoring is part of the Sematext Infrastructure Monitoring package. This system offers network, server, application, and services monitoring and it is particularly strong in monitoring databases. The PostgreSQL monitoring system is an add-on to the base Infrastructure Monitoring unit and it is one of a long list of integrations that can expand the system.
Key Features:
- Multi-Instance Tracking: Monitors numerous PostgreSQL instances simultaneously.
- Database Performance Insights: Delivers key metrics for optimal performance.
- Comprehensive Resource Monitoring: Includes server and network resource tracking.
Why do we recommend it?
Sematext PostgreSQL Monitoring is part of a cloud service of log analysis tools. This system looks at the live logs of your PostgreSQL instances and identifies potential problems, such as capacity limits or unresponsive processes. It also measures the server activity that supports the databases. Alerts draw attention to evolving problems.
The PostgreSQL monitoring add-on provides readouts for all the key database metrics, such as transaction throughput and error rates. If locks occur or if resources run short, the Sematext service will raise an alert. This gives you the option to get on with other tasks and let Sematext get on with monitoring the normal performance of your Postgres databases.

You still get network, server, and application monitoring from Sematext when you activate the PostgreSQL integration. This means that you can see whether server memory shortages or network congestion is the real cause of any performance problems that you encounter with your databases. Dependency mapping can also show you when your database is the real cause of issues with your user interfaces.
Who is it recommended for?
The PostgreSQL monitoring system is an add-on module for the Infrastructure Monitoring package of the Sematext platform. This is the only DBMS that the platform is able to monitor, so if you run other databases as well, Datadog or Site24x7 would be better for you. A free edition for small businesses will monitor five assets.
Pros:
- In-Depth Monitoring: Delivers insights within the database and its supporting services.
- Application Dependency Mapping: Clarifies interconnections for better troubleshooting.
- Live Graphs and Analysis: Real-time and historical performance data.
Cons:
- Costly for Long-Term Data Retention: Prices rise with extended data storage periods.
Sematext Infrastructure Monitoring and the PostgreSQL integration are free to use if you run them to watch over five hosts with only a 30-minute data retention period. More hosts and a long retention period get you into the paid editions. Sematext is a SaaS package but there is an option to run it on your own server as a virtual appliance over Docker. Sematext is available for a 14-day free trial.
6. AppDynamics
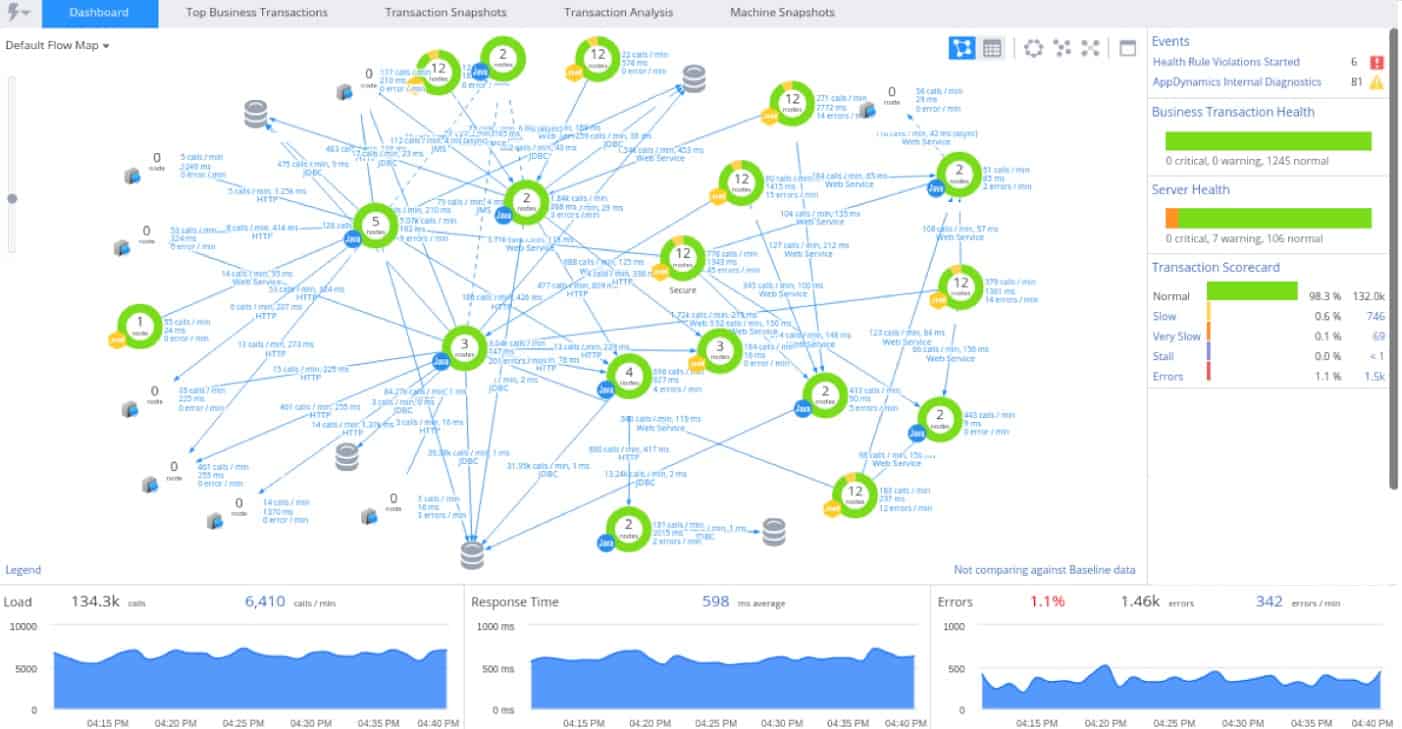
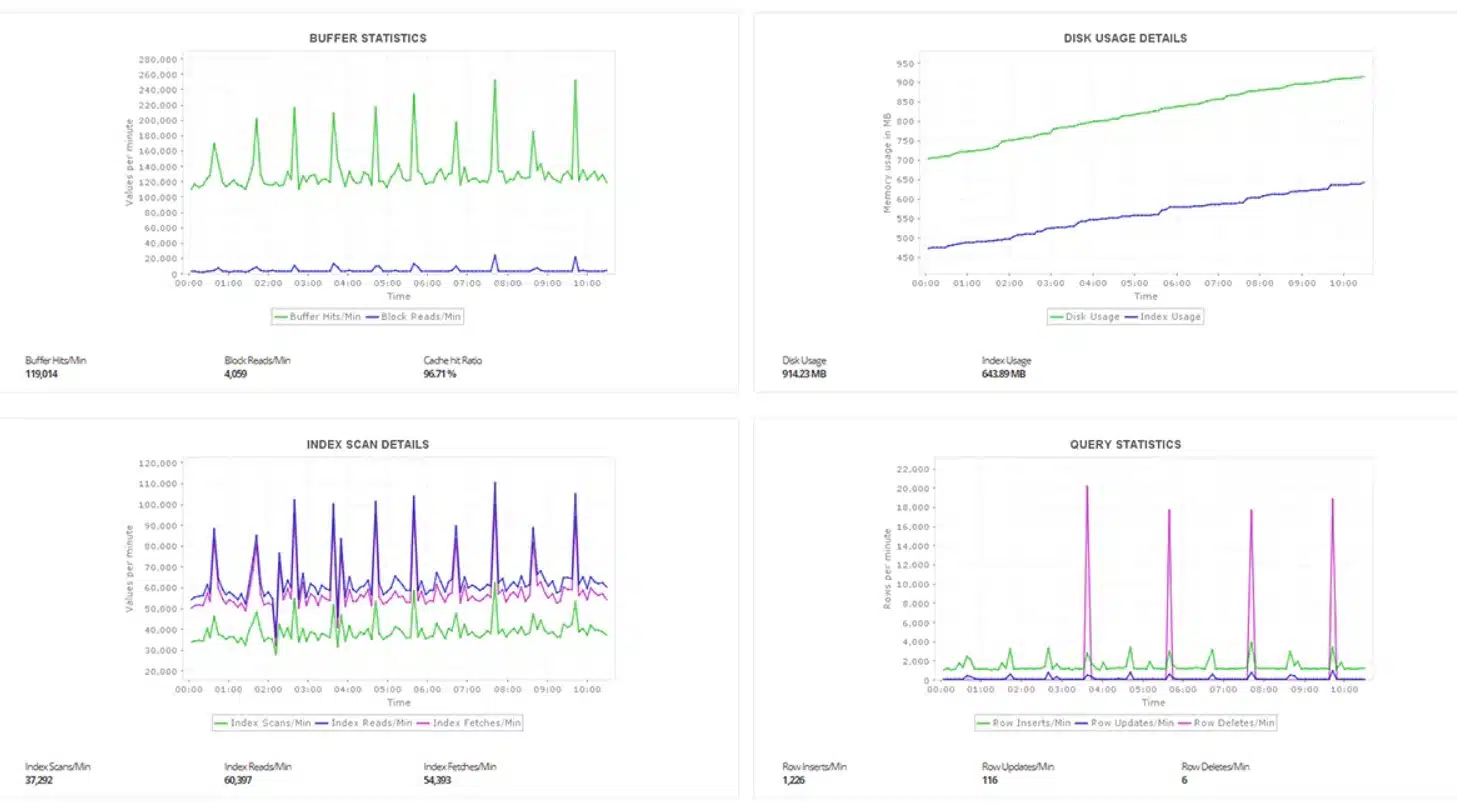
AppDynamics is a premium application performance monitor that is compatible with PostgreSQL. AppDynamics provides you with an in-depth perspective of PostgreSQL performance. Data the software monitors includes transaction activity, tuple access types, cache hit rates, and more. If you see something you’re unsure about, at the click of a button you can visualize the historical performance of an individual query.
Key Features:
- In-Depth Transaction Analysis: Detailed monitoring of database transactions.
- Comprehensive Infrastructure Monitoring: Tracks underlying server resources.
- AI-Powered Insights: Advanced analytics for enhanced monitoring.
Why do we recommend it?
AppDynamics is a cloud platform that specializes in application performance monitoring (APM). this provides an application dependency map, which can show the systems that depend on your PostgreSQL databases as well as the database itself and the server resources that support them. This is a good service for root cause analysis.
To tackle the issue of visibility AppDynamics displays PostgreSQL instance objects. Viewing objects from this perspective helps you to understand your current configurations much better. Table Details and Index Information are just some of the details you can take a closer look at.

The alerts system on AppDynamics works off of baselines. AppDynamics collects performance data and establishes baselines to detect anomalous behavior. Alerts and baselines are sophisticated enough that the software can minimize false alerts so that you only receive legitimate notifications.
Who is it recommended for?
AppDynamics is a cloud-based system and it is charged for on a monthly subscription. The lowest of the system’s three plans is very affordable and would be appealing for SMBs, except that it doesn’t include database monitoring. The two higher packages are more expensive than the options offered by Datadog and Site24x7.
Pros:
- Enterprise-Grade Tool: Well-suited for large-scale environments.
- Full-Stack Monitoring: Covers a broad range of monitoring needs.
- AI-Enhanced Monitoring: Offers intelligent and proactive issue detection.
Cons:
- Higher Cost: More expensive compared to similar tools.
- Steep Learning Curve: Can be challenging to master without sufficient guidance.
Overall, if you require a PostgreSQL monitoring tool that provides deep visibility there are few tools as comprehensive as AppDynamics. AppDynamics can monitor versions 8 and higher of PostgreSQL databases. To view the pricing information of the product you will have to contact the company directly. You can download the free trial.
7. SolarWinds Server & Application Monitor
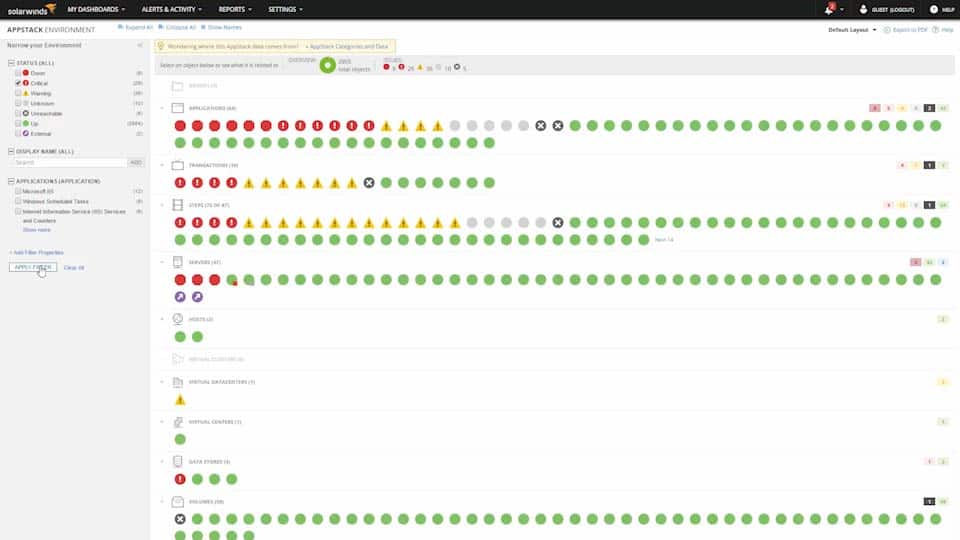
SolarWinds Server & Application Monitor is an application monitoring tool that monitors PostgreSQL databases. The software can measure database size, table size, active database and server connections, indexes, locks, triggers, successful transaction rates, and more. PostgreSQL shows them on the dashboard. The dashboard comprises a range of visual displays ranging from performance dials to more complex charts and graphs.
Key Features:
- Multi-Application Support: Monitors a wide array of applications alongside PostgreSQL.
- Resource Utilization Tracking: Keeps an eye on database and hardware resources.
- Detailed Query Analysis: Offers insights into database query performance.
Why do we recommend it?
SolarWinds Server & Application Monitor is an n-premises package that can monitor and analyze multiple applications simultaneously. The system tracks the activities of applications through services down to server resource usage. This is ideal for the monitoring of databases, such as PostgreSQL instances because these systems stand between front-end applications and server resources.
Out-of-the-box, SolarWinds Server & Application Monitor includes over 200 monitoring templates for PostgreSQL, MySQL, MongoDB Apache, Tomcat, Cassandra and many other providers. There are also over 800 monitoring templates that have been created by the users and shared on Thwack (SolarWinds’ online user community).
Intelligent alerts update you on changes to PostgreSQL performance. If CPU usage is higher than normal you will be sent an alert. Alerts are configured based on thresholds where a performance baseline is established and alerts are sent when there is a deviation from that baseline. The system has been built to minimize false positives.
Who is it recommended for?
This is a powerful package that runs on your site but tracks applications running on cloud platforms as well as your own servers. The software is only available for Windows Server but it can track servers running other operating systems across the network. This tool’s capacity is suitable for use by large organizations.
Pros:
- Deployment Flexibility: Supports both on-premises and cloud environments.
- Interdependency Mapping: Shows how performance issues in one area can affect others.
- Comprehensive Logging: Detailed monitoring of memory, disk IO, and more.
Cons:
- Feature Overload: Can be overwhelming to explore all available features initially.
SolarWinds Server & Application Monitor is ideal for small to midsize enterprises looking for a PostgreSQL monitoring solutions that’s easy to install and manage. SolarWinds Server & Application Monitor starts at a price of $2,995 (£2,404). You can also download the free trial.
8. ClusterControl
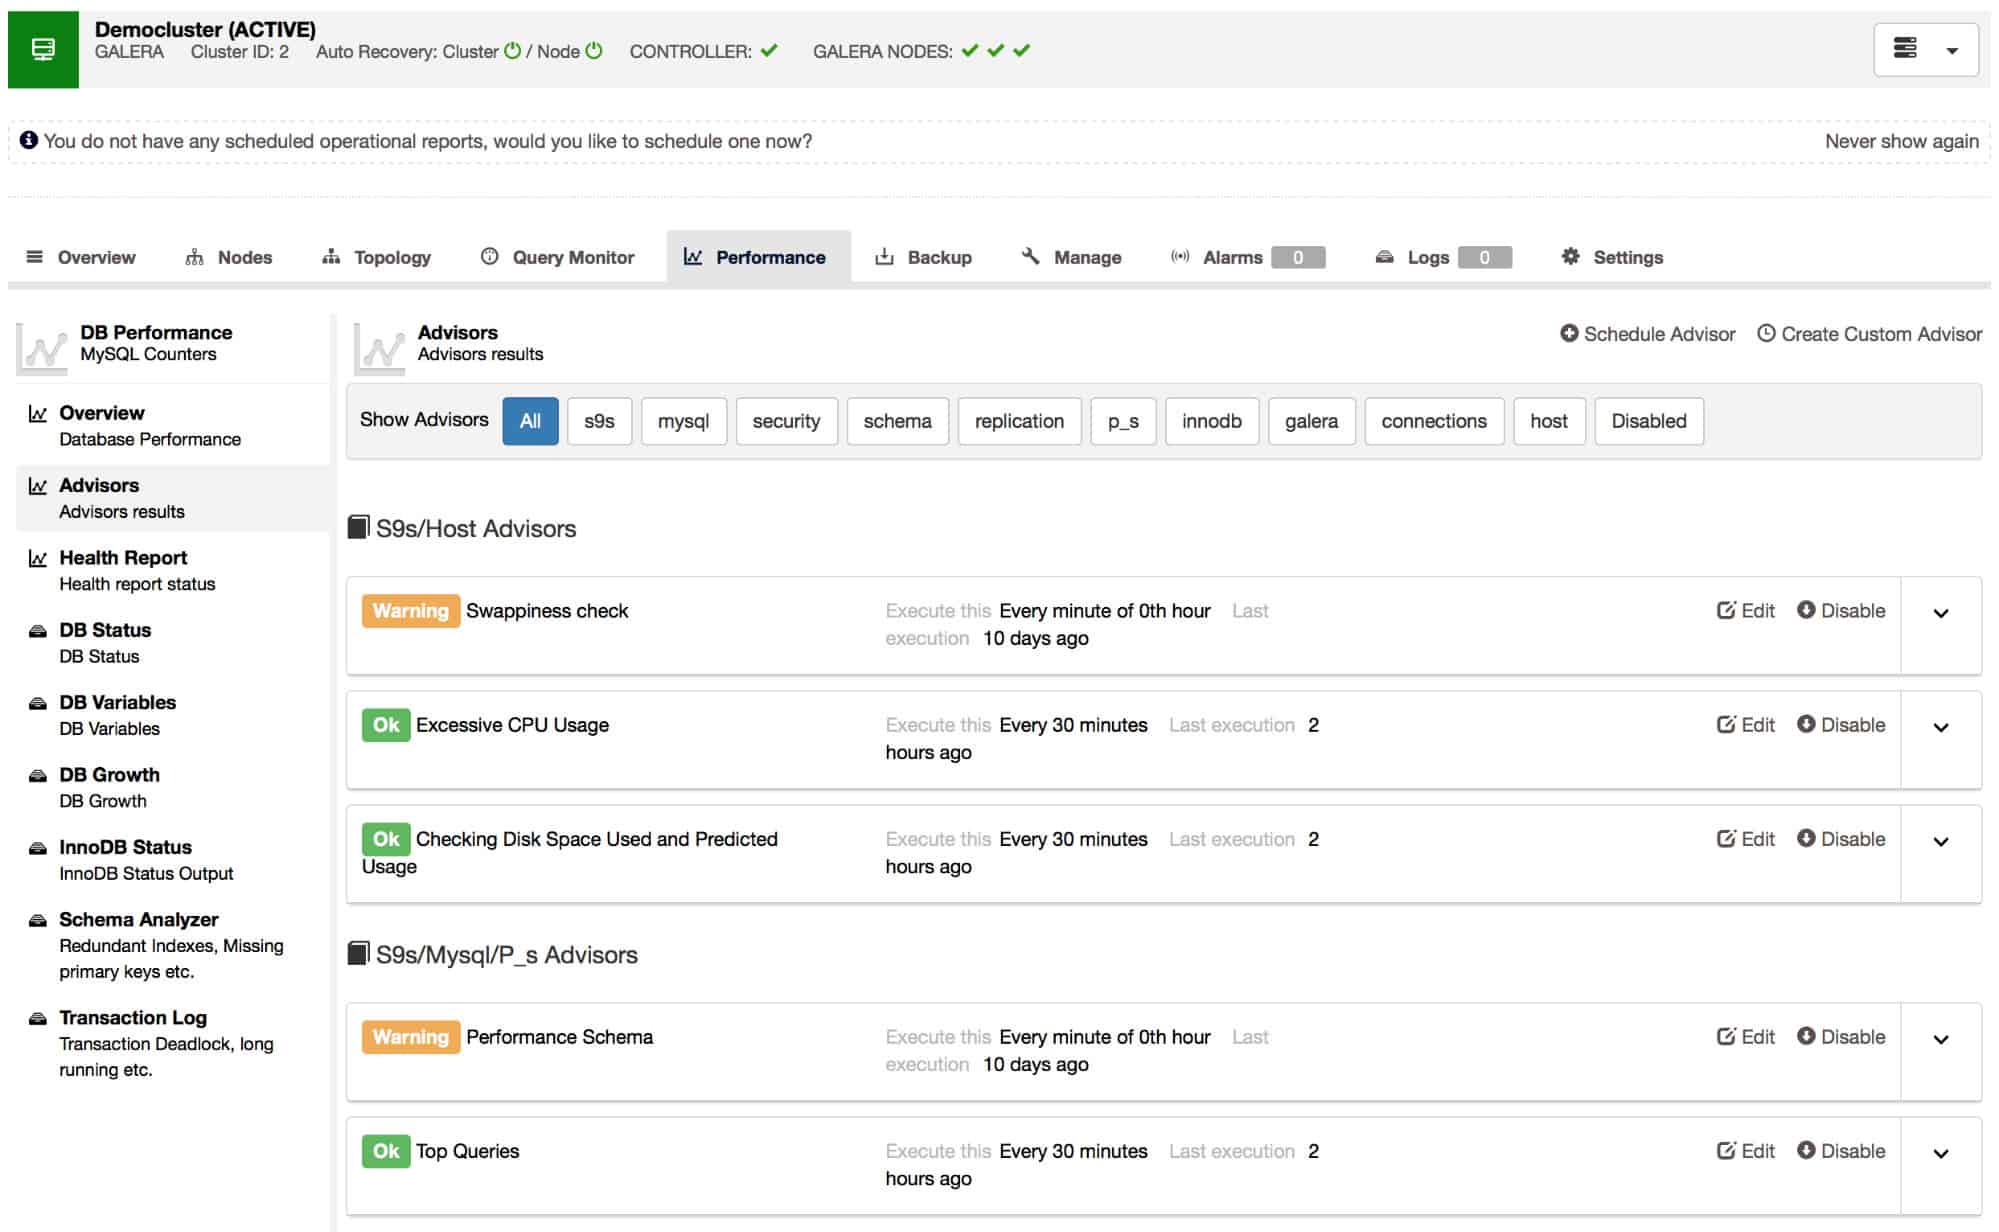
ClusterControl is an advanced database monitoring platform that supports PostgreSQL. ClusterControl combines performance monitoring with database automation to assist users in monitoring their databases. The database automation capabilities of the software automatically deploy and configure PostgreSQL instances so you can manage them. The PostgreSQL streaming replication allows you to configure new or existing replication slaves.
Key Features:
- Database Automation: Streamlines database creation and management.
- Resource Optimization: Ensures efficient use of database resources.
- Replication Management: Facilitates high availability through database replication.
Why do we recommend it?
Several9s ClusterControl is designed to watch over multiple databases. It is available for monitoring a number of DBMSs, which includes PostgreSQL. Other systems that this tool will monitor include MySQL, SQL Server, MongoDB, and Elasticsearch. The tool aids in the creation of database instances as well as their ongoing monitoring and management.
When managing PostgreSQL, visibility is one of the most difficult challenges to address. ClusterControl confronts this issue head-on by including a topology viewer. The topology viewer allows you to display how your database is functioning in one pane of glass.

The automatic failover and recovery feature helps to keep your database secure. The product will automatically promote a new master node when a failure occurs. In the aftermath of a database event, you also have the ability to recover your databases back to an earlier point in time. These features help to make sure that your service stays available no matter what happens.
Who is it recommended for?
This package is able to monitor database instances running on different platforms and also different DBMSs all in one console. This is a great benefit for complicated businesses that have several types of databases. Small businesses are less likely to need such complexity. They have a free edition available.
Pros:
- Multi-Database Support: Ideal for environments with diverse DBMSs.
- Quick Deployment: Sets up new clusters swiftly and efficiently.
- Automated Recovery Features: Enhances database reliability and uptime.
Cons:
- Limited Free Features: Some advanced features only in paid versions.
- Documentation Gaps: Could benefit from more comprehensive guides.
ClusterControl is available as a community version or as two paid versions. The Community version is available for free with real-time monitoring and community support. The Advanced version includes failure detection and recovery features. The Enterprise version adds role-based access control and reports to the mix as well. In order to view the pricing information of the product you will have to contact the company directly. You can download the free version.
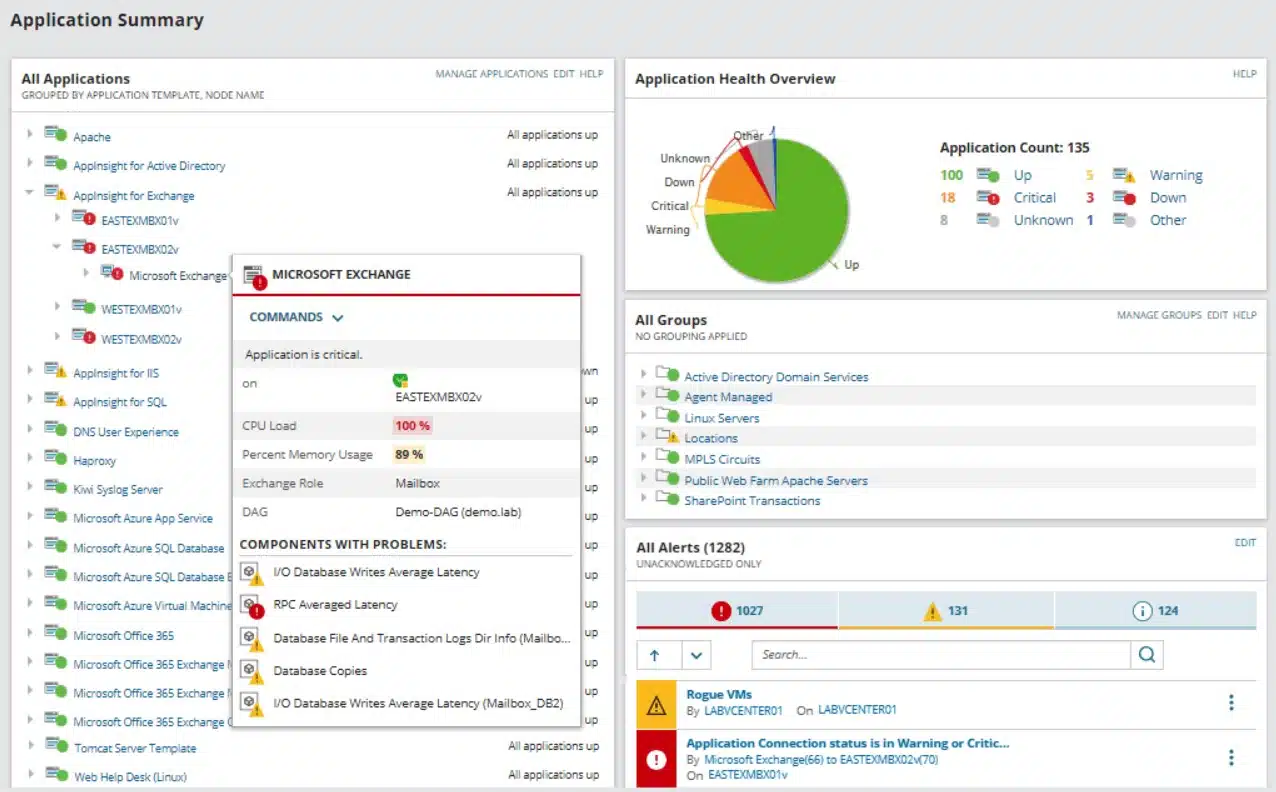
9. pgAdmin

pgAdmin is a widely-used open-source PostgreSQL management tool. The tool offers a GUI to manage PostgreSQL databases, an SQL query tool, and a code debugger. There is also a monitoring dashboard and live SQL query tool that you can use to edit queries. The combination of management and monitoring functionalities included with pgAdmin makes the product very versatile.
Key Features:
- Open Source Tool: Freely available for wide usage.
- Integrated Code Debugger: Assists in query and code troubleshooting.
- User-Friendly Query Builder: Simplifies SQL query creation.
Why do we recommend it?
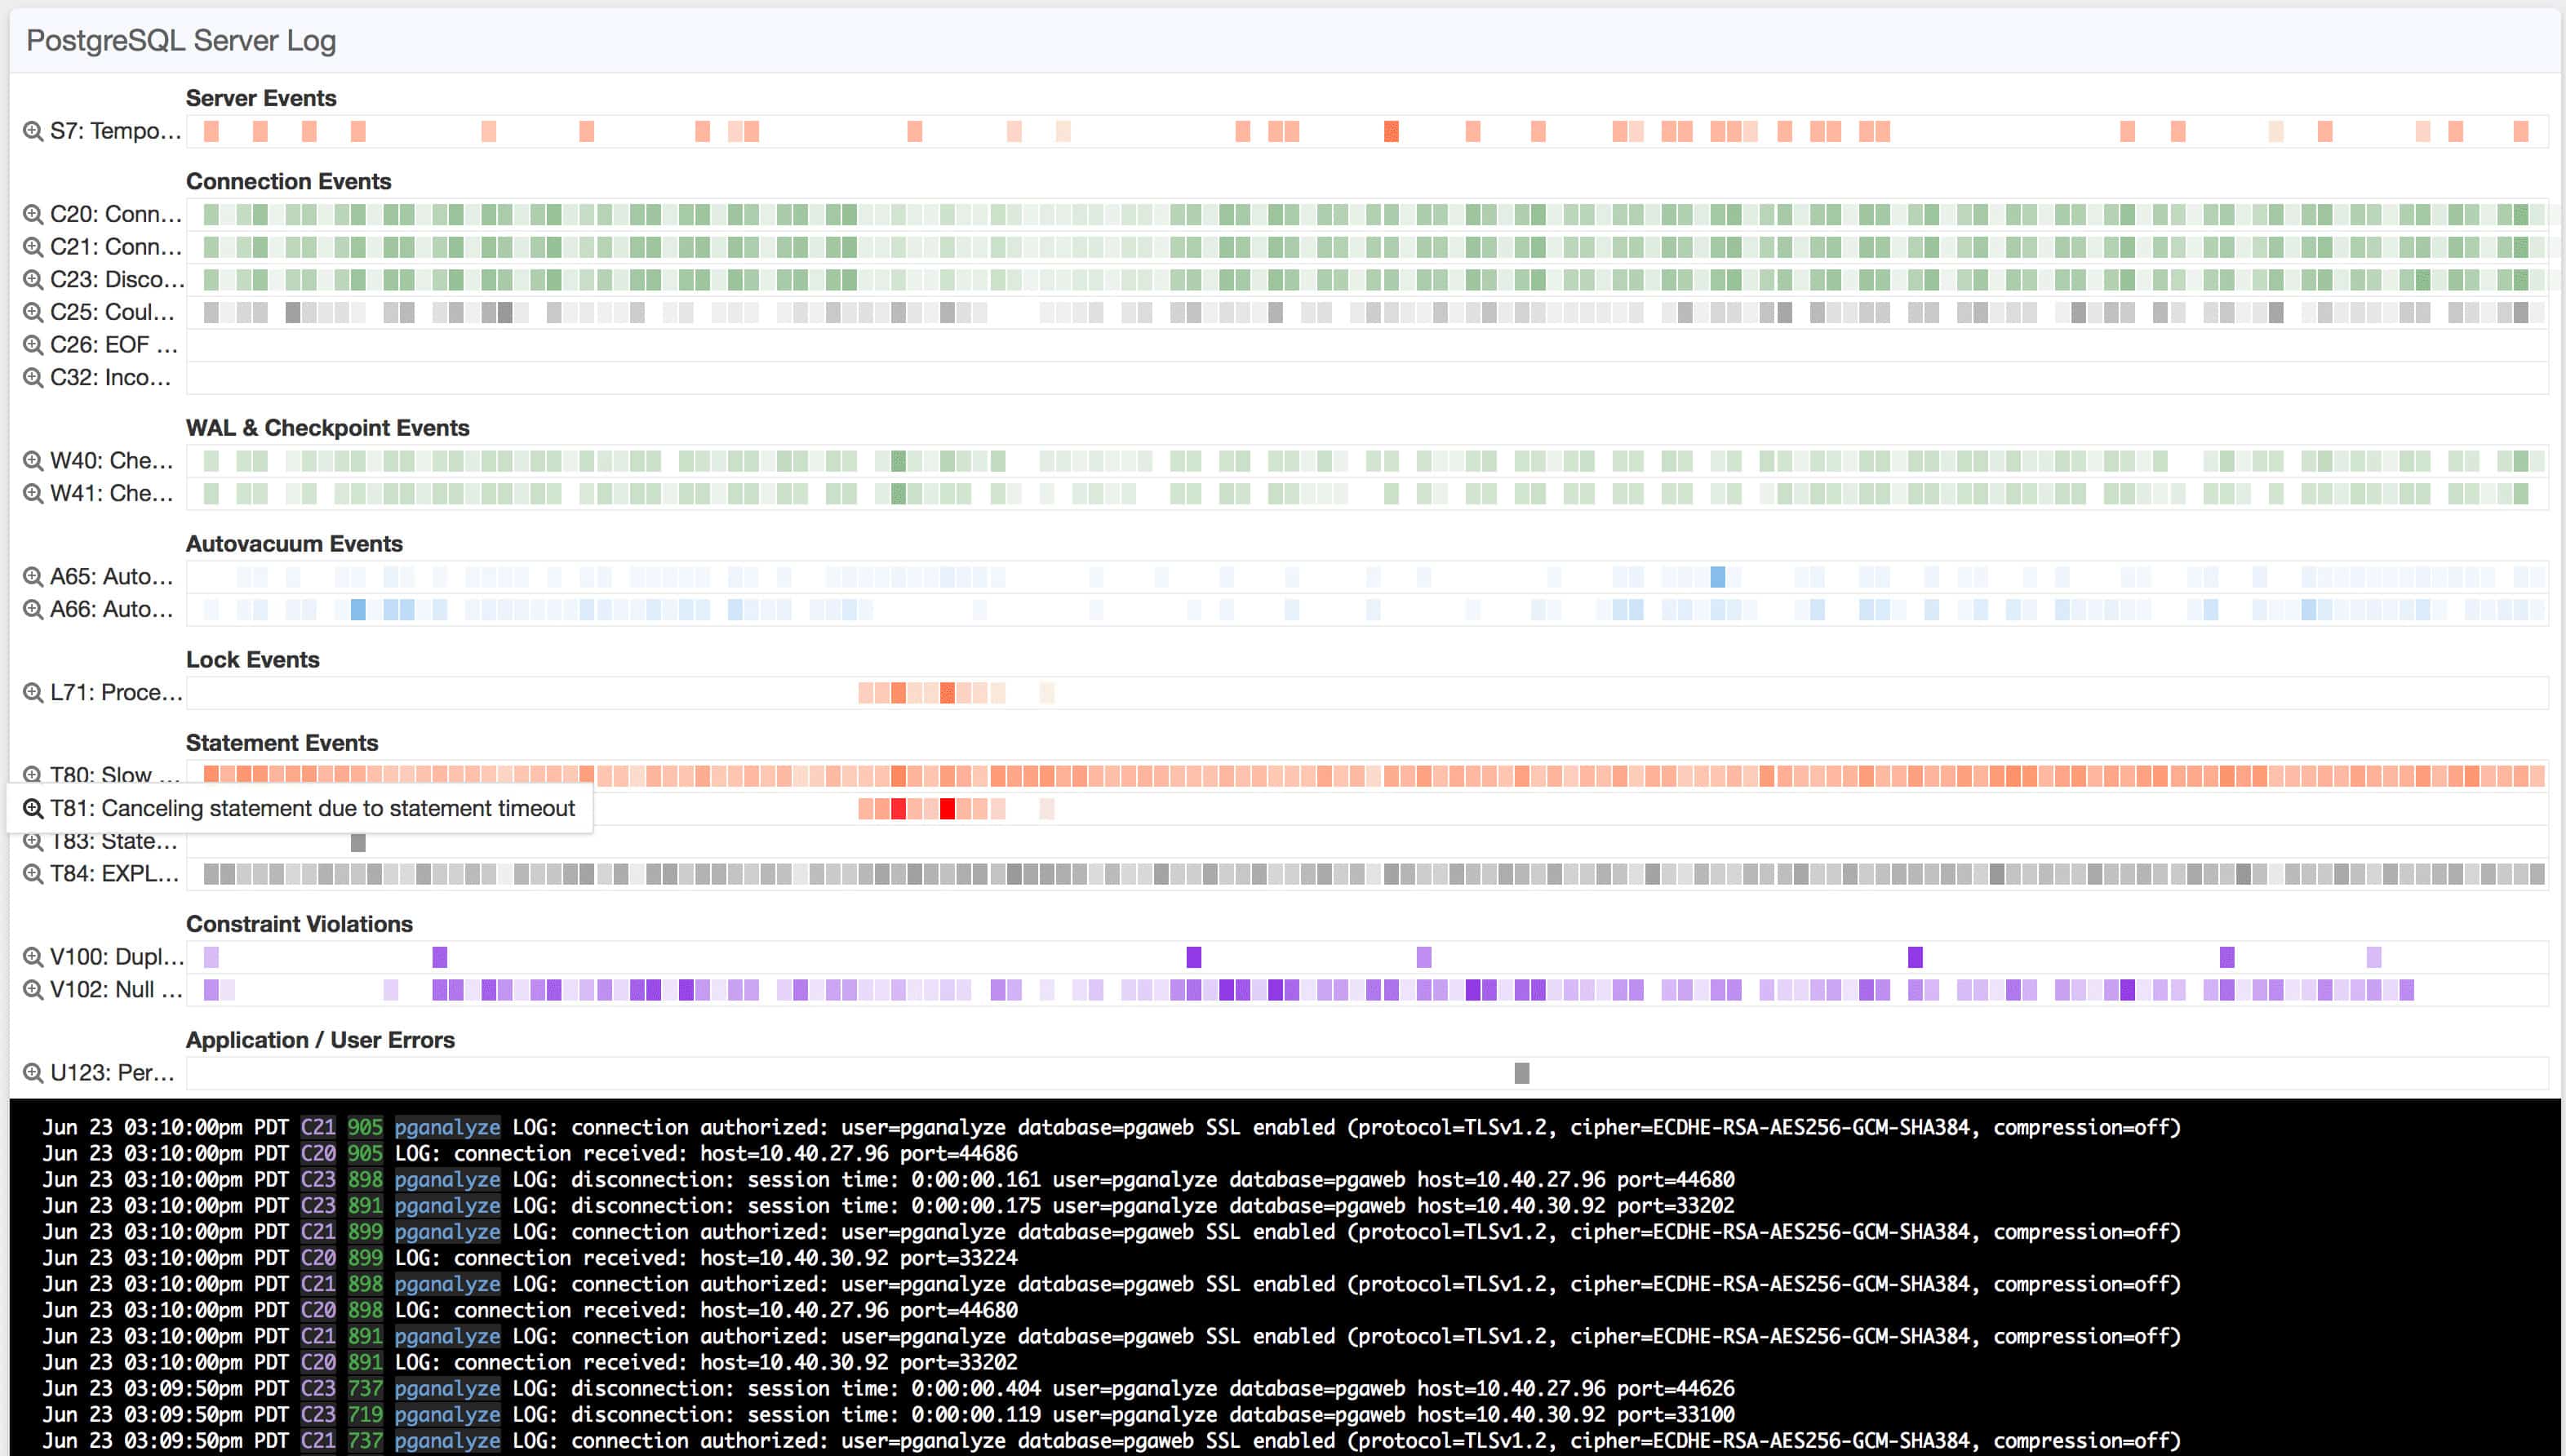
The pgAdmin system is a free tool for monitoring PostgreSQL databases. This system provides an administrator console for PostgreSQL instances. It includes a query builder and a database and query analyzer. This is a widely-used and reliable tool. A free extension adds on a system to monitor and analyze PostgreSQL logs.
There are additional features that you can access by using the adminpack contrib (a library) module for PostgreSQL. As part of the expansion, you can view server log files in the Server status dialogue view. Information you can monitor through the Server Status dialogue includes the client address, start time, current query, and query start time.

Who is it recommended for?
This tool is suitable for use by anyone and the only reason to not use it is that it is dedicated to monitoring PostgreSQL and nothing else, so businesses that one a single monitoring package for all of their resources should look elsewhere. The software is free and available for all major operating systems.
Pros:
- No Cost: Completely free to use across various platforms.
- PostgreSQL-Specific: Designed with a focus on PostgreSQL needs.
- Cross-Platform Availability: Supports Windows, Linux, and Mac OS.
Cons:
- Outdated Interface: May not be as intuitive as modern tools.
- Community-Based Support: Lacks professional support services.
The cross-platform potential and accessibility of pgAdmin makes it a compelling choice no matter how your local environment is structured. The platform is available on Windows, Mac OS, and Linux. The tool itself is available as a web or desktop application. You can download the program for free.
10. pganalyze
pganalyze is PostgreSQL performance monitoring software that has been tailor-made to improve visibility into queries. You can use this tool to help discover why a query is running slowly. To do this, you can view statistics such as the I/O cvs CPU time and buffer cache hit ratio to help find the root cause. To help you improve performance, pganalyze tells you whether a query needs an index to boost performance.
Key Features:
- PostgreSQL-Specific Analysis: Tailored for in-depth PostgreSQL monitoring.
- Database Structure Review: Assists in optimizing database layout.
- Resource Usage Monitoring: Keeps track of critical database resources.
Why do we recommend it?
If the monitoring features of pgAdmin are not enough, take a look at pganalyze. This system is not free but it provides constant performance analysis and database tuning tips. This tool is specifically designed to track the activities in PostgreSQL instances. It also provides live metrics for standard database operations, such as CPU and memory activity.
You also have complete transparency over your database’s performance history. You can search through queries and view the Query, Role, AVG TIME (MS), CALLS/MIN, I/O%, CACHED %, % of All Runtime to find problematic queries. How far in the past you can do this depends on the version you’re using (see below).

Who is it recommended for?
This package is highly specialized. It doesn’t have a free edition and the price of its standard package is probably a little too high for small businesses. The tool is only able to monitor PostgreSQL databases and not other elements of infrastructure. Therefore, pganalyze will appeal to large businesses for whom PostgreSQL database performance is critical.
Pros:
- Efficient Performance: Low resource usage for minimal system impact.
- Query-Focused Monitoring: Specializes in PostgreSQL query analysis.
- Historic Data Storage: Useful for long-term performance tracking.
Cons:
- Short Trial Period: Only a 14-day trial available.
- Limited Access in Lower Tiers: On-premise version restricted to higher packages.
There are three versions of pganalyze available to purchase: Production, Scale, and Enterprise Edition. The Production version costs $99 (£79.50) per month for up to three database servers and 14 days of historic data. The scale version costs $250 (£200) per month for six database servers and 30 days of historic data.
The Enterprise Edition offers an option of on-premises installation with unlimited database servers (but you need to contact the sales team to know the price.) You can download the 14-day free trial version.
11. pgCluu
pgCluu is a PostgreSQL performance monitor and auditing tool that collects data from your databases cluster. The product is broken down into two parts: a PostgreSQL cluster statistics collector that operates through a command line and a Perl grapher that displays performance management data.
Key Features:
- PostgreSQL Cluster Monitoring: Focused on cluster performance analysis.
- Accessible Statistics: Presents data in an easy-to-understand format.
- Free Utility: Available at no cost for users.
Why do we recommend it?
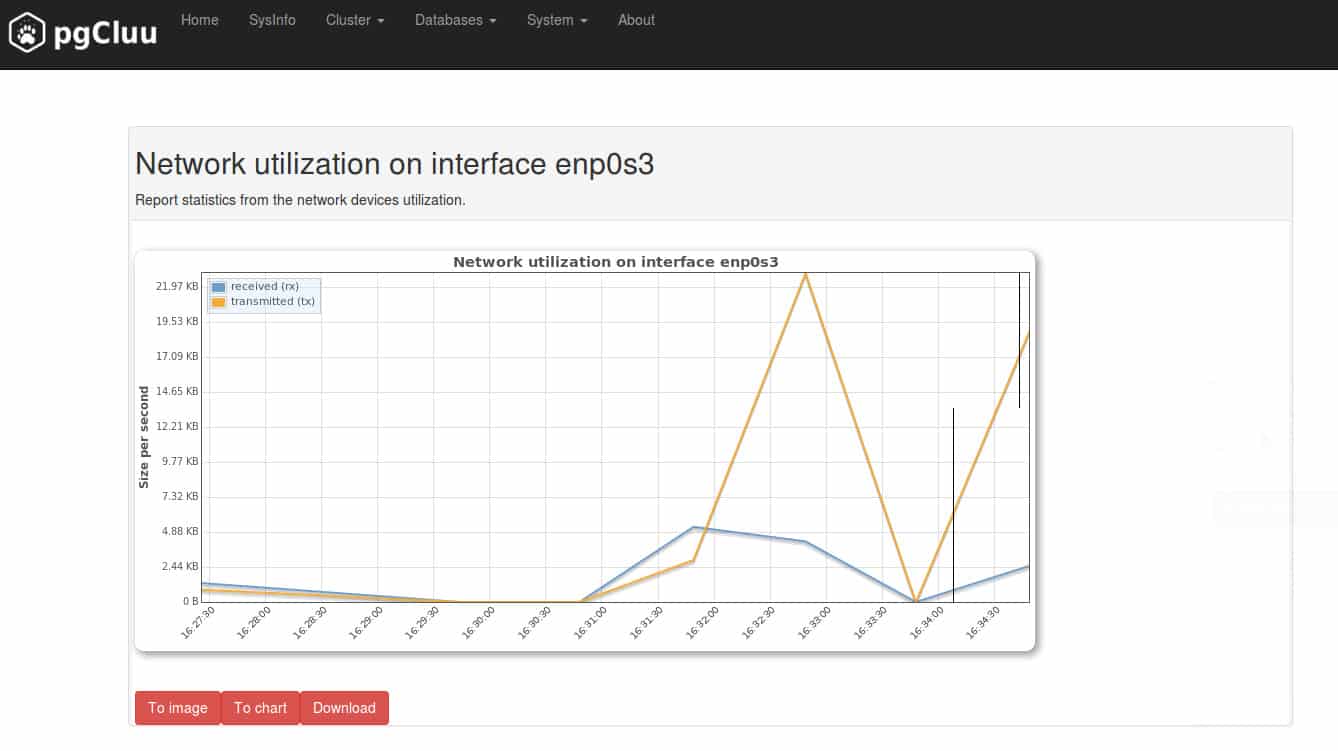
pgCluu is a cluster monitor for PostgreSQL databases. This is an on-demand analysis tool that will create a graph of database performance. The package includes parallel system performance graphs but that can be disabled if you are only interested in getting a graph of the database cloister activity.
Metrics you can monitor with pgCluu include shared buffers utilization per database, the size of all databases, shared buffers usage count distribution, and CPU utilization. This information can be viewed on simple, color-coded charts so there is no ambiguity. You can also generate utilization reports as well.
Who is it recommended for?
This tool only looks at cluster performance and it is retrospective rather than a live monitoring tool. You would use this package if something went wrong and you need to check whether load balancing is faulty. Although this tool provides limited functionality, it is free to use. The software is only available for Linux.
Pros:
- Simplicity: Offers a straightforward view of database performance.
- Open Source Availability: Free and open to community contributions.
- Suited for Smaller Setups: Ideal for less complex PostgreSQL environments.
Cons:
- Basic Visualizations: Graphs and charts could be improved.
- Lacks Official Support: Reliant on community for help and updates.
- Steeper Learning Curve: May require more effort to master.
As an open-sourced alternative, pgCluu is worth considering if you want a PostgreSQL monitoring experience on a budget. You can access the source code from this link.
12. Nagios Core and Nagios XI
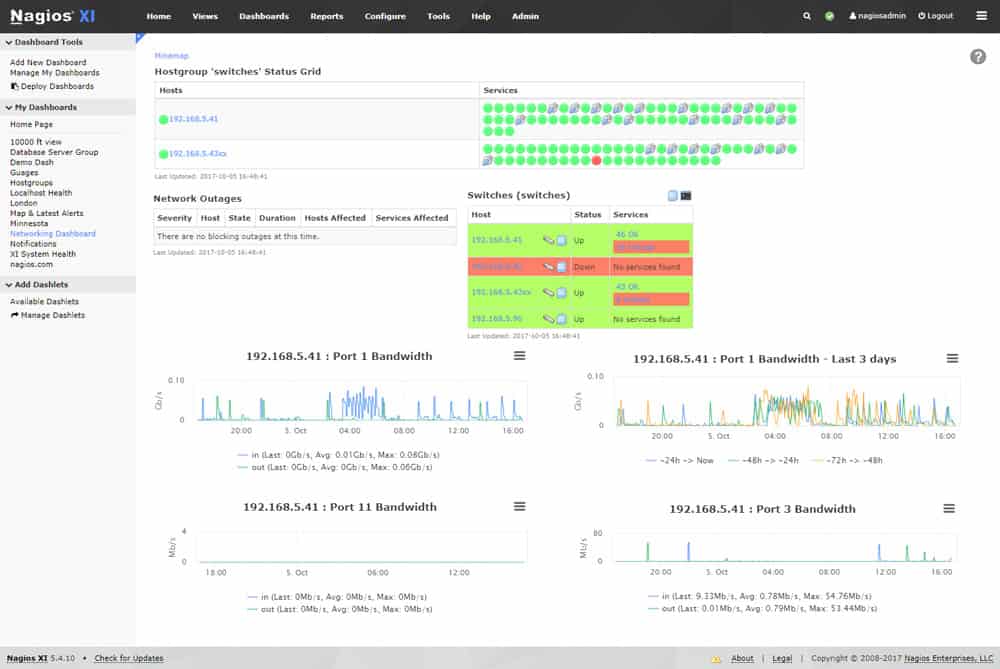
Nagios Core and Nagios XI are infrastructure monitoring platforms that can measure PostgreSQL performance metrics. The software can monitor PostgreSQL database availability, database size, table size, cache ratios, and more. There is also a range of Nagios plugins for monitoring PostgreSQL. For example, the check_pgactivity plugin allows you to view the connectivity, streaming replication lag, database hit-ratio, index bloat, and more.
Key Features:
- Choice of Free or Paid Versions: Suits a range of budgetary needs.
- Plugin Expandability: Customizable with a variety of plugins.
- Comprehensive Resource Monitoring: Tracks both performance and resources.
Why do we recommend it?
Nagios Core and Nagios XI are free (Core) and paid (XI versions of the same package. Both versions provide full-stack monitoring for networks, servers, and applications and both are able to monitor PostgreSQL database instance performance. The advantage of these systems is that they give you root cause analysis if problems arise.
Nagios Core is a free but more limited version of Nagios XI. Nagios XI has the advantage over the two because it has a web-based GUI and other convenient features like monitoring wizards to make configuration easier. If budget is a priority then Nagios Core is the obvious choice but if you want a more convenient monitoring experience then you should opt for Nagios XI.
Who is it recommended for?
Small businesses will like Nagios Core because it is free to use. However, it doesn’t have a proper interface and you will need to match it up with a front end, such as Kibana. That is quite a technical task. Larger businesses will go for Nagios XI, which has a full user interface and a professional support package.
Pros:
- Transparent Open-Source Tool: Offers visibility and community support.
- Configurable Interface: Tailored alerting and monitoring options.
- Cross-Platform Support: Runs on both Windows and Linux systems.
Cons:
- Complex Setup: Can be challenging to install and configure.
- Limited Support in Free Version: Professional support mainly in paid version.
Nagios XI starts at a price of $1,995 (£1,601) for the Standard Edition which includes configuration wizards and advanced reporting. The Enterprise Edition costs $3,495 (£2,806) with capacity planning reports and audit logging. You can download the free trial.
Choosing a PostgreSQL tool for you
Out of all the tools on this list Paessler PRTG Network Monitor and ManageEngine Applications Manager are our top picks. Each tool has something unique to offer. AppDynamics is also highly rated based on its deep-visibility, where as SolarWinds Server & Application Monitor offers a detailed but more accessible user experience.
PostgreSQL Monitoring FAQs
What should I monitor with PostgreSQL?
Performance monitoring of PostgreSQL should cover query performance (read and write volume and speed), buffer cache metrics (cache hits and disk access), infrastructure usage (server load), transaction statistics (number of commits, locks, ongoing report of live sessions and connections), and replication performance (speed and success of replication and checkpoint statistics).
How do I perform a performance tuning in PostgreSQL?
The main limits on PostgreSQL performance will be hitting shared memory limits or delays in interacting with the hard drive. Check those factors first before adjusting the DBMS settings. For fine tuning, look at the following settings: max_connections, commit_delay, max_fsm_pages, fsync, shared_buffers, effective_cache_size, work_mem, random_page_cost.
How much RAM does PostgreSQL need?
The minimum RAM required to install and run PostgreSQL is 2 GB. Ultimately, RAM requirements will depend on the data volumes accessed by your users and performance speed requirements.
How much data can PostgreSQL handle?
There is no limit to the amount of data a PostgreSQL database can handle. Categorize data volumes into storage and access transactions when planning resources for the database.

