

Microservices architecture offloads processing requirements from apps. This is a necessary step when catering to mobile devices where processing and storage space are at a premium. Microservices are accessed through REST APIs.
Each microservice performs a service, such as managing database access, membership services, invoicing functions, and so on. However, it is common for a microservice to employ others in order to complete a task. So, there can be many layers of microservices contributing to a successful transaction.
Here is our list of the best distributed tracing tools:
- Datadog APM A general application performance monitoring service that has a specialized microservices monitoring feature with extra data gathering services.
- Site24x7 APM A package of application monitors that will monitor the functions operating on a server or the applications contributing to a website or app. This monitoring system includes a section for monitoring each app’s performance that illustrates the response times of all the microservices backing it.
- New Relic Telemetry Data Platform A thorough microservices monitoring system that is based on distributed tracing. New Relic adds in its own agents to supplement the standard distributed tracing messages with its own, more detailed statistics.
- Lightstep A microservices monitoring tool that was written by one of the designers of Google’s in-house distributed tracing platform.
- Dynatrace An AI-based application performance monitor that specialized in Clod and Web-based systems and has distributed tracing management built-in.
Abstraction
Every system designer and programmer knows about abstraction. It is a black-box strategy that means you can split off useful pieces of code so that they can be reused again and again, and optimize the investment that goes into building software.
Once a piece of code can complete a task successfully, it can be stored individually and represented by its declaration. All anyone needs to know is what it does, what inputs it requires, and what type of data it returns. After that, it is like a command that can be plugged into any other program. Software houses build up libraries of functions and when they make those available to other developers, they are called APIs.
APIs take care of tasks without having to reinvent the wheel with every new piece of software. However, the big black-box advantage is also a curse. Functions that are made available for sale or rent can’t be read. They are usually even hosted by the software house that developed them. So, when a new app gets written with functionality provided by APIs the processing is performed God-knows-where.
That’s great for getting things done, but it is a nightmare for performance monitoring. Monitoring tools need access rights and third-party API providers are not going to let their customers run analyzers through their code.
All a performance monitor can track is the start and finish times of an API and the results they returned. They can’t see into the operations that the API’s backend code performs or see whether the microservice includes APIs to other microservices. It is very common for microservices to be built on many layers and each microservice could well be run on a different server located in a different part of the world.
Distributed tracing
Distributed tracing is an industry method to allow developers to monitor the performance of the APIs that they use without actually being able to analyze the backing microservice’s code. There are many protocols available for distributed tracing, which complicates a service that is intended to simplify a complicated problem.
The IT industry is solidifying around a few distributed tracing open standards.
- OpenTracing is a product of the Cloud Native Computing Foundation (CNCF).
- OpenCensus is a Google product, based on its own in-house distributed tracing service, called Dapper.
- OpenTelemetry is a merger of OpenTracing and OpenCensus that is still under development. Managed by the CNCF.
These are the main distributed tracing standards. However, there are others.
There are a number of independent, free-to-use distributed tracing platforms available. Among these are Kafka, managed by the Apache Software Foundation, Jaeger, with libraries of tracing functions for C#, Java, Node.js, Python, and Go; and Zipkin (OpenZipkin) which has libraries for more languages, including Java, Javascript, C, C++, C#, Python, Scala, and Go.
The variety of available standards makes it difficult to track all microservices because the service being traced needs to post tracing messages according to one standard or another. If you have a distributed tracing tool that is based on Jaeger, you will miss out on status messages generated for Zipkin. Complicating matters further, AWS has its own proprietary system, called X-Ray in order to monitor its Lambda microservices platform.
What is telemetry?
A lot of distributed tracing systems producers use the word “telemetry” in their names and descriptions. “Telemetry” is not a word that was invented for IT – it exists in other areas of life. For example, you will see signs for the Telemetry Department in hospitals. The term comes from two Greek words, “tele,” which means “remote” and “metron,” which means “to measure.” In healthcare, a telemetry unit is a mobile heart monitor. In IT, the term could refer to any remote monitoring system but it has become specifically associated with distributed tracing for the monitoring of microservices.
A characteristic of telemetry is that it uses a parallel channel for status reporting. That means it doesn’t run through the code itself, but works alongside a running process and gathers statistics independently.
The usefulness of that strategy lies in the fact that, ordinarily, a program that falls over doesn’t get to the line of code that says “report a major problem.” Similarly, a process that is still alive but waiting for a resource (hanging) is stuck at a particular line of the program and can’t get out to say “I’m trapped here.” To account for that situation, the program includes routines to report “I’m still working fine.” So, when the monitor stops receiving those messages, it knows that something has gone wrong. A telemetry-based system is able to continue operating even when the process it monitors is in trouble.
See also: Distributed Tracing Guide
Distributed tracing tools
The best-distributed tracing tools are able to detect and interpret messages written to a number of common microservice status reporting standards. There are three types of distributed tracing tools:
- Trace message collectors
- Trace message consolidators
- Distributed tracing monitors
The task of collecting distributed tracing messages is a specialized service. It needs a tool that knows where to look for messages and can recognize their formats.
Trace message consolidation and storage is a service that could be implemented with many general-purpose log file managers, such as Splunk. The producers of distributed tracing tools don’t like the tracking system to be referred to as logs. However, this might be because they don’t want to have to compete with the much larger field of logfile managers.
Distributed tracing monitors are the highest form of distributed tracing tools because they produce a full information service for managing applications based on microservices.
Microservices architecture offloads processing requirements from apps. This is a necessary step when catering to mobile devices where processing and storage space are at a premium. Microservices are accessed through REST APIs.
Each microservice performs a service, such as managing database access, membership services, invoicing functions, and so on. However, it is common for a microservice to employ others in order to complete a task. So, there can be many layers of microservices contributing to a successful transaction.
Distributed tracing monitors
Distributed tracing monitors are the ultimate tools for distributed tracing because they include all three elements needed to track the performance of microservices. They will collect, manage, and interpret distributed tracing messages, presenting live statuses. They also store records in a meaningful file structure or in a database so that they can be easily accessed for historical analysis. A good distributed tracing monitor will also include a message viewer and interpreter for root cause analysis.
One problem with distributed tracing is that microservices can generate a lot of distributed tracing messages – most of them are just progress records, logging the time each service starts working for a particular session and “keep-alive” type message to let the monitor know that the service is still processing. A good distributed tracing tool will filter out these workaday notifications, or interpret them as graphs.
It is possible to use a logfile manager and set up search scripts to filter and group messages. However, this is a lot of work and it is better to let an automated monitoring tool do the work for you.
The best distributed tracing monitoring tools
The producers of the best distributed monitoring systems have been able to exploit many of the built-in features of the trace message format to produce very comprehensive and attractive monitoring services.
Our methodology for selecting a distributed tracing system
We reviewed the market for distributed tracing tools and analyzed the solutions based on the following criteria:
- The ability to interact with serverless providers
- Application dependency mapping
- OpenTelemetry, OpenTracing, or OpenCensus compatability
- Data retention for historical analysis
- Alerts and notifications for performance problems
- A free trial or a demo system that offers an obligation-free testing opportunity
- Value for money from a monitoring tool that competently tracks microservices at a fair price
Using this set of criteria, we looked for distributed tracing systems that can provide full activity and dependency maps for microservices.
1. Datadog APM

Datadog APM is a very similar service to that offered by New Relic. This is a cloud-based application performance monitor that includes many types of source data, including distributed tracing messages.
Key Features:
- End-to-End Tracing: Provides end-to-end tracing of requests across the full stack of an application, from the front-end user interface through to the databases and back-end services.
- Real-Time Visualization: Offers real-time visualization of traces and performance metrics through detailed flame graphs and service maps, helping identify bottlenecks and dependencies within complex systems.
- Advanced Analytics: Includes powerful analytics tools that enable filtering and grouping of trace data based on various criteria like error rates, latency metrics, and endpoints.
- Seamless Integration: Effortlessly integrates with other Datadog products and various external services, allowing for a holistic monitoring environment that includes logs, infrastructure metrics, and synthetic monitoring.
- OpenTracing and OpenTelemetry: Supports OpenTracing and OpenTelemetry, providing a standardized way to collect and process distributed tracing data. This feature is crucial for monitoring microservices and complex, distributed applications.
- Application Dependency Mapping: Visualizes the relationships and dependencies between various services and components within your application, helping to identify bottlenecks and optimize performance.
Why do we recommend it?
Datadog APM has evolved from its original function of monitoring all applications to being specifically geared towards monitoring web applications and microservices – all other application monitoring has been shifted to the Infrastructure Monitoring unit. Distributed tracing is central to the operations of this module.
Datadog APM is able to collect and process OpenTracing and OpenTelemetry messages. The service files these messages along with other indicators. Datadog APM also collects its own statistics on microservice performance and application processing environments with agents, in a similar way to the method used by New Relic. In addition to monitoring standard distributed tracing messages, Datadog APM is able to interface with a range of AWS services, including the Lambda microservices platform.
A great feature of Datadog APM is the way it processes the data that it collects. It is able to generate visual representations that show the connections between microservices operating live in a hierarchy to fulfill requests from a given application. This is called the Service Maps system and it is very impressive. The Service Maps act as an index to all operating microservices that can be zoomed in on for greater detail.
Who is it recommended for?
This package is suitable for use by businesses that use serverless functions or APIs that are provided by others. If you are monitoring your own systems, you don’t need distributed tracing so much because you can insert log message generation to provide performance metrics. The highest plan gives you a code profiler as well.
Pros:
- Ease of Collecting and Processing Tracing Data: Offers a straightforward way to collect and process OpenTracing and OpenTelemetry messages, making it easier to monitor and troubleshoot distributed systems.
- Supports Various Environments: Supports monitoring across diverse environments, including microservices, making it adaptable to different infrastructure setups and development practices.
- Highly Customizable Dashboards: Beneficial for Network Operations Center (NOC) teams as they allow for tailored views and insights that can be adjusted to meet specific operational needs.
- Cloud-Based Monitoring: Being a cloud-based solution, Datadog APM can be accessed from anywhere, providing flexibility and convenience for remote teams and distributed workforces.
- Extensive Integrations: With over 400 integrations, Datadog APM can support nearly any deployment scenario, making it a versatile choice for various technology stacks and tools.
Cons:
- Limited Trial Period: Relatively short trial period. A longer trial period would allow users to better evaluate the tool’s capabilities and fit for their specific needs.
Datadog APM is a subscription service and you can get it on a 14-day free trial.
2. Site24x7 APM
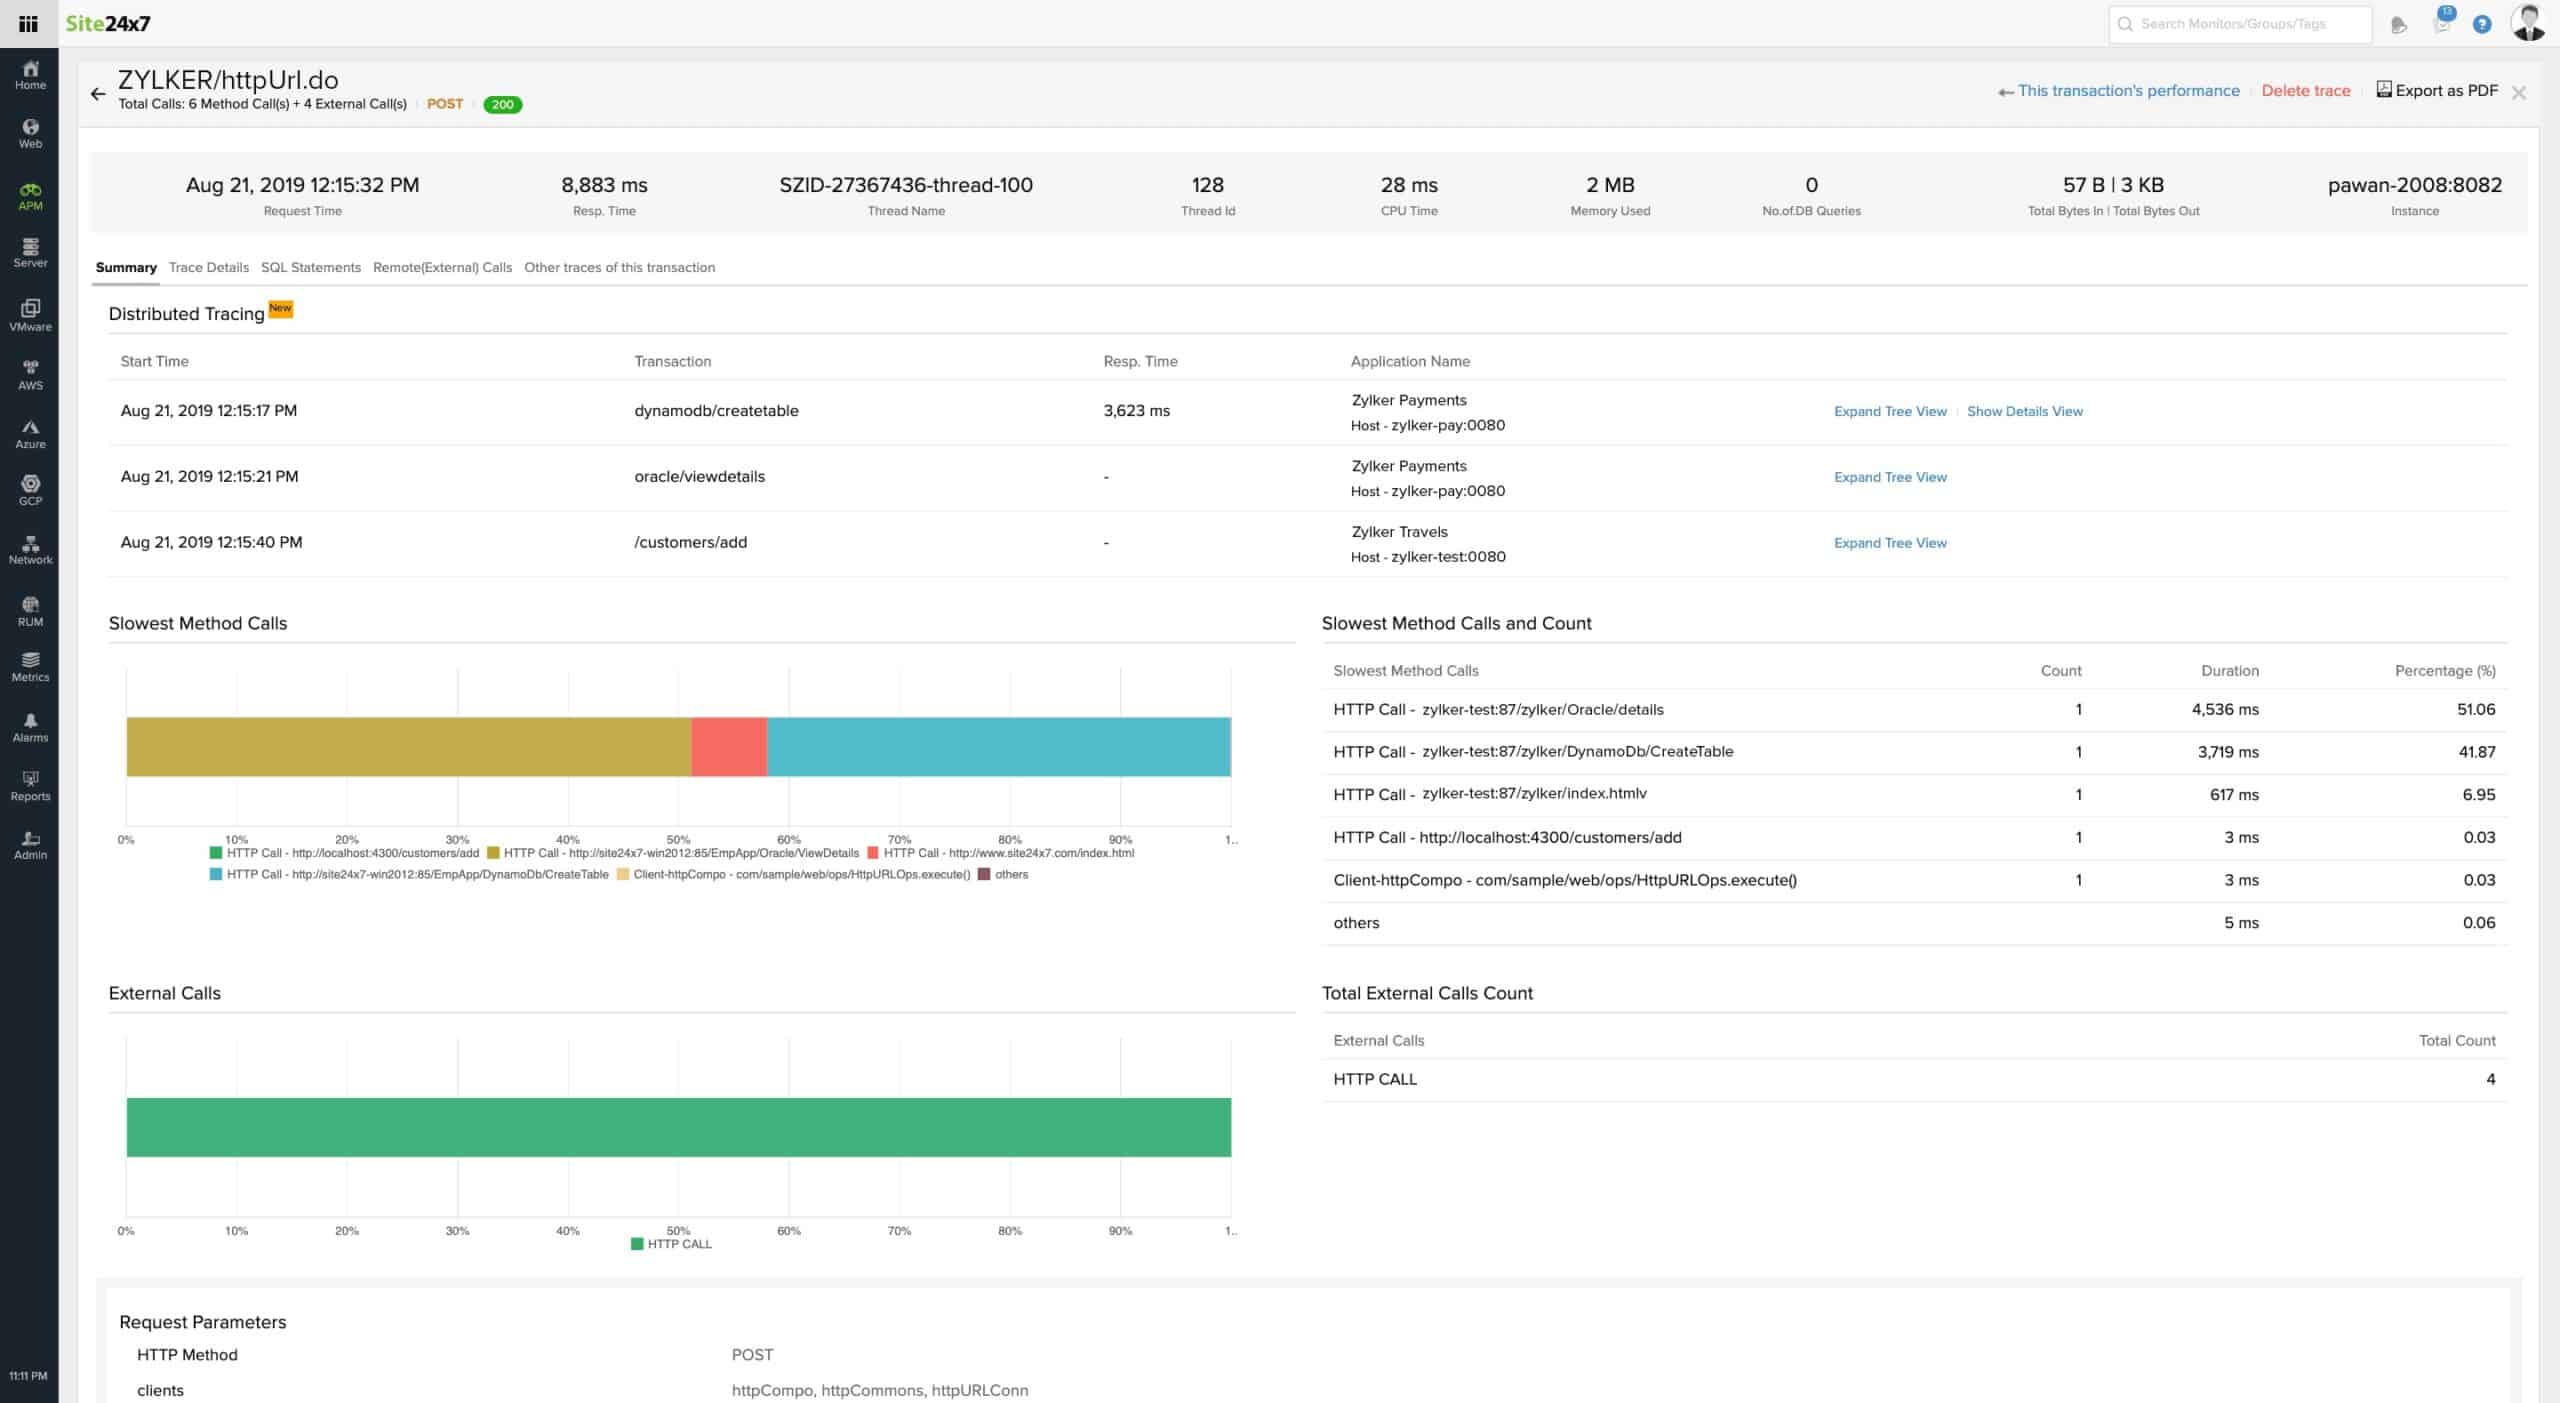
Site24x7 APM is a cloud-based service that is ideally suited to remote monitoring techniques, including distributed tracing for microservices. The company doesn’t reveal which protocols it is capable of interpreting. However, it is able to monitor services written in Java, .NET, and Node.js.
Key Features:
- Performance Metrics: Captures a wide range of performance metrics, including response times, throughput, error rates, and more, for individual components and aggregated services, aiding in pinpointing performance bottlenecks.
- Anomaly Detection: Utilizes machine learning algorithms to automatically detect anomalies and potential issues in application performance, which helps in proactive monitoring and resolution.
- Real-Time Dashboards and Reports: Offers customizable dashboards and detailed reports that provide insights into application health
- Mobile App Performance Monitoring: Extends its monitoring capabilities to mobile applications, allowing you to track performance metrics and user interactions on mobile platforms.
- Resource Monitoring: Monitors the resources utilized by your applications, such as CPU, memory, and disk usage. This helps ensure that your applications are running efficiently and can alert you to resource constraints.
Why do we recommend it?
Site24x7 APM is similar to the Datadog system in that it focuses on Web applications and leaves all other applications to its Infrastructure plan. As well as distributed tracing, you get real-user monitoring and statistics on the activities of cloud platforms, containers, virtualizations, and networks.
The APM is structured to monitor applications running on a server, a website’s activities, and apps for mobile devices. The standard APM package will track the activities of three applications that depend on microservices. This number can be bumped up with add-on fees. The same package also gives you the capabilities to monitor 40 websites and servers in any combination – for example, 20 servers and 20 sites or 20 sites and 10 servers, and so on.
The APM Insights service has a distributed tracing section that gives an overall view of an application’s performance. This includes a graphic representation of the total processing time of the application segmented by the time taken by each contributing microservice. You can drill-down to observe the performance of each individual microservice and then get further in to see each individual message that service generated.
Who is it recommended for?
Site24x7 provides a bundle of services with its APM. These other tools require the purchase of other modules on the Datadog platform. This bundling makes the APM package very affordable, but it is still considerably more expensive than the Infrastructure plan. So, be sure that you really need distributed tracing before choosing this plan.
Pros:
- Integrated Monitoring Solution: Offers integration with other monitoring tools within its suite, including website monitoring, server monitoring, and network monitoring, providing a unified monitoring solution.
- Supports Microservice Monitoring: Provides comprehensive monitoring for microservices built on Java, .NET, and Node.js. This is crucial for modern applications that leverage a microservices architecture.
- Out-of-the-Box Monitoring Options: Offers a variety of out-of-the-box monitoring options and dashboard templates, making it easier to set up and start monitoring without extensive configuration.
- Application Dependency Insights: Administrators can view dependencies within the application stack, which is beneficial for building SLAs and optimizing uptime.
- AI-Enhanced Root Cause Analysis: Utilizes AI to enhance root cause analysis, allowing for faster identification and resolution of technical issues.
Cons:
- Complexity and Learning Curve: A feature-rich platform with a wide range of options that extend beyond distributed tracing tools. As a result, it may require a significant amount of time to learn and master all the available features and options.
Site24x7 APM is a subscription service and you can access it on a 30-day free trial.
Site24x7 APM is a great a distributed tracing tool because it includes a wide range of performance monitoring and lag management utilities as well as microservice tracking. The combination of all of the monitoring techniques deployed by the APM means that it is a great tool for supervising apps written for Android and iOS while also examining how those same microservices perform when called from websites.
Get a 30-day free trial: site24x7.com/signup.html
Operating system: Cloud-based
3. New Relic Telemetry Data Platform
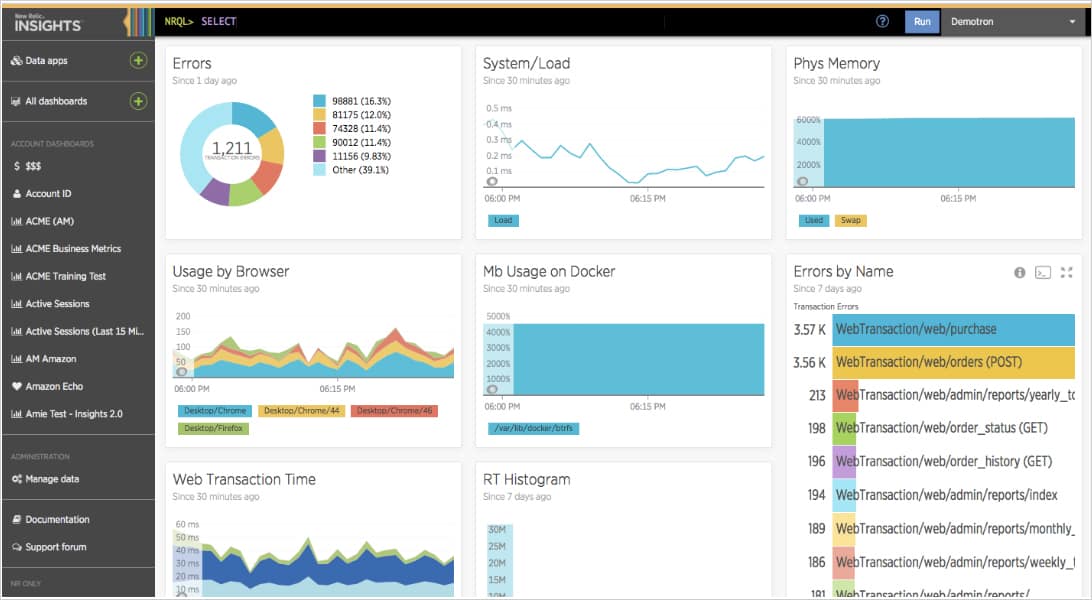
The New Relic Telemetry Data Platform is geared towards developers of apps as well as businesses that want to monitor their microservices infrastructure. The company stresses the affordability of its storage space, which shows that it understands that this type of service involves sorting through masses of data.
Key Features:
- Data Aggregation and Analysis: Aggregates vast amounts of telemetry data across the full stack—applications, services, and infrastructure—enabling complex queries and detailed performance analysis.
- Distributed Tracing: Supports distributed tracing that allows users to track and visualize transactions through each step of a distributed system.
- Trace Sampling and Filtering: Allows you to configure trace sampling and filtering to manage the volume of trace data and focus on the most relevant information for troubleshooting.
- Support For Open Standards: Supports a variety of open standards for distributed tracing, including OpenTelemetry, OpenTracing, OpenCensus, and Zipkin.
Why do we recommend it?
The New Relic Telemetry Data Platform is a leader in the field of distributed tracing. This company pioneered the concept of the APM and their move to focus on monitoring serverless systems with distributed tracing was followed by everyone else in the industry. Monitored subjects can be hosted on AWS or Azure.
New Relic centralizes data collection from many sources, including distributed tracing messages generated through OpenTelemetry, OpenTracing, OpenCensus, and Zipkin. Other data sources for the monitoring system include log files from applications and infrastructure devices plus a long list of AWS services, such as Lambda, and Azure, Apache, and operating system status reports.
The New Relic application monitoring service deploys its own agents to add extra insights into web and app performance, driven by microservice actions. These include browser monitors and connection testers.
Who is it recommended for?
There are several different standards for distributed tracing and they are not compatible. If you are monitoring third-party systems and hope to use distributed tracing, you would be wasting your money if your monitoring package is using a different standard to the functions that you want to track. New Relic covers all known telemetry standards.
Pros:
- Integration with New Relic Tools: Provides seamless integration with other New Relic monitoring tools for comprehensive application performance insights.
- AWS and Azure Integration: Offers seamless integration with major cloud service providers like AWS and Azure for comprehensive monitoring and management of cloud resources.
- On-Site Resource Mapping: Extends its capabilities to include on-site resource mapping, providing a unified view of both cloud-based and on-premise infrastructure.
- Monitoring Across Multiple Environments: Monitor systems across cloud, on-premise, and hybrid environments. This flexibility makes it suitable for a wide range of deployment scenarios.
- Free Tier Availability: Offers a free tier, which is beneficial for in-depth trials and smaller projects. This allows users to explore the platform’s features without any initial financial commitment.
Cons:
- Not a Dedicated Tracing Tool: Requires additional tools and configuration for complete distributed tracing functionality.
- Potential Cost: A paid service, and the costs can scale based on data volume and features used.
New Relic Data Telemetry Platform has a free tier that will process up to 100 GB of data per month.
4. Lightstep

The founder of Lightstep was one of the designers of Google’s Dapper in-house distributed tracing platform. Dapper was open-sourced as OpenCensus, becoming the favored distributed tracing tool of many major IT businesses, including Microsoft. Now, OpenCensus is a part-contributor to the new, unified OpenTelemetry system.
Key Features:
- High-Resolution Tracing: Captures high-resolution traces of transactions across distributed systems, allowing users to visualize the entire path of a request from start to finish, even across microservices and polyglot environments.
- Root Cause Analysis: Leveraging real-time analytics, Lightstep identifies deviations in performance metrics and uses this data to pinpoint the likely root causes of issues within a system.
- Service Health Insights: Provides detailed insights into the health of services, including error rates, latency data, and throughput, which can be drilled down to specific endpoints or operations.
- Deployment Tracking: Correlates changes in system performance with recent code deployments, enabling teams to understand the impact of new releases or updates instantly.
Why do we recommend it?
Lightstep is a competent distributed tracing service and it is one of the best of its kind. However, while rival systems, such as Datadog and Site24x7 also offer opportunities for monitoring networks and other applications, Lightstep only monitors Web applications. It provides the two most widely used protocols for distributed tracing.
Lightstep bases all of its monitoring work on distributed tracing, so it won’t integrate with monitors for other processing activities. However, Lightspeed does microservices monitoring very well and that’s why it gets onto our list of the very best distributed tracing tools.
The graphical representations used by Lightstep to interpret distributed tracing data is the key advantage of this tool. It displays the hierarchy of operating microservices serving an application, which is called the Operations Diagram. This leads to microservice performance data that also shows resource usage graphs and response time visuals.
Who is it recommended for?
Lightstep is a specialized distributed tracing tool, so it won’t integrate with your entire monitoring system. Therefore, you would need to be very intensively using third-party APIs and functions to justify using this tool. This would be suitable for developers and providers that rely on third-party components.
Pros:
- Integration Capabilities: Easily integrates with a wide array of popular development, monitoring, and deployment tools, enhancing workflow efficiencies and broadening its applicability.
- User-Friendly Interface: Designed to be intuitive, making complex data accessible and actionable for users, even those who may not be deeply technical.
- Performance Analytics and Root Cause Analysis: Goes beyond basic trace visualization by offering advanced performance analytics and error tracking tools.
- Free Community Edition: Free Community Edition allows users to access core features and gain valuable insights into their applications without incurring any costs.
Cons:
- Vendor Lock-In: While offering OpenTelemetry support, the platform itself is a proprietary solution, which might limit your options if you need to switch to another distributed tracing tool in the future.
- Limited Free Tier: The free tier has limitations on data volume and features compared to the paid plans.
Lightstep is a subscription service that is delivered from the Cloud. It is available in three editions: Community, Pro, and Enterprise. The Community edition is free to use and the Pro version is available on a 14-day free trial.
5. Dynatrace
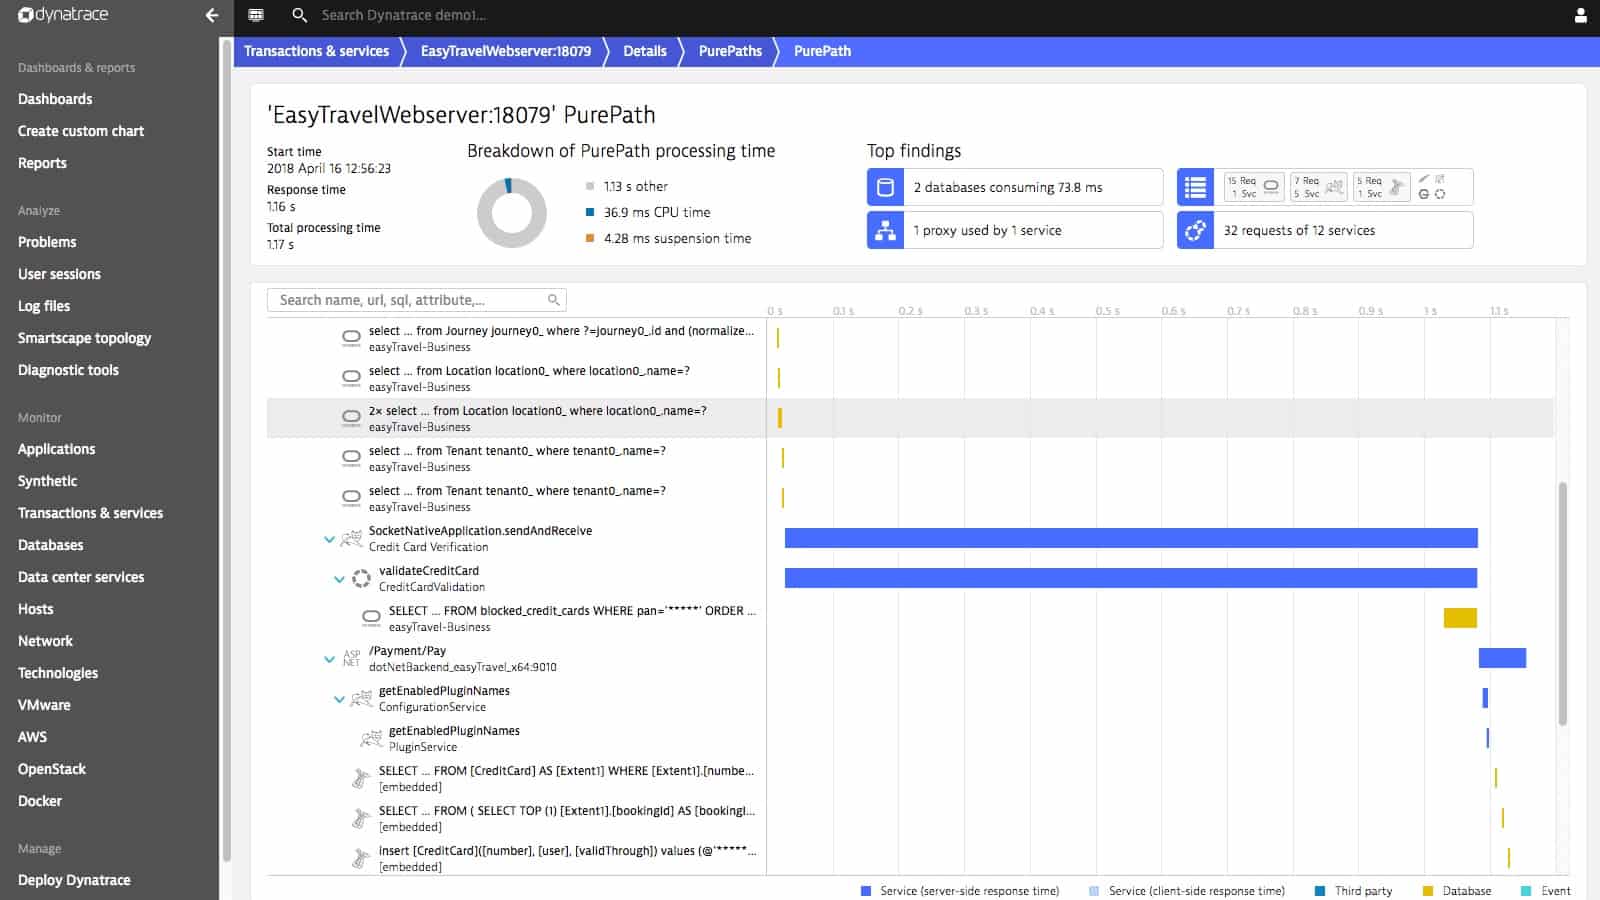
Dynatrace is an AI-driven application performance monitor that is delivered from the Cloud. While covering many methods for status detection, Dynatrace applies machine learning and heuristics to identify important information from the large amounts of data that most reporting and logging systems generate.
Key Features:
- OpenTracing: Supports OpenTracing, enabling it to track distributed traces across various applications and services.
- Development Support: Offers robust support for development, providing tools and features that help developers diagnose issues, optimize performance, and ensure high-quality code.
- AI-Based Monitoring: Utilizes AI to automate monitoring and root cause analysis. This AI-driven approach helps in identifying performance anomalies, predicting potential issues, and providing actionable insights.
Why do we recommend it?
Dynatrace provides Infrastructure Monitoring and a higher plan that gives you an APM as well. This APM relies on distributed tracing for Web application monitoring and for all other assets, you would rely on the Infrastructure system – the combined package is called Full Stack Monitoring.
Among the data sources for the Dynatrace system is the distributed tracing open standard OpenTracing. Dynatrace collects and processes activities that contribute to a given application. It then tracks back, by interpreting distributed tracing messages to identify all of the microservices that worked on a session for that application.
The support that Dynatrace gives to system managers and developers enables new microservices to be written efficiently and tested. Systems managers can let Dynatrace monitor application performance because it will raise an alert if it identifies a problem with a microservice.
Who is it recommended for?
Dynatrace is a multipurpose system that can monitor on-premises systems and cloud services, so you would be able to use it for all of your monitoring needs, not just Web application tracking. Its distributed tracing function uses OpenTracing and its successor OpenTelementry, so if the functions you tracing integrate some other standard, you will be in trouble.
Pros:
- Tracks Distributed Traces Using OpenTracing: Excels at tracking distributed traces using OpenTracing, offering deep visibility into application performance and interactions across microservices.
- Highly Visual and Customizable Dashboards: Provides highly visual and customizable dashboards, making it an excellent choice for enterprise Network Operations Centers (NOCs).
- Cloud-Based and Platform-Independent: Operates in the cloud, allowing it to be platform-independent. This flexibility makes it suitable for a wide range of environments.
Cons:
- Designed for Large Networks: Specifically designed for large networks and enterprise environments. Smaller organizations may find the product overwhelming due to its extensive features and complexity.
You can experience the Dynatrace application monitor on a 15-day free trial.
Choosing a distributed tracing monitoring tool
All distributed tracing standards include a priority field in the message structure. This is a great help because it means that distributed tracing monitors can quickly categorize the statuses of all microservices working on a session and generate alerts when high-priority messages come through. Alert-based systems allow technical staff to get on with other tasks, assuming that all microservice operations are working well. They only need to pay attention to the monitor when an alert arises.
The messaging system includes an identifier field that each microservice adds a number to. This identifier gives a trace through the microservice hierarchy and enables monitoring tools to identify the structure that serves an app. Really good monitors produce live maps of this process hierarchy that really exposes the complexity of all the interactions that are going on.
Alerts, graphs, and analysis tools make the supervising microservice activity a lot easier. The best-distributed tracing monitors cut through all of the clutter of a mass of messages to present a clear live picture of microservice activity.
Distributed tracing tools FAQs
What distributed tracing tools?
A distributed tracing tool is an application monitoring package that is able to run alongside microservices and record performance data. Microservices are hosted on “serverless” cloud accounts. These do not leave any space on which to install the monitoring software or even a data collection agent. Thus, traditional monitoring services can’t be used because they rely on being able to run on the same server in order to gather statistics. Instead, distributed tracing uses a method called telemetry.
What is distributed tracing?
Distributed tracing is the practice of identifying all of the modules that contribute to the operations of a Web application or mobile app. Once a frontend application is run, it will call in many other backend functions, which might be hosted elsewhere. The distributed tracing system has to follow that execution hierarchy in order to identify the precise source of performance errors or security weaknesses.
What is tracing DevOps?
DevOps environments merge the development team and operations team into one group. These people both create and manage applications and this strategy is particularly applied to the provision of Web applications and mobile apps. During development, tracing is used to verify APIs, frameworks, and function libraries that are going to be used to build the application, then it is used during system testing. When the application goes live, operations monitoring requires tracing to ensure the efficient and secure execution of the application.

