

Maintaining the health and performance of a network is essential for any organization, and Linux-based systems are often at the heart of many infrastructures. Network monitoring tools for Linux are vital for administrators to track, troubleshoot, and optimize the performance of their network environments. These tools provide real-time insights into traffic flow, identify issues such as bottlenecks or security vulnerabilities, and help ensure that network resources are being used efficiently.
Linux, known for its open-source nature, offers a wide range of network monitoring tools that cater to diverse needs, from small businesses to large enterprises. These tools can monitor various network aspects, including bandwidth usage, uptime, packet analysis, and latency. They also provide valuable data on device performance, connectivity, and the overall health of the network, enabling administrators to take proactive measures to avoid system outages or failures.
One of the key advantages of Linux network monitoring tools is their flexibility. Many tools are highly customizable, allowing administrators to tailor them to specific monitoring requirements, integrate them with other network management systems, and automate certain tasks. Additionally, most of these tools are lightweight and efficient, making them suitable for use in resource-constrained environments.
In this article, we will explore some of the most effective and widely used Linux network monitoring tools, discuss their features, and examine how they help administrators maintain reliable and secure networks. Whether you’re an IT professional managing a corporate data center or a hobbyist exploring Linux networking, these tools are essential for keeping your systems running smoothly and securely.
Here is our list of the best Linux Network Monitoring Tools:
- N-able N-central EDITOR’S CHOICE An excellent choice for IT departments and managed service providers. This network monitor comes with a modified version of CentOS bundled into in and installs on a bare metal server. Start a 30-day free trial.
- ManageEngine OpManager (FREE TRIAL) It is available for Linux and Windows Server and this network performance monitor uses SNMP procedures to keep the network running smoothly. Download a 30-day free trial.
- Site24x7 Network Monitoring (FREE TRIAL) A cloud-based network management service that can monitor onsite wired and wireless networks, cloud resources, and remote networks. Access a 30-day free trial.
- Paessler PRTG (FREE TRIAL) The cloud service version of this very popular infrastructure monitoring system. It watches over networks, servers, and applications. Access a 30-day free trial.
- Datadog Network Performance Monitoring A SaaS network management service that is accessed through any standard browser. It can manage multiple sites and check internet connection quality.
- Nagios XI An on-premises network monitoring system that installs on Linux and covers all aspects of network performance.
- Zabbix A free infrastructure monitoring system that is available for installation on Linux, Unix, macOS, and Windows. It can monitor onsite wired and wireless networks, cloud servers, remote sites, and internet performance.
- Icinga 2 This Linux-based network monitoring package is a fork of Nagios Core and can integrate Nagios plugins.
You can read more about each of these options in the following sections.
What is Linux network monitoring?
Linux is an operating system for computers: endpoints or servers. Most network devices have their own firmware. So, when people talk about Linux network monitoring, they either mean monitoring a network where some or all of the connected computers run the Linux operating system or they mean running network monitoring software on a Linux host.
Networks are run on protocols that are operating system-independent. The most common form of a network system in the world is TCP/IP. This interfaces very easily with internet connections because the IP part of TCP/IP stands for Internet Protocol.
The majority of network monitoring systems use the Simple Network Management Protocol (SNMP) for their operating procedures. SNMP is not reliant on one particular operating system. All network devices already have one part of the SNMP system pre-installed on them when you buy them. This is the SNMP device agent. The only element missing from the monitoring system is the SNMP manager. So, network monitoring tools provide that the SNMP manager function. This enables them to gather all of the device statistics and traffic information that the device agents compile.
Top network monitoring tools interpret those device agent reports into time-series graphs and easy-to-read charts. Data collected on device statuses can be stored to produce performance analysis. This helps network managers plan capacity.
Another great feature of these SNMP-based network monitoring tools is that the device agent will send out a warning if they detect problems. These warnings, called traps, can be interpreted into alerts in the network monitoring tool. Alerts enable the IT support team to leave the monitor to watch over the network and assume that everything is OK unless notification to the contrary arises.
The only distinctive feature of a Linux network monitoring tool is that it can be run on or accessed from a Linux computer.
The best Linux network monitoring tools
Pay attention to the descriptions of these tools that we recommend because not all of them require an installation on a Linux computer.
Cloud computing is becoming very popular, so we have included a couple of SaaS network monitoring tools for those who don’t want to fill up your own server space with a network monitoring tool’s resource demands.
There is also an option that has a Linux operating system bundled into it, so you can install it on a new bare metal server without having to go through the process of installing Linux separately first.
The Best Linux Network Monitoring Tools
Our methodology for selecting a Linux network monitoring tool
We reviewed the market for network monitoring systems for Linux and analyzed tools based on the following criteria:
- Network device status checking
- Autodiscovery of connected devices
- Network topology mapping
- Network traffic tracking
- Virtualization monitoring
- A free trial or a demo system for a risk-free assessment opportunity
- Value for money from a monitoring tool that can run on or monitor Linux systems at a fair price
With these selection criteria in mind, we have identified reliable systems for Linux that will monitor networks constantly. We considered software that can be installed on Linux and also those offered from cloud platforms.
1. N-able N-central EDITOR’S CHOICE

N-able N-central runs on a modified version of CentOS Linux. However, there is no need to install the operating system before adding on N-central because the software package has the operating system bundled into it, so it needs to be installed on a bare-metal server.
N-central is suitable for small and middle-sized businesses and it can also be used by Managed Service Providers (MSPs) when supporting the networks of clients. The service can manage remote sites and allow the management of several sites through the same interface. It can also monitor cloud resources and internet connections to them.
Key Features:
- Monitors Networks and Endpoints: Continuous data collection with SNMP and WMI
- Includes Mobile Device Management: Laptops running any operating system or Apple mobile devices
- Autodiscovery and Topology Mapping: Data gathering provided by SNMP
- Patch Management: Automated patch availability discovery and rollout
- A Backup Service: An add-on service
Why do we recommend it?
N-able N-central is a remote monitoring and management package for use by managed service providers. The tools in this service include automated monitoring for networks and endpoints. It can track activity on devices running Windows, Linux, and macOS. The package includes an autodiscovery service, which compiles an asset inventory.
As well as monitoring the network, N-central can monitor endpoints and servers. Monitored devices can be running Linux, macOS, Windows, or Windows Server. It is also possible to manage mobile devices through the N-central system. The Mobile Manager enables mass configurations of mobile devices, rapid onboarding, device location tracking, and remote locking and wiping.
The system starts its service by exploring the network and logging all of the devices connected to it. This autodiscovery feature compiles a device inventory and will also draw up a network topology map automatically. The inventory and map are constantly updated and will change to reflect any alterations in the network. In the dashboard, the topology view of the network has a device summary list next to it with the status of each device displayed in traffic light colors for rapid problem recognition.
The security tools included with N-central include a patch manager and a backup manager. Network security in the bundle gives a firewall, web protection access management, disk encryption, and intrusion detection. There are also endpoint detection and response agents to protect each computer on the network.
Who is it recommended for?
Although most remote monitoring and management tools are designed for use by IT departments as well as managed service departments. However, N-able produced N-sight for use by IT departments and smaller MSPs. N-central is designed for use by large managed service providers. This package installs on bare metal servers.
Pros:
- Designed for Medium to Large Enterprise Networks: Handles large volumes of operations data
- Offers Numerous Multi-Tenant Features: Suitable for managed service providers
- Automatically Discovers New Assets: Updates the network map
- Task Automation: Assemble workloads for a process flow editor or upload scripts
- Automation Library: 650 pre-written scripts
Cons:
- No Price List: Request a quote
There is also an Automation Manager included in N-central that allows network managers to set automatic responses to detected problems. N-able offers a 30-day free trial of N-central.
EDITOR'S CHOICE
N-able N-central is our top pick for Linux network monitoring because it has the CentOS Linux operating system built into it. The service can monitor Linux servers and endpoints as well as devices running firmware, Windows, and macOS. The network management bundle extends to mobile devices and the whole network infrastructure, whether local, remote, cloud-based, or hybrid gets protected by security monitoring as well.
Download: Get a 30-day FREE Trial
Official Site: n-able.com/products/n-central/trial
OS: Bare-metal server
2. ManageEngine OpManager (FREE TRIAL)

ManageEngine OpManager is an SNMP-based network monitor and the central tool in a suite of infrastructure management systems produced by ManageEngine. This software can be installed on Linux and Windows Server.
Key Features:
- Network and Endpoint Monitoring: Runs on Linux, Windows Server, AWS, and Azure
- Network Discovery: Hardware inventory and network topology map creation
- Network Device Status Monitoring: Operates with SNMP processes
Why do we recommend it?
ManageEngine OpManager is a monitoring package for networks and servers. This is an SNMP-based system that will detect all devices connected to a network, map them, and create an inventory. The service can watch the resources on multiple servers simultaneously and those computers can be running Windows Server or Linux.
The tool includes an autodiscovery feature that identifies all devices connected on the network and logs them in an asset inventory. The inventory database forms the basis for a topology map. Both the topology map and the inventory are updated live in line with any changes to the network.
The monitor is able to observe wireless networks as well as on-site LANs. It can include coverage of Cloud services and remote networks as well. OpManager can also monitor hypervisor implementations of VMWare, Hyper-V, and Citrix Xen.
The system watches over network activity, so department technicians can work on other priorities. OpManager raises an alert when problems arise. These alarms appear in the system dashboard and can optionally be sent out to key staff members by email or SMS. It is possible to access the system dashboard through a mobile app, so technicians out on call don’t need to dash back to the office to see what’s wrong.
Who is it recommended for?
This tool is a good choice for businesses that aren’t interested in SaaS packages. You get a software bundle and install it on Windows Server or Linux. It is also possible to run the package on your AWS or Azure account. There is a Free edition but that is limited to Ping-based availability monitoring.
Pros:
- Virtualization Monitoring: VMware, Hyper-V, and Citrix Xen
- Network Troubleshooting Tools: Ping and Traceroute
- Free Edition: Limited to monitoring three devices
Cons:
- Package Doesn’t Include Traffic Analysis: You need ManageEngine NetFlow Analyzer for that
OpManager is free to use to monitor up to three devices. ManageEngine offers the full system on a 30-day free trial.
3. Site24x7 Network Monitoring (FREE TRIAL)
Site24x7 is a cloud-based network monitoring system. Its creators are the same people behind OpManager – both Site24x7 and ManageEngine are divisions of Zoho Corp. This service uses SNMP to monitor the health of network devices. As a cloud service, it doesn’t matter where those devices are, so the system can manage multiple sites and link them together as one WAN monitoring service. The tool can also monitor wireless networks and include cloud services in the network.
Key Features:
- Delivered from the Cloud: Plans provide full stack observability
- Network Discovery: Creates an inventory and a topology mapping
- Network Device Monitoring: SNMP-based processes
- Traffic Analysis: Uses NetFlow, sFlow, J-Flow, Cflow, IPFIX, NetStream, and AppFlow
- Alerts for Performance Problems: Can be forwarded as notifications by email, SMS, or voice call
Why do we recommend it?
Site24x7 Network Monitoring is part of a cloud platform that provides monitoring services for endpoints, and applications as well as networks. This means that you can monitor Linux computers as well as network devices in one console. The service includes discovery and IT asset inventory creation and it also draws up a network map.
The main detection system discovers all devices connected to the monitored network and logs them. This list of devices is available for examination in the dashboard of the service. It is also the foundation of a network topology map, which gets drawn up automatically. The network inventory and map are kept up to date with any changes in the network.
Among the systems that the monitor will check on are VPNs, firewalls, UPSs, printers, load balancers, switches, routers, endpoints, servers, and storage devices.
The monitor converts SNMP traps into alerts, which will appear in the dashboard and can also be delivered by email and SMS. Technicians can access the dashboard through any standard browser or a mobile app.
Who is it recommended for?
Site24x7 provides subscription plans that combine all of its monitoring tools. This means that any business can get automated monitoring for all of its assets in one package. The system can group together assets on multiple sites in one account and the based packages are priced at levels to suit small businesses.
Pros:
- Combines Network Device Monitoring and Traffic Analysis: A rare combination
- Protocol Analysis: See traffic volumes per application
- Synthetic Monitoring: Tests website availability
- Shows Top Traffic Generators: Applications and endpoints
Cons:
- Can’t Just Subscribe to the Network Monitoring Service: You have to take a plan that provides all of the modules on the platform
Site24x7 is charged for by a subscription. The charging structure is quite complicated with a base fee levied per year and then a series of feature add-ons. You can get a 30-day free trial of Site24x7 Network Monitoring.
4. Paessler PRTG (FREE TRIAL)

Paessler PRTG is one of the leading infrastructure monitoring systems but it is written for Windows Server. If all of your environment is Linux, you can still use PRTG in its SaaS form. Paessler offers a hosted PRTG, which eliminates the need to install the software on your own servers.
Key Features:
- Cloud-Based or On-Premises: The downloadable software package runs on Windows Server
- LAN Monitoring: A centralized multi-site monitoring option is available
- Network Discovery: Creates an inventory and a network topology map
Why do we recommend it?
Paessler PRTG is a bundle of monitoring tools and you customize the package by deciding which of those elements to activate. The service includes options for network and endpoint monitoring. An autodiscovery routine compiles an asset inventory and a network topology map. The package is based on SNMP routines.
PRTG monitors networks, servers, and applications. However, the system is composed of a series of monitoring services and the user can decide which of these to activate, thus tailoring the service. So, it is possible to limit the system to just network monitoring.
The network monitor in PRTG has a range of options. The main service is based on SNMP and it includes an autodiscovery service. This creates a device inventory and draws up a network topology map. The PRTG system is also very good for monitoring virtualizations because it watches the dynamic allocation of VMs to servers.
Other network monitoring methods available in the PRTG package include Ping, Traceroute, NetFlow, sFlow, and J-Flow. These options provide traffic statistics while the SNMP service watch device health.
Who is it recommended for?
PRTG is suitable for businesses of all sizes. You only pay for the number of sensors that you activate, so it is possible to control your costs by eliminating the services that you don’t really need. You don’t have to pay anything for the package if you only activate 100 sensors.
Pros:
- A Bundle of Sensors: Select those that you need to monitor your Linux servers and infrastructure
- Traffic Flow Monitoring: Uses NetFlow, IPFIX, sFlow, and J-Flow
- Free Edition: Gives you an allowance of 100 sensors
Cons:
- Won’t Run on Linux: The on-premises system is only available for Windows Server
The price for PRTG is charged for by subscription with a rate per month depending on how many sensors can be activated. Options are for 500, 1,000, 2,500, 5,000, and 10,000. You can register for an unlimited 30-day free trial to asses your network requirements.
5. Datadog Network Performance Manager
Datadog is a cloud-based network monitor so it can be accessed from any operating system through a standard browser. This service requires an agent to be installed on the monitored network and it can cover remote sites and cloud services as well as your home network.
Key Features:
- SaaS Package: Companion to the Network Device Monitoring unit
- Traffic Flow Monitoring: Uses NetFlow
- Monitors Connections to Cloud Services: Particularly scrutinizes paths to edge services
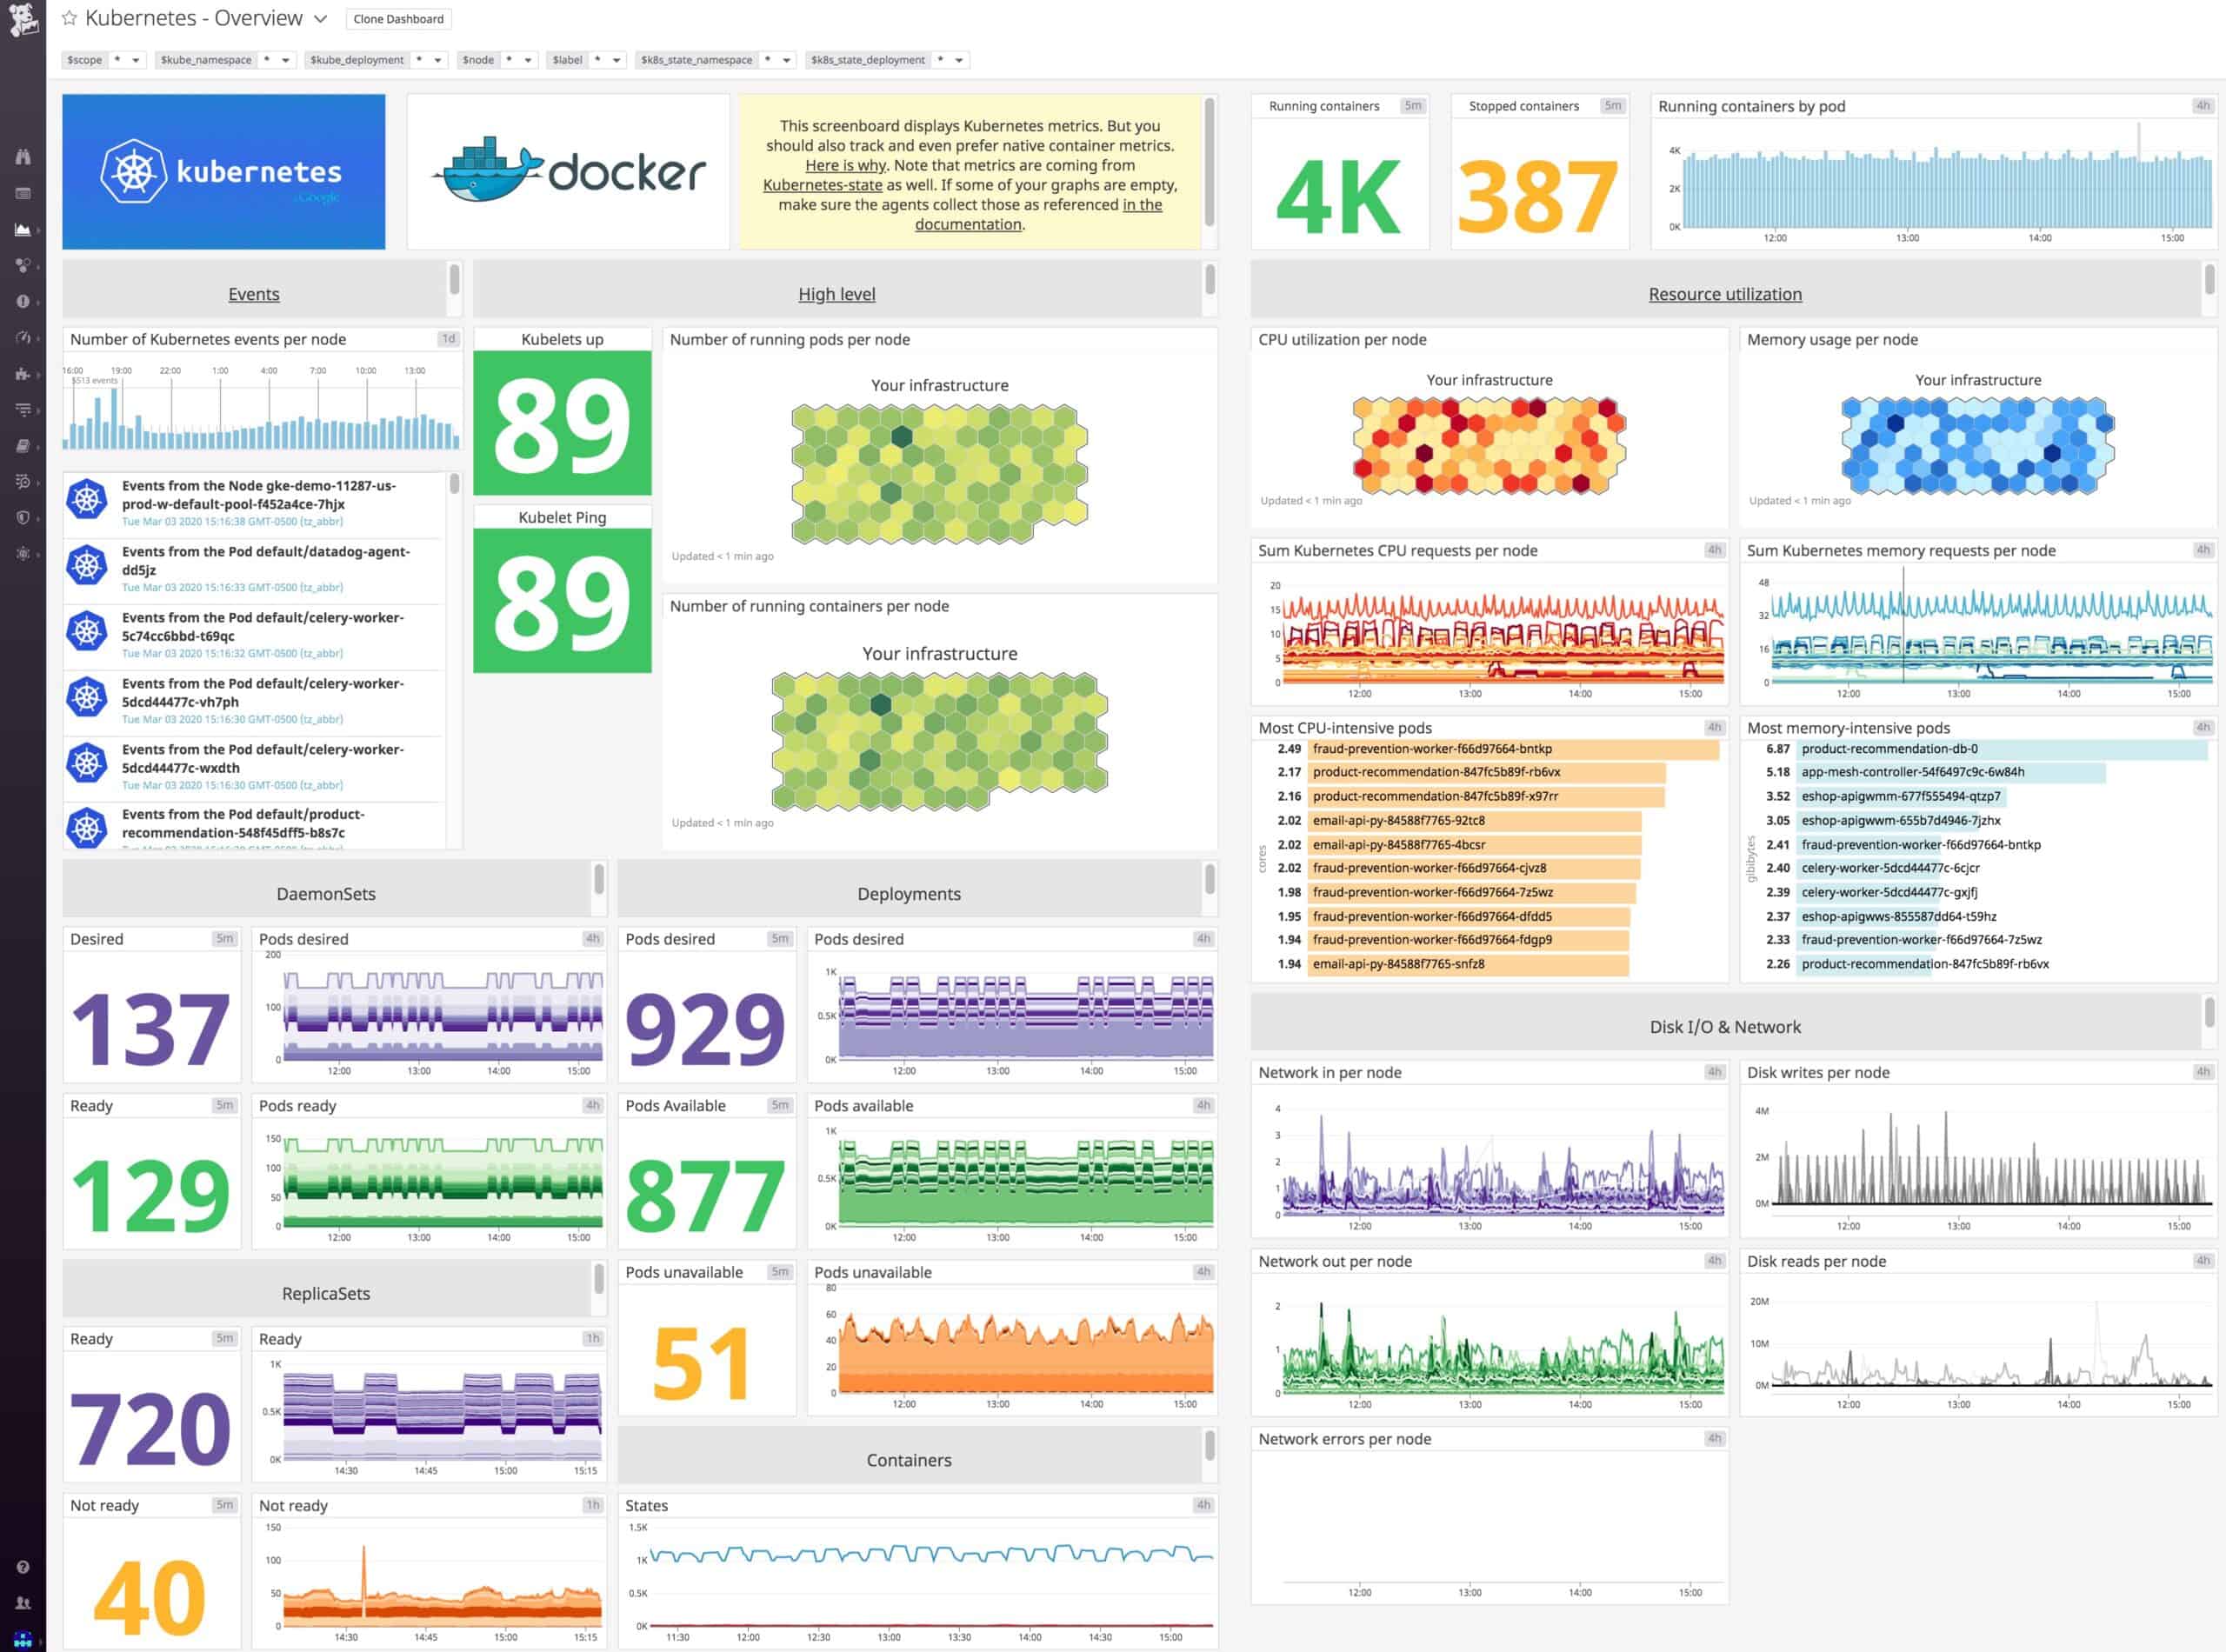
Why do we recommend it?
Datadog Network Performace Monitoring is part of a cloud platform that is very similar to the Site24x7 system. The Network Performance Monitor provides traffic analysis and a network mapping feature. The tool gathers statistics with NetFlow, IPFIX, and similar protocols. You need to get the Network Device Monitoring service for autodiscovery and SNMP-based services.
This is an SNMP-based network monitor, so it includes alerts, derived from trap messages. The Datadog Network Monitoring service explores your network, documents all devices, and draws up a topology map. Both the inventory and the map get updated automatically when devices are added, moved, or removed.
The dashboard shows summary data of live performance metrics, which can all be drilled down to detailed views of each device. The screens also include attractive graphs and charts. Those metrics get stored for historical analysis.
The network monitor also tracks traffic volumes and it can map hypervisor implementations and record all container activity.
Who is it recommended for?
The pricing structure of Datadog is a little more complicated than that of Site24x7. You pay for each module individually. However, some modules are dependent on the existence of others. This is the case with the Network Performance Monitoring module, which is dependent on the Infrastructure package.
Pros:
- Monitors Standard Web Services: Checks on SSL certificates, and DNS performance
- Records Network Errors: Packet loss, latency, and retransmissions
- Attractive Console: Accessed through any standard Web browser
Cons:
- Extra Purchase Necessary for Network Discovery: Relies on the Datadog Infrastructure Monitoring Module
The online monitoring system is charged for by subscription with a charge per host per month. You can get a free trial to examine the system without obligation.
6. Nagios XI
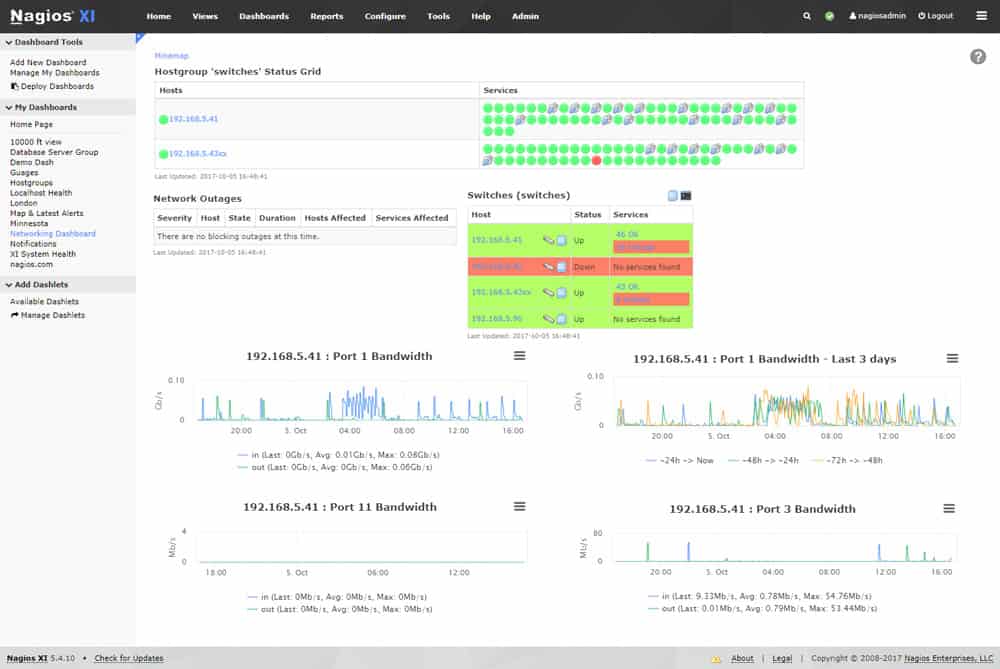
Nagios XI is a full infrastructure monitoring system and it runs on CentOS or RHEL Linux. The system is based on a free, open-source project, called Nagios Core. There is a very large user community for Nagios and many other users produce extensions for the system, called plugins. Third-party software producers have also created plugins to enable their products to integrate with Nagios. So, this network monitor is very flexible – there are thousands of plugins for it.
Key Features:
- Runs on Linux: Other options include running the software on Docker or a VM
- Full Stack Monitoring: Monitors networks, servers, and applications
- Extensible with Free Plug-Ins: A large library of user-provided packages
Why do we recommend it?
Nagios XI is an on-premises package that provides monitoring for networks, servers, and applications. The system includes an autodiscovery function, inventory creation, and topology mapping. It is able to also watch over server resources. All of the monitors in the package are loaded with performance thresholds that trigger alerts when crossed.
The monitoring tool will cover networks, servers, and applications. The network monitor has its own communications protocol, so it doesn’t use SNMP. However, there is an SNMP plugin available. The dashboard shows live device statuses and system alerts. The service also monitors bandwidth usage and event log messages.
Who is it recommended for?
The Nagios XI system is very large and probably more than small businesses would need. However, mid-sized and large organizations can tailor the system and expand it by accessing a library of free plug-ins. Traffic analysis has been removed to a separate package. The software runs on Linux, VMware, or Hyper-V.
Pros:
- Free Version Available: Called Nagios Core
- Continuously Repeating Autodiscovery Routine: Creates and updates an inventory and a network topology map
- Network Device Monitor: Based on SNMP
Cons:
- No Traffic Monitoring: This is a separate package, called Nagios Network Analyzer
Nagios XI is available in two editions: Standard and Enterprise. Extra features in the Enterprise edition include capacity planning and auditing. You can get a 30-day free trial of Nagios XI.
7. Zabbix
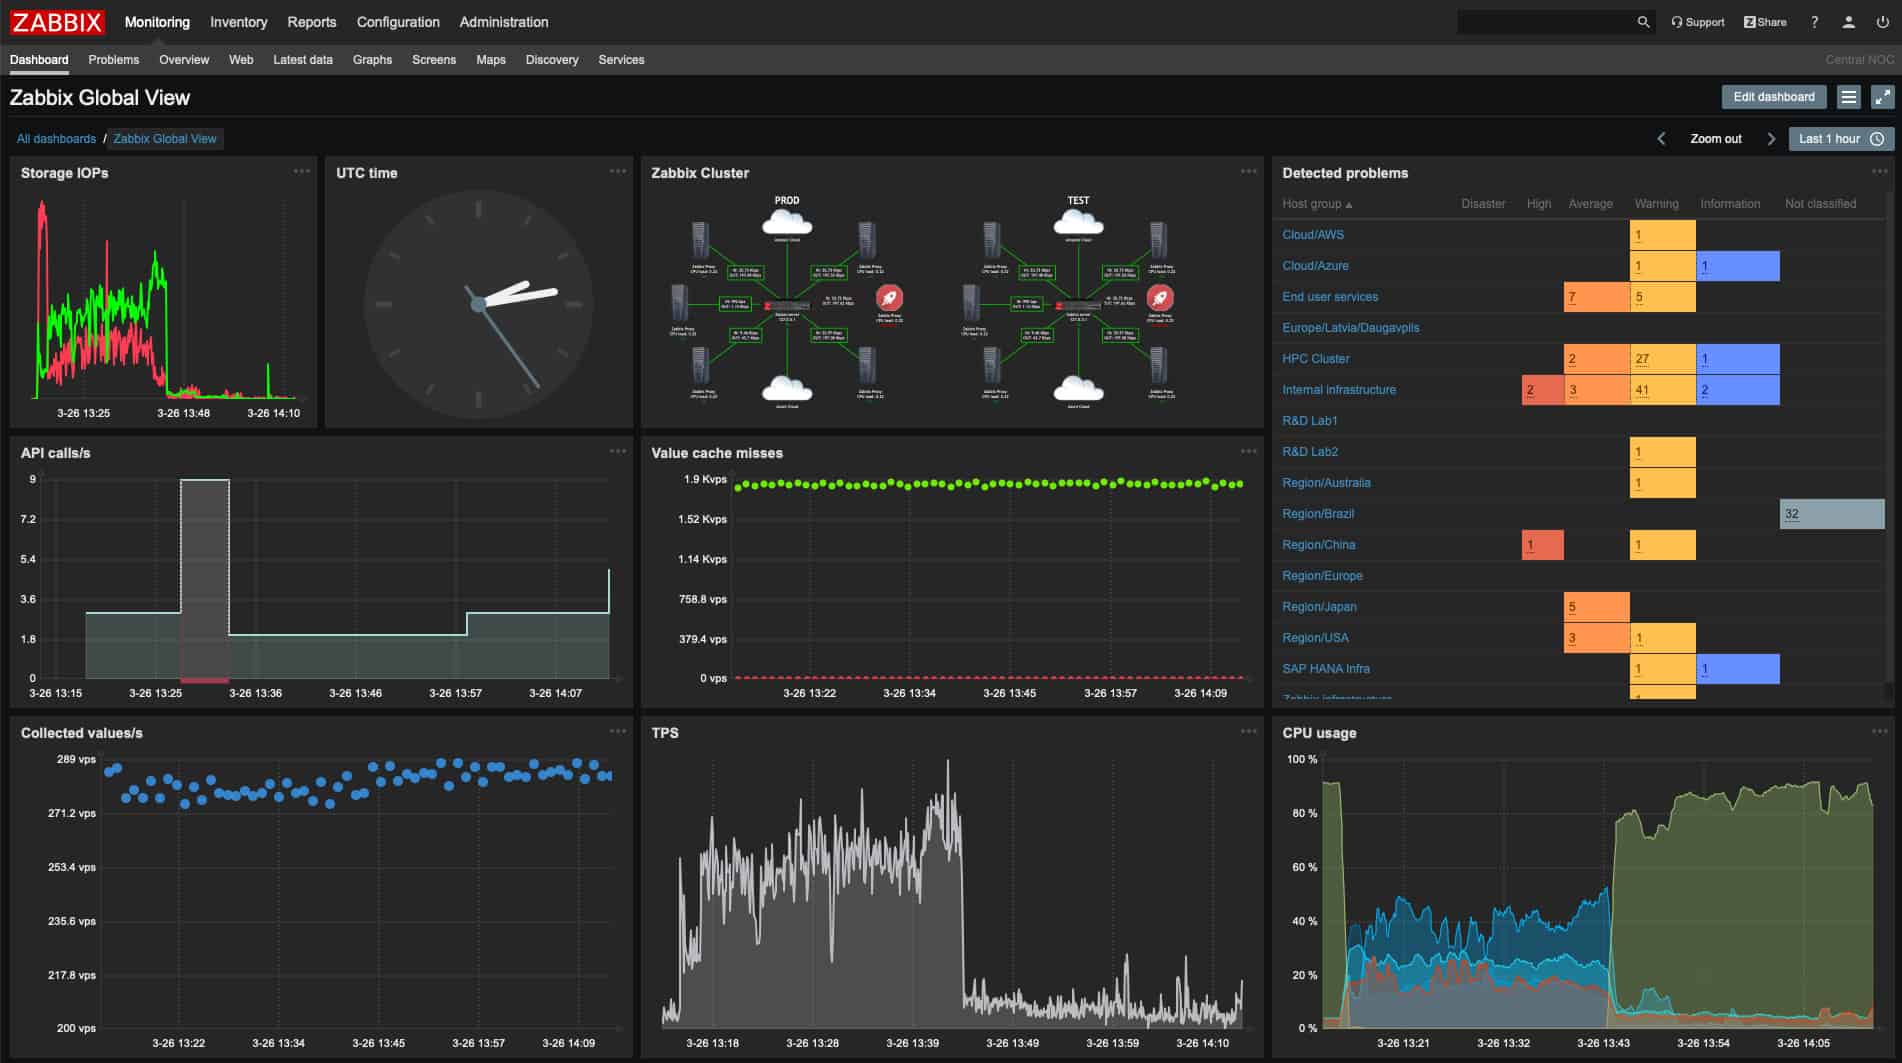
Zabbix is a free infrastructure monitoring system that can be installed on Linux. It is also available for Windows, macOS, and Unix. Despite being free, the Zabbix dashboard has a very professional look and feel. The screens are well laid out and feature attractive data visualizations.
Key Features:
- Free to Use: There isn’t a paid version
- Runs on Linux: Also on Docker, virtualizations, and cloud platforms
- Hybrid Network Monitoring: Monitors multiple sites and cloud resources
Why do we recommend it?
Zabbix is a free system monitoring package that covers networks, servers, and applications. The core system can be expanded and customized by selecting a free template from the Zabbix library. This system’s console screens can also be customized. The package provides device discovery, asset inventory creation, and network mapping.
Zabbix can monitor LANs, wireless networks, Cloud-based resources, and remote sites. Communications with remote data collectors are encrypted. The service starts its monitoring by tracking down all devices connected to the network and listing them in an inventory. This is a continuous process so all changes to the device inventory are detected immediately.
This is an SNMP-based system, so it also features alerts. Status alerts are shown in the dashboard and can also be set up to be sent through email, SMS, or chat app. Alerts can be customized and task automation features can be triggered by an alert. Other non-critical tasks can also be set to run on a schedule.
Who is it recommended for?
Zabbix is a good choice for small businesses and other organizations that are short on funds. Large businesses that require a professional support package can subscribe to one from the Zabbix corporation. This system is available for Linux, cloud platforms, and Docker. It is also offered as a virtual appliance or loaded onto a physical device.
Pros:
- Network Discovery: Uses both SNMP and ICMP for broader monitoring ranges
- Network Documentation: Hardware inventory and network topology map
- Traffic Flow Monitoring: Provided by integrations
Cons:
- No Paid Support Option: You can buy a professional support package from Zabbix
8. Icinga 2
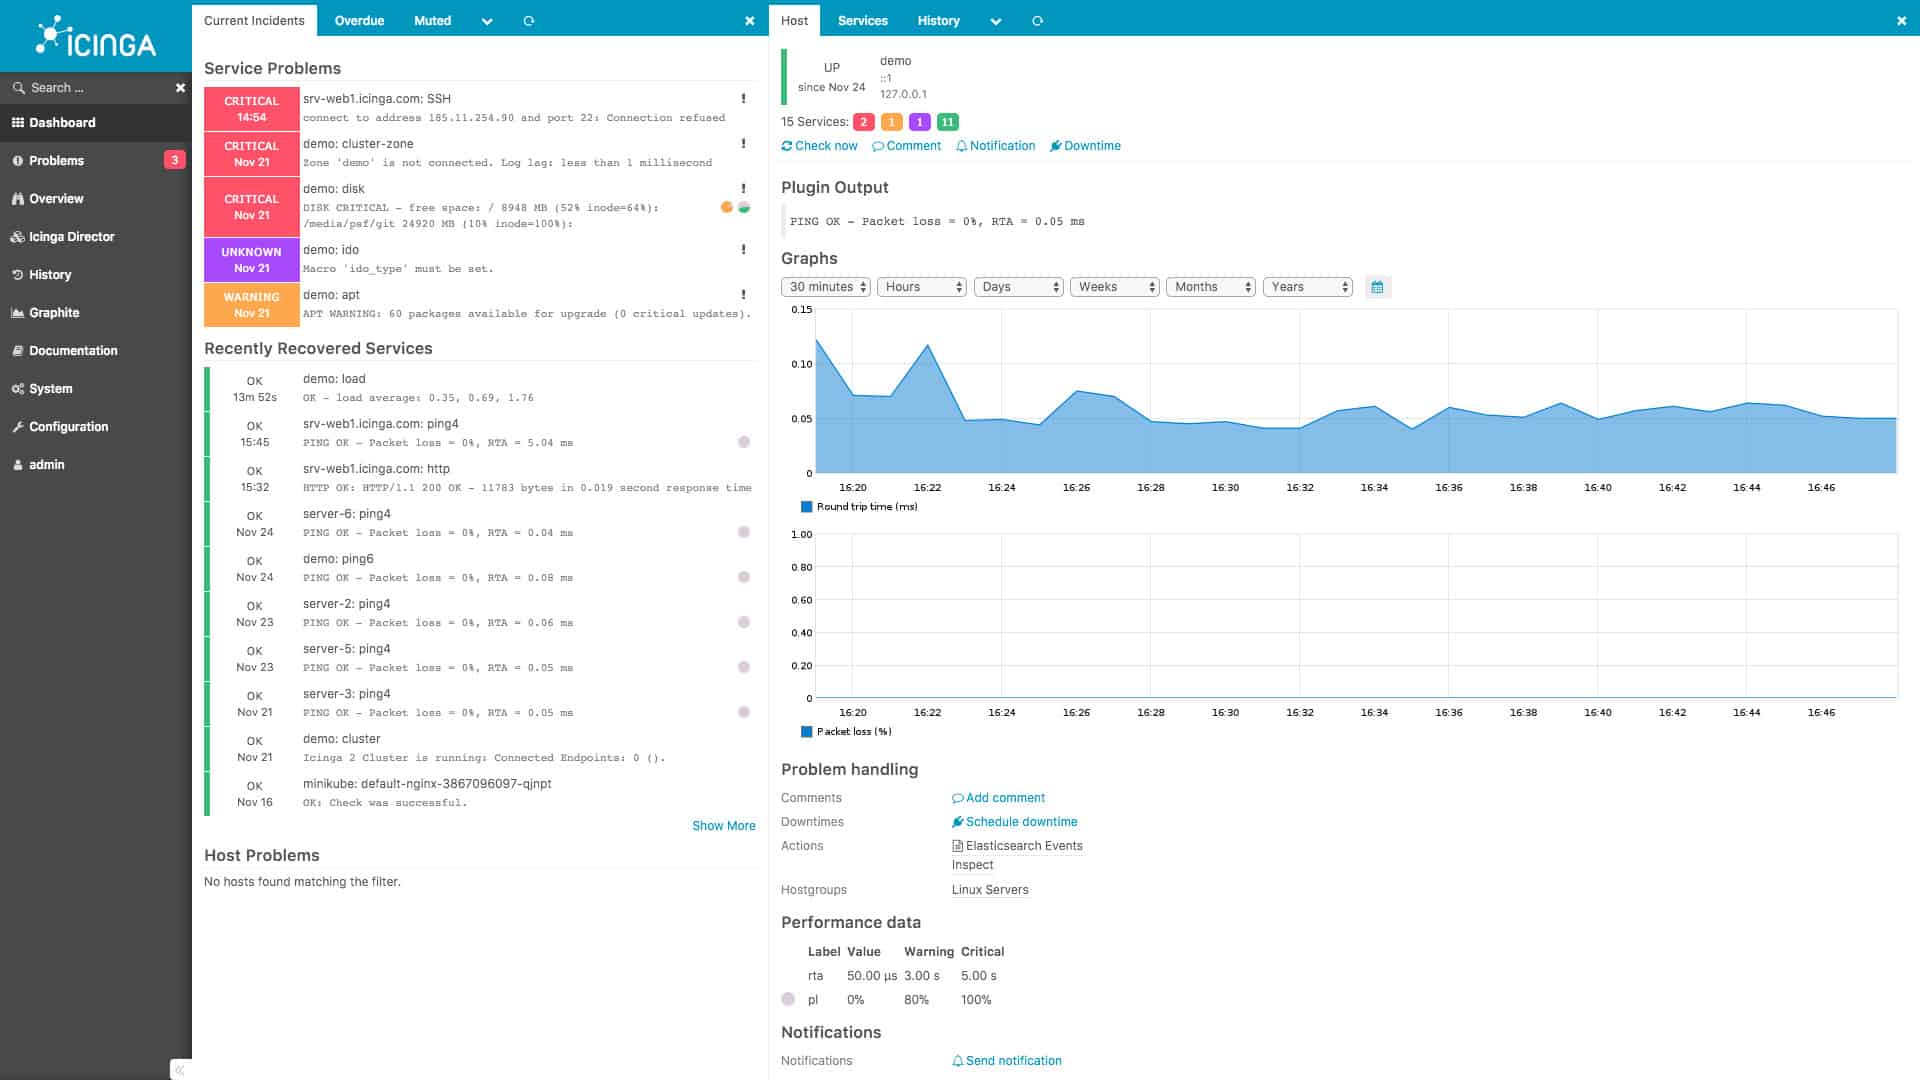
Icinga 2 was developed from a fork of Nagios Core. This enables Icinga users to benefit from the library of plugins available to Nagios. The service is a network, server, and application monitoring tool. The tool is able to communicate over the internet to include remote sites and cloud resources into the monitored system. All communications over the internet are protected by Transport Layer Security.
Key Features:
- Free to Use: An open source fork of Nagios
- Runs on Linux: Also available for Windows
- Network Discovery: Provides a constantly updated network inventory and map
Why do we recommend it?
Icinga 2 is a free open-source network monitoring tool that was modeled on Nagios. However, it has a much better interface than Nagios Core and it keeps the $0 price tag of that rival free system. Better still, this package includes bandwidth analysis, which you don’t get with Nagios.
The software for Icinga installs on Debian, Ubuntu, Raspbian, RHEL, CentOS, open SUSE, and SLES. It is free to use, as it is an open-source project.
The network monitoring system of Icinga is based on SNMP, which includes the trap mechanism of alerting. Alerts appear in the dashboard and can also be sent to users as emails and SMS messages. The dashboard of Icinga is a very attractive web interface, which users access through a browser. The interface system has to be hosted by the using company – it isn’t a cloud service.
Who is it recommended for?
This package has drawn a lot of potential customers away from Nagios XI because it is easy to use but it is free of charge. Small businesses will love the fact that the system includes time-saving automation. Larger enterprises will probably add on the paid support plan.
Pros:
- Device Monitoring: Uses SNMP processes
- Can be Configured via GUI or its Own Scripting Language: A good choice for admins who enjoy CLI tools
- Accepts Nagios Plug-Ins: These are available at Nagios Exchange and are free to use
Cons:
- No Network Traffic Flow Monitoring: Just like Nagios
Linux Network Monitoring FAQs
How do I monitor network traffic in Linux?
The easiest way to monitor network traffic from the command line in Linux is to use the netstat utility. Unfortunately, this system doesn’t automatically relaunch itself, so you should either write your own batch job to exploit this tool or buy a pre-written Linux-based network monitoring tool.
Is a command-line tool used for monitoring networks?
There are a number of network management tools built into the Linux operating system. However, all of them give you statistics on demand and not on an ongoing basis. You can’t sit and relaunch command line utilities all day, so monitoring the network in this way is impractical.
Is Wireshark a network monitoring tool?
Wireshark is in a category of network monitor that is called a traffic analyzer. This is one of the types of monitoring systems that you will need for your network. However, this is more appropriate for creating throughput analysis queries rather than system availability monitoring.
Related:

