
With widespread NGINX adoption, there has been an increasing number of NGINX monitoring tools, which enable the user to monitor the performance of NGINX. In this article, we’re going to look at the best NGINX monitoring tools on the market.
NGINX is a popular web server and reverse proxy server used by many enterprises to maximize website performance.
Here is a list of the best NGINX monitoring tools:
- ManageEngine Applications Manager (FREE TRIAL) Application monitoring software with NGINX and NGINX Plus monitoring with graphs, charts, alerts, reports, and more. Download a 30-day free trial.
- Site24x7 (FREE TRIAL) Unified monitoring software that supports NGINX and NGINX Plus with custom dashboards, alerts, reports, and more. Start a 30-day free trial.
- Datadog APM Cloud monitoring software with monitoring for over 180 NGINX metrics, dashboards, graphs, charts, anomaly detection, and more.
- Sematext NGINX Monitoring This monitoring service for NGINX and NGINX Plus is part of an infrastructure monitoring package that also watches over networks, servers, applications, and other virtualization systems. Offered as a SaaS package or for hosting over Docker.
- SolarWinds Server & Application Monitor Our top pick for NGINX monitoring. Server and application monitor with customizable dashboards, graphs, charts, alerts, and more.
- AppOptics APM Application performance management software with real-time NGINX monitoring, graphs, charts, alerts, and more.
- Dynatrace Application performance monitoring software with auto-discovery for NGINX web servers, a dependency map, anomaly detection, and more.
- NGINX Amplify NGINX monitoring software for NGINX Open Source and NGINX Plus with custom dashboards, recommendations, alerts, and more.
- AppDynamics Application performance management platform with NGINX and NGINX Plus monitoring with a customizable dashboard, anomaly detection, alerts, and more.
- New Relic Application monitoring software with NGINX integration, dashboard, alerts, reports, graphs, charts, and more.
The Best NGINX Monitoring Tools
We’ve included a range of tools for Windows, macOS, and Linux. As part of our overview, we’ve highlighted solutions with NGINX integrations alongside monitoring essentials like customizable alerts, visualization options (such as graphs and charts) and dashboards.
Our methodology for selecting NGINX monitoring tools
We reviewed the market for NGINX monitoring software and analyzed the options based on the following criteria:
- Options for Windows, macOS, and Linux
- Systems that can monitor NGINX Plus as well as NGINX Open Source
- Live performance data interpreted into graphs and charts
- The option for historical performance analysis based on stored statistics
- An alerting mechanism to warn of growing capacity issues
- A free trial period for a no-cost assessment or a money-back guarantee
- Value for money
1. ManageEngine Applications Manager (FREE TRIAL)

ManageEngine Applications Manager is an application monitoring tool with NGINX and NGINX Plus monitoring. With ManageEngine Applications Manager, you can monitor NGINX server availability, response time, requests served active connections, requests in waiting state, and more.
Key Features:
- Discovers and documents all applications: Identifies application and service dependencies
- NGINX uptime monitoring: Provides scripts to get the server running if it’s down
- Activity monitoring: Tracks NGINX response times and demand on the server
Why do we recommend it?
ManageEngine Applications Manager is a major rival to the SolarWinds Server & Application Monitor. This tool monitors all your software, services, middleware, and servers. It has a special integration for NGINX monitoring, which provides enhanced insights. The tool will discover all of your applications and create a dependency map.
Monitor NGINX performance through the dashboard with the assistance of visualization options like graphs and charts. An alerts system allows you to configure rules to decide when notifications are generated. For example, if a performance metric exceeds a particular threshold then the software will send you an alert by email or SMS.
Create reports to monitor performance trends. For example, for NGINX Plus you can create trend analysis reports that you can use to view historic performance data alongside heat charts. The platform also uses machine learning to create forecasts for NGINX Plus Server to estimate utilization trends.

Who is it recommended for?
There is a degree of overlap between this package and OpManager, which monitors networks and servers. However, these two packages are able to slot together, so if you buy both, you will be able to get full stack visibility for root cause analysis when problems arise. A Free edition will monitor five hosts.
Pros:
- Alerts: Notifies for NGINX performance impairment
- On-premises software: Runs on Windows Server and Linux
- A cloud service: Available on AWS Marketplace and Azure Marketplace
Cons:
- Limited free edition: Only monitors five assets
ManageEngine Applications Manager provides a solid mixture of NGINX monitoring alongside wider application monitoring functionality. It is available for Windows and Linux. Prices start at $945 (£731) for 25 monitors with one user. You can start the 30-day free trial.
2. Site24x7 (FREE TRIAL)

Site24x7 is a unified monitoring tool that can monitor NGINX and NGINX Plus. With Site24x7 you can monitor many NGINX metrics out of the box including waiting, reading, connections opened, requests per second, and connections dropped. For NGINX Plus you can monitor accepted connections, active connections, handshakes, failed handshakes, 1xx/2xx/3xx/4xx/5xx responses, reused sessions, dropped connections, idle connections, and more.
Key Features:
- Server monitoring: Track running processes and resource availability
- Application tracking: Identify, document, and monitor all applications
- Plug-in for NGINX monitoring: Extracts metrics directly from the NGINX server software
Why do we recommend it?
Site24x7 is a cloud platform and it can monitor NGINX, physical and virtual servers, and also cloud platforms. The tool can track all of your applications as they run and draw up a dependency map. You will be able to set up alert thresholds that will warn you when resources are running short.
Create custom dashboards to shape your monitoring environment to your needs, and set trigger conditions for alerts to determine when you’re notified about performance concerns. Alerts come in the form of SMS messages, emails, voice calls, and push notifications (Android and iOS apps). The mobile app gives you the ability to monitor performance on the move.

Customizable reports allow you to periodically check in on the status of your infrastructure and examine key performance trends. Reports can be scheduled and exported in CSV, PDF, or email format to share with the rest of your team.
Who is it recommended for?
Site24x7 offers its system monitoring modules in packages. So you get monitoring for networks, servers, middleware, platforms, and software all together. With a full stack view of your entire system, you will be able to see how NGINX fits into that environment. The tool provides immediate root cause analysis when problems arise.
Pros:
- Cloud-based system: A SaaS platform
- Correlates server resource usages with NGINX activity: Show the influence of resource availability on NGINX performance
- Alerts for performance problems: Get notifications for slow responses or overloaded interfaces
Cons:
- Only the first extension is free: The platform has a large library of integrations but you have to pay for all but the first
Site24x7 is suitable for enterprises that want to monitor a range of infrastructure alongside NGINX performance. Prices start at $9 (£6.96) per month for the Starter version. It is available on Windows and Linux. You can start the 30-day free trial.
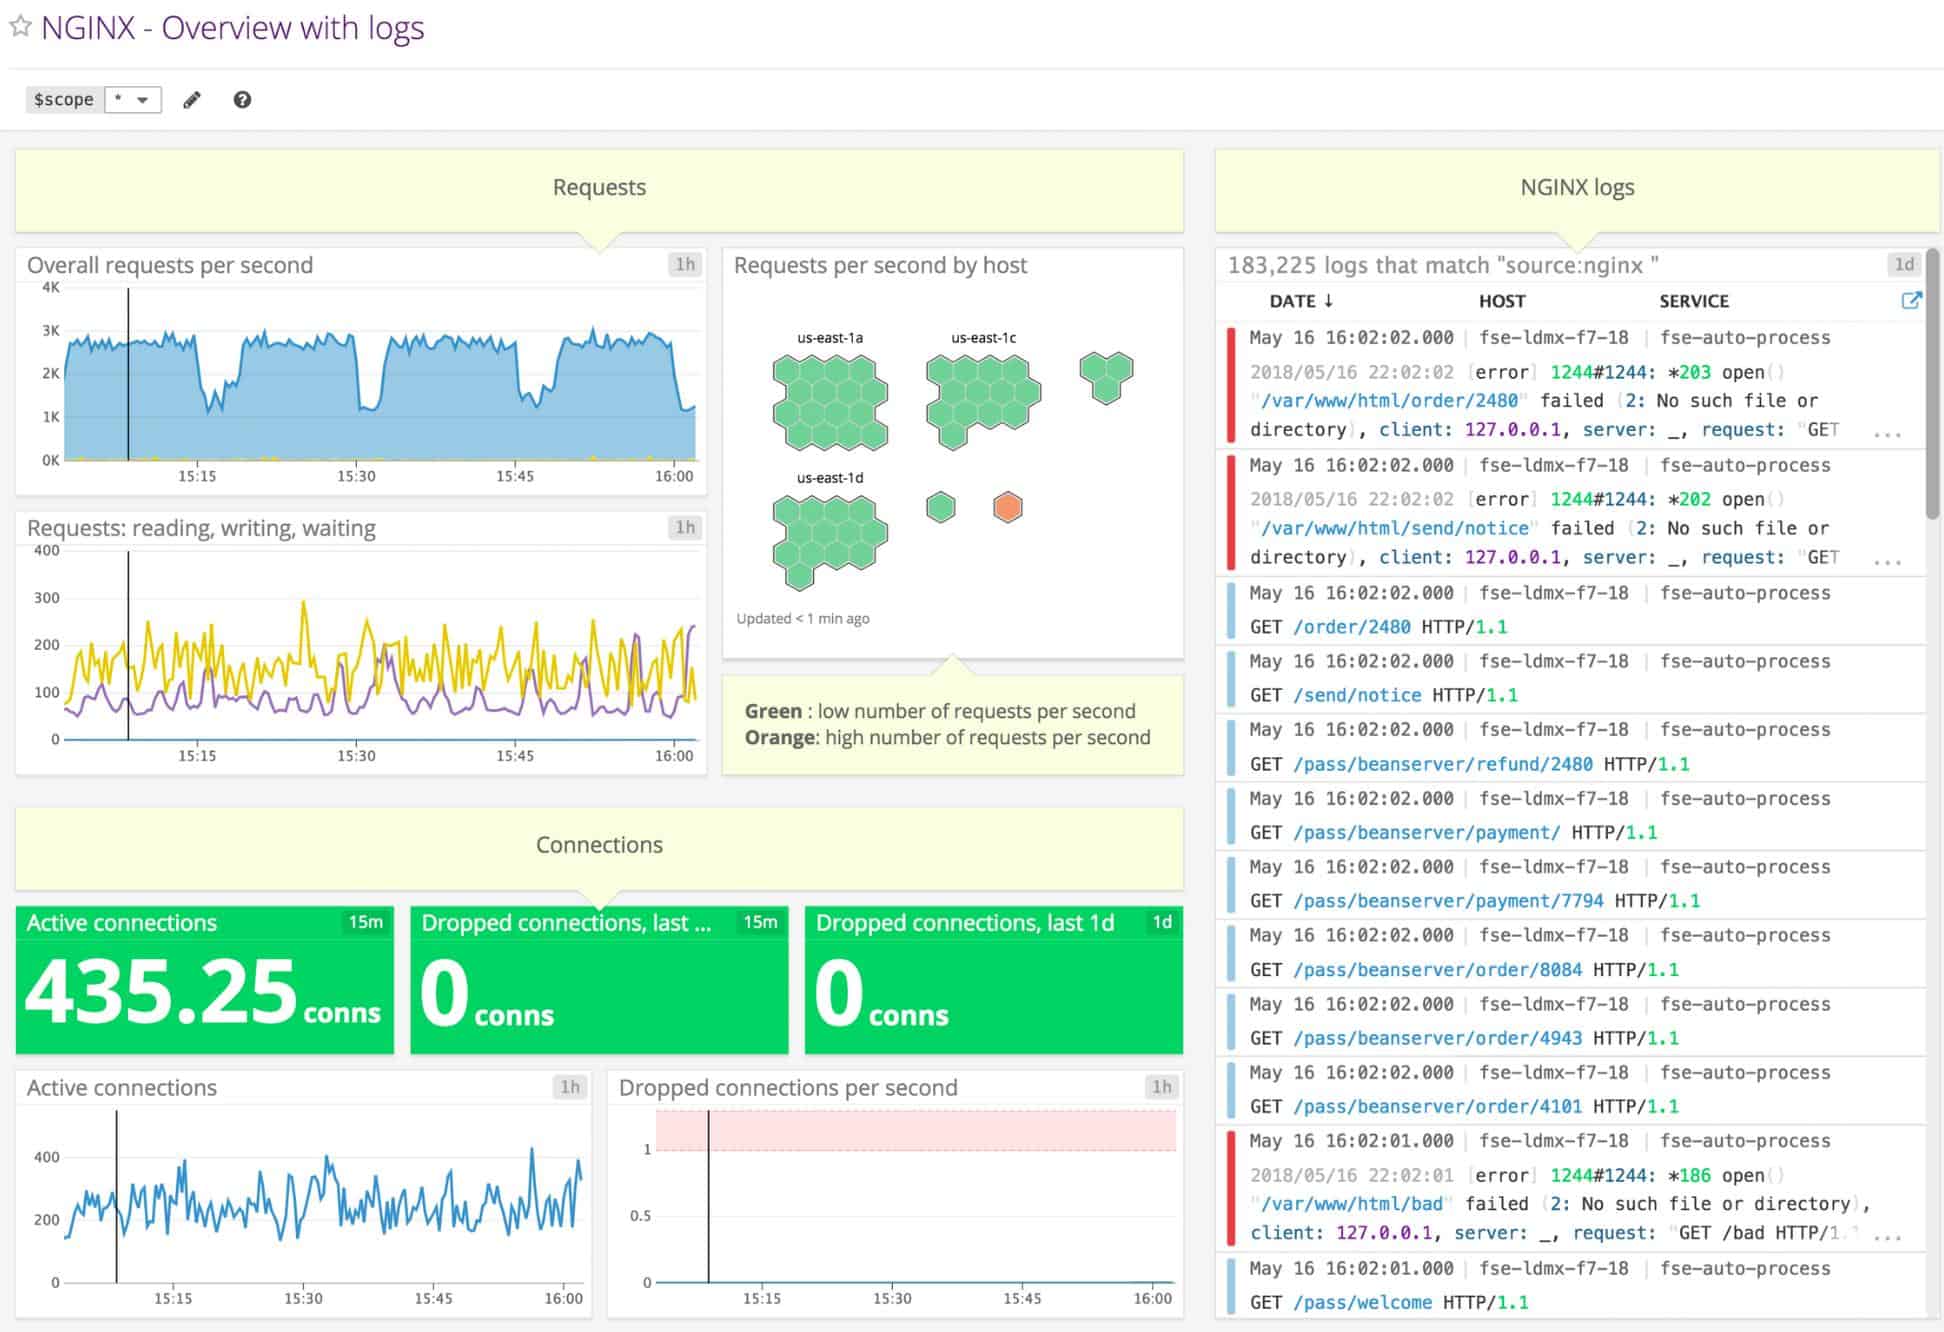
3. Datadog APM
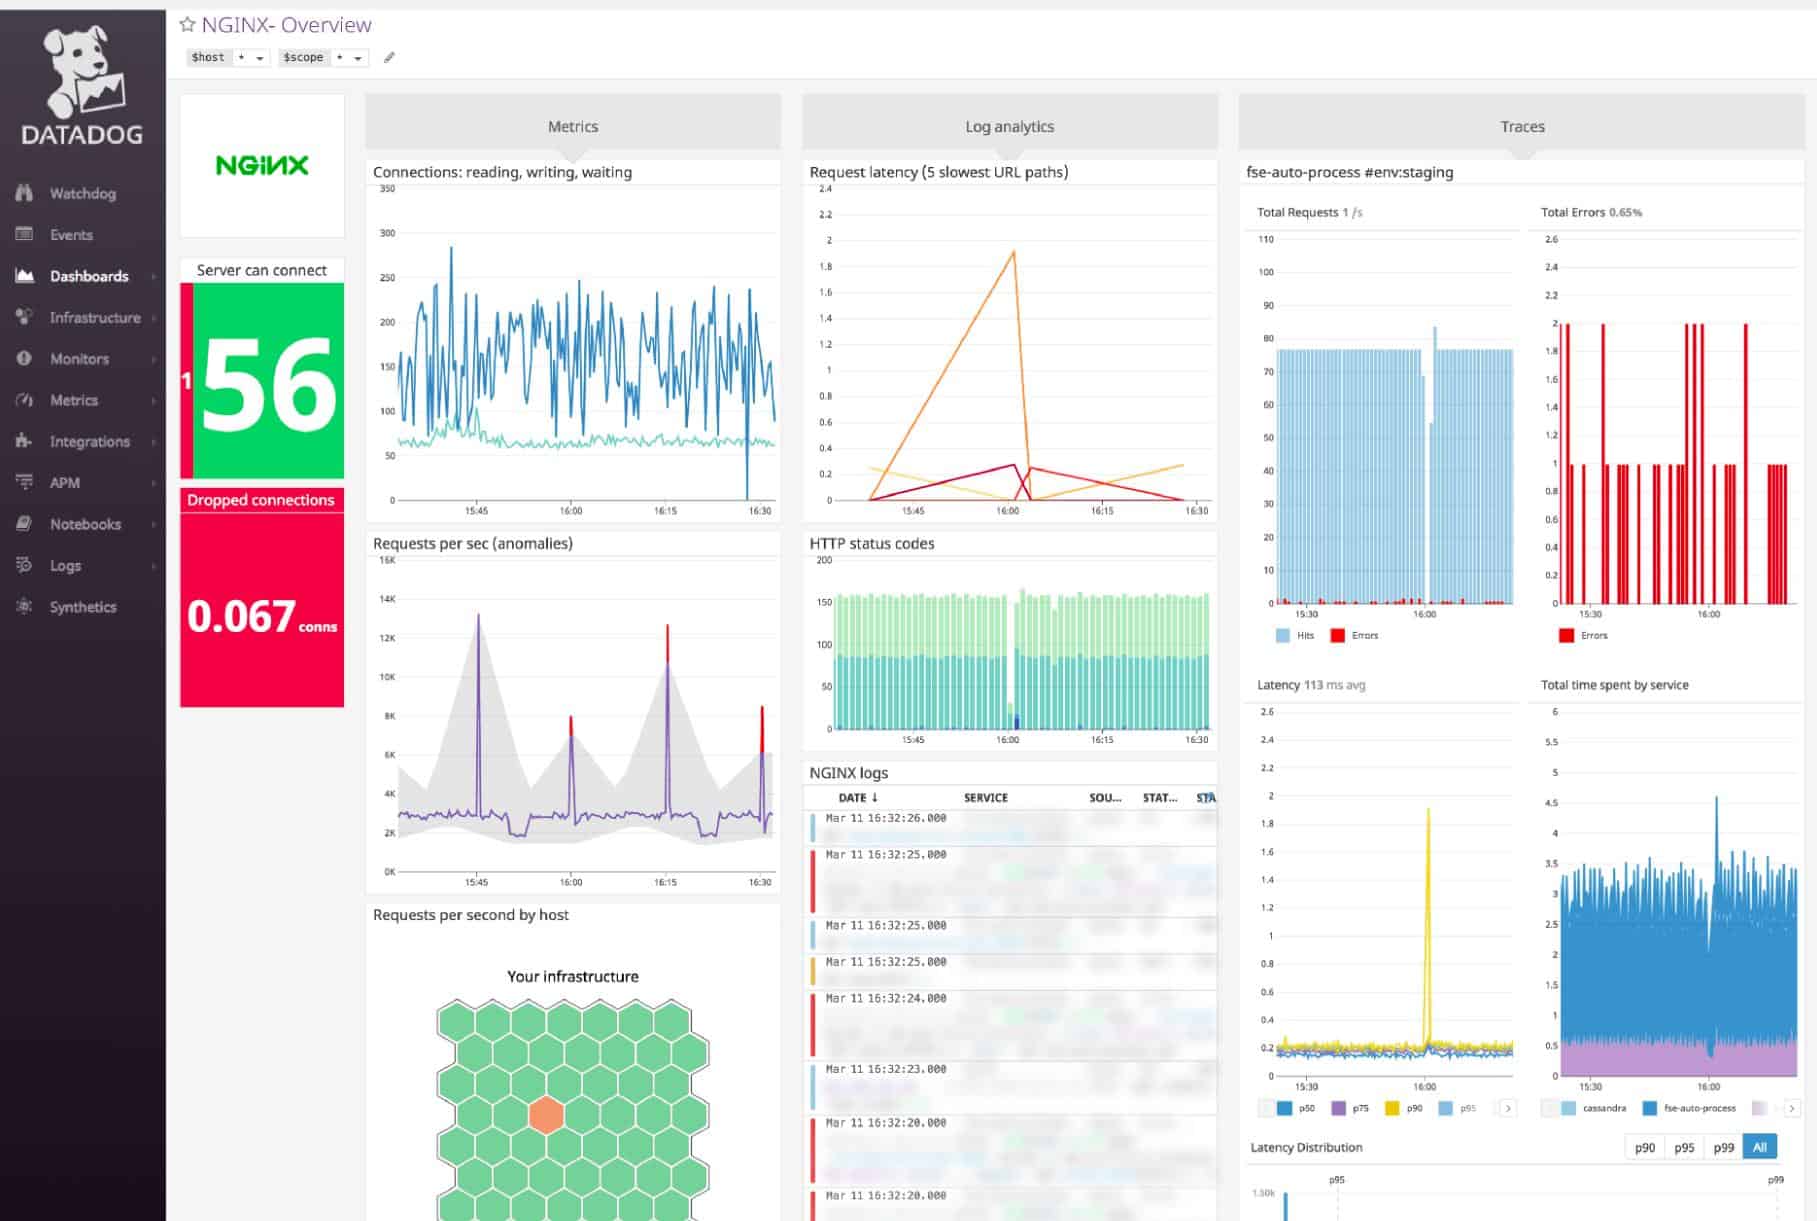
Datadog is a cloud monitoring tool with real-time NGINX monitoring. With Datadog you can monitor over 180 NGINX metrics such as latency, rejected connections, HTTP status codes, connect counts, response times, and more. Through the dashboard, you can view a top-down perspective of NGINX metrics alongside graphs and charts.
Key Features:
- Records NGINX responses: Includes latency, rejected connections, and HTTP status codes
- Looks at general Web request activity: Records connect counts and slow response times
- More than 180 NGINX metrics: The user can choose which statistics to display
Why do we recommend it?
The Datadog APM discovers all software as it runs and traces through to identify all contributing modules. It also watches how applications work together and thus, it creates an application dependency map. Alternatively, the Datadog Infrastructure package is another option for NGINX monitoring, which is activated through an integration.
There is also a real-time service map you can use to view live performance data and discover performance issues. The service map is useful for diagnosing the root cause of problems like latency and identifying bottlenecks faster.
An anomaly detection feature automatically identifies anomalous behavior and alerts you. For example, if the number of Total Errors spikes, the platform will recognize it and notify you. You can also create custom alerts with Boolean logic so you have complete control over the performance metrics most relevant to your environment.
Who is it recommended for?
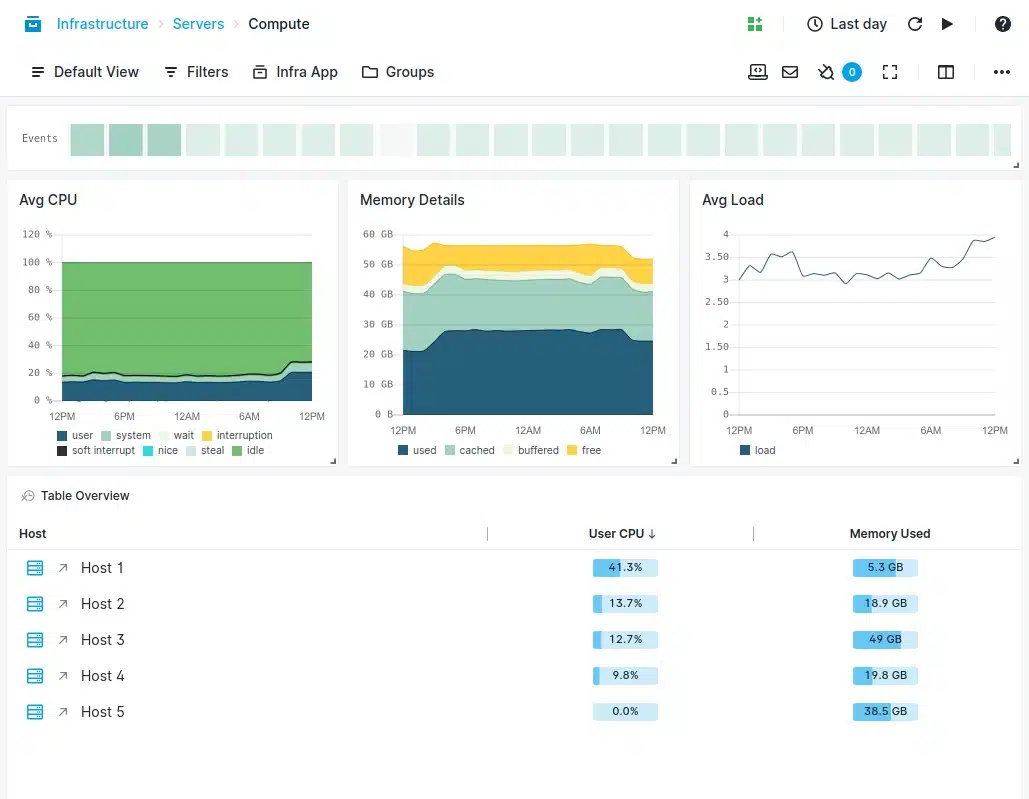
The Datadog cloud platform reaches out to your servers through the installation of agents. So, this tool will unify the monitoring of applications on many sites and platforms – including cloud servers. This is a good tool for watching over the services and applications that your NGINX server delivers to clients.
Pros:
- A cloud-based service: This is a SaaS platform
- Part of the Infrastructure Monitoring module: Provides integrations to specific technologies, such as NGINX
- Server resource monitoring: Correlates NGINX requirements with resource availability
Cons:
- Works best alongside other modules: Build up a complete view of NGINX by subscribing to multiple modules, which racks up the bill
Datadog is a reliable tool for enterprises that require NGINX monitoring alongside cloud monitoring capabilities. The Infrastructure version starts at $15 (£11.62) per host per month. Available on Windows, macOS, and Linux. Start a 14-day free trial.
4. Sematext NGINX Monitoring
Sematext Infrastructure Monitoring is able to watch over all resources and that includes virtualizations. The package can be extended by the addition of integrations and there is one available for NGINX and NGINX Plus. This plug-in adds on interfaces to NGINX reporting functions and also provides extra screens in the Sematext dashboard.
Key Features:
- Infrastructure discovery: Covers on-premises and cloud systems
- Integration for NGINX: Extracts statistics directly from the NGINX package
- Collects and analyzes NGINX logs: Log analysis is a separate module but included with the NGINX integration
Why do we recommend it?
Sematext NGINX Monitoring is delivered as part of a SaaS package that provides full stack monitoring. The NGINX monitor is added on as a free integration. It will form part of the automated monitoring service that looks at server resources and the demands placed on your NGINX system together.

Activating the NGINX integration doesn’t wipe out the functions of the base Infrastructure Monitoring package, so you will still be able to see network, server, and application performance data live alongside the NGINX monitors. You will be able to see the resource usage of your NGINX implementation as well as its response times and forecast system requirements.
It isn’t necessary to sit and watch the NGINX monitoring screen because the Sematext system includes alerts for performance problems. These can be sent to you by email, Slack, or Webhooks, so you will know when your attention is needed. All NGINX activities are also logged and performance metrics are retained on the Sematext cloud server for later analysis.
Who is it recommended for?
Businesses that want a SaaS package for NGINX monitoring have quite a few options on this list, so the Sematext package should be trialed in comparison with the Site24x7 and Datadog services. There is a free tier of this package for small businesses that is limited to monitoring five hosts.
Pros:
- Cloud-based system: A SaaS package
- Cloud storage: Space to hold log files and statistics
- Free plan: To monitor five hosts
Cons:
- Limited storage with the free plan: Data retention for only 30 minutes
To get the NGINX monitor, you should subscribe to the Sematext Infrastructure Monitoring service and then add on the module. Both the Infrastructure system and the NGINX add-on are free for use on five hosts as long as you select a short data retention period. This software is offered as a SaaS package but you can also run it on your own server as a virtual appliance over Docker. Sematext offers the Infrastructure Monitoring package and the NGINX integration for a 14-day free trial.
5. SolarWinds Server & Application Monitor

SolarWinds Server & Application Monitor is a server and application monitoring tool that you can use to monitor NGINX. SolarWinds Server & Application Monitor provides out-of-the-box monitoring for the performance and availability monitoring for NGINX servers. Monitor metrics such as CPU utilization, memory usage, requests per second, active vs dropped connections, server error rate, request processing time, and more.
Key Features:
- An integration with NGINX: Interfaces to NGINX to extract statistics
- Server performance metrics: CPU utilization, memory usage, and requests per second
- Service activity tracking: Active vs dropped connections, server error rate, and request processing time
- Supporting server resources: Identifies resource availability
- Dependency correlation: Links NGINX demands with server resource capacity
Why do we recommend it?
SolarWinds Server & Application Monitor is able to track many software packages, middleware systems, and servers. It includes the capability to monitor virtualizations, cloud systems, and Web servers, such as NGINX. This tool will link together an application dependency map and forecast potential performance problems due to conflict or resouce shortages.
Customizable dashboards allow you to track metrics of your choice with extensive visualization options like graphs and charts. You can also use the software to map infrastructure and application dependencies to help you identify the origin of performance issues more effectively. The map is color-coded so you can spot problems faster.

Alerts keep you updated on performance fluctuations. Alerts can be configured to send you an email or SMS message when a particular parameter exceeds a predefined threshold. You can also create custom reports to gather key metrics on NGINX performance.
Who is it recommended for?
This service is suitable for any business that runs an NGINX Web server. However, it is particularly designed to serve large businesses with many interdependent applications to watch over. Performance expectation thresholds raise alerts if server resources run short or if applications perform badly. This system increases the productivity of system administrators.
Pros:
- Demand analysis: Identifies the systems that rely on NGINX
- Requirements predictions: Watches services as they run and forecasts their upcoming resource requirements
Cons:
- Runs on Windows Server: Not available for any other OS or platform
SolarWinds Server & Application Monitor is only available on Windows (for local deployments). Prices start at $1,567 (£1,213). You can start the 30-day free trial.
6. AppOptics APM

AppOptics APM is an application performance management tool you can use to monitor NGINX. With AppOptics you can monitor NGINX performance in real-time with an integration. The integration enables you to view graphs and charts of metrics such as connections processed, requests per second, connections writing, and active connections.
Key Features:
- Application performance monitor: For a long list of applications, not just NGINX
- Multi-platform: Monitors on-premises systems, plus services on AWS and Azure
- Multiple data sources: Logs, user experience, server resource mapping, and direct observations from NGINX
- Distributed tracing: Records Web application activity and performance
Why do we recommend it?
AppOptics APM is similar to the SolarWinds Server & Application Monitor except that it is based in the cloud. The APM is the higher of the two plans offered by AppOtics and it includes the infrastructure monitoring services of the lower plan. This package provides distributed tracing for microservices and code profiling for Web applications.
The integration is easy to configure, and all you need to do is add a plugin and follow the instructions provided by the GUI. If you want to automate monitoring performance metrics you can use alerts. Alerts notify you when metrics meet certain conditions via email, Slack, or Webhook. For example, if the number of requests per second rises.

Who is it recommended for?
This system is particularly useful for businesses that run Web applications. The tool will simultaneously track many running applications and the servers that host them. Thanks to distributed tracing, you can also track applications that you don’t own, such as APIs and cloud platform services.
Pros:
- A cloud-baed system: This is a SaaS package
- Synthetic monitoring and real-user monitoring: Available as add-ons
- Monitors Infrastructure-as-Code: Kubernetes and container monitoring
- Server resource monitoring: Links NGINX resource needs to server capacity
Cons:
- No on-premises version: Runs on a cloud platform
AppOptics is an adept application performance management solution you can use to monitor NGINX and application performance. The Infrastructure & Application Monitor package costs $24.99 (£19.34) per host, per month. It is available on Windows and Linux. You can start the 30-day free trial.
7. Dynatrace
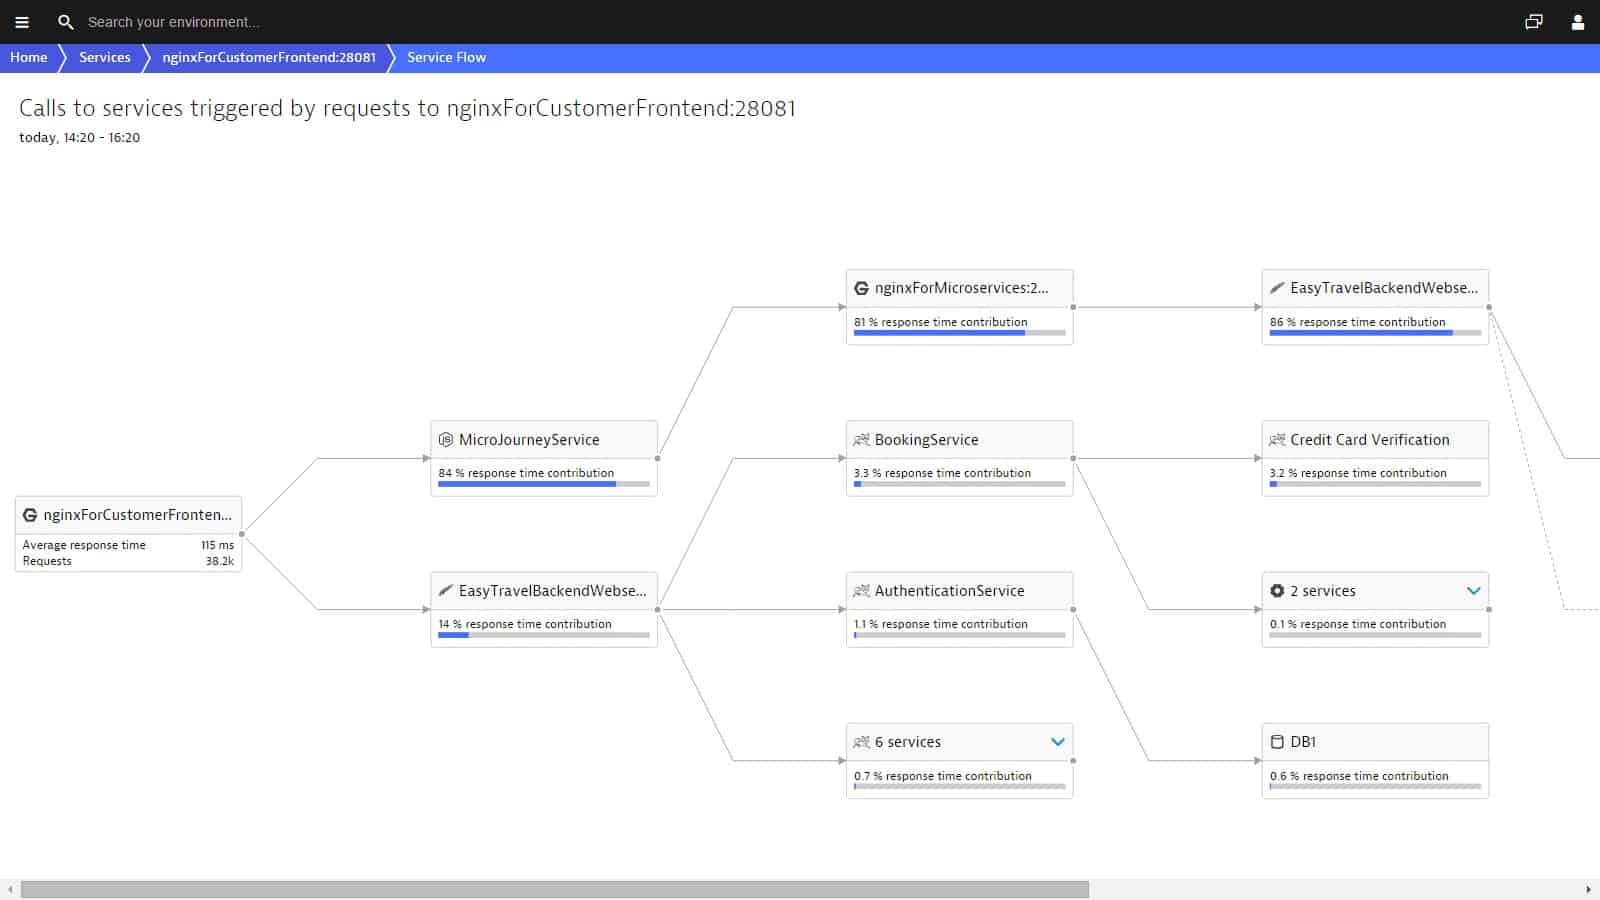
Dynatrace is an application performance monitoring tool with NGINX monitoring that can automatically detect web servers. With Dynatrace you can monitor NGINX metrics such as requests, response sizes, accepted vs dropped connections, CPU, memory, and active connections. There is also a dependency map, where you can monitor your entire application stack.
Key Features:
- Choice of plans for NGINX monitoring: Opt for Infrastructure Monitoring or Full Stack Monitoring
- AI inference: Predicts upcoming resource requirements from all running processes
- Special integration with NGINX: Extracts activity statistics directly from NGINX
Why do we recommend it?
Dynatrace is a sophisticated AI-based application monitor that will discover all of your applications and services and then map their dependencies. You will be able to see metrics on the internal operations of your NGINX server and correlate them to the resource availability of its host.
You can also monitor NGINX Plus and gather performance metrics and requests per server zone, traffic and requests, upstream health, cache performance, and cache usage. Visualization features like graphs and charts provide make it easier to distinguish performance trends at a glance.
Anomaly detection and artificial intelligence identifies anomalous behavior in your environment and notifies you. Alerts detail the root cause of the problem so that you can remediate the issue more efficiently.

Who is it recommended for?
Dynatrace is another cloud-based monitoring system that could be a candidate for your NGINX monitoring needs. This is a high-end tool that deals with the complexity of demand when many applications are running on the same host, so it will be more appropriate use by large businesses.
Pros:
- Software inventory: An interactive presentation of each software package, including NGINX
- Application details: Shows when a package is running and information about its version and program file footprint
- NGINX statistics: See response times, demand volumes, connection performance
Cons:
- Stronger at monitoring cloud services: The Infrastructure Monitoring package is focused on cloud monitoring
Dynatrace is recommended for enterprises that require NGINX monitoring with fast deployment. The Full-stack monitoring package starts at $69 (£53.47) per month per 8 GB host. It is only available on Linux. You can start the free trial.
8. NGINX Amplify
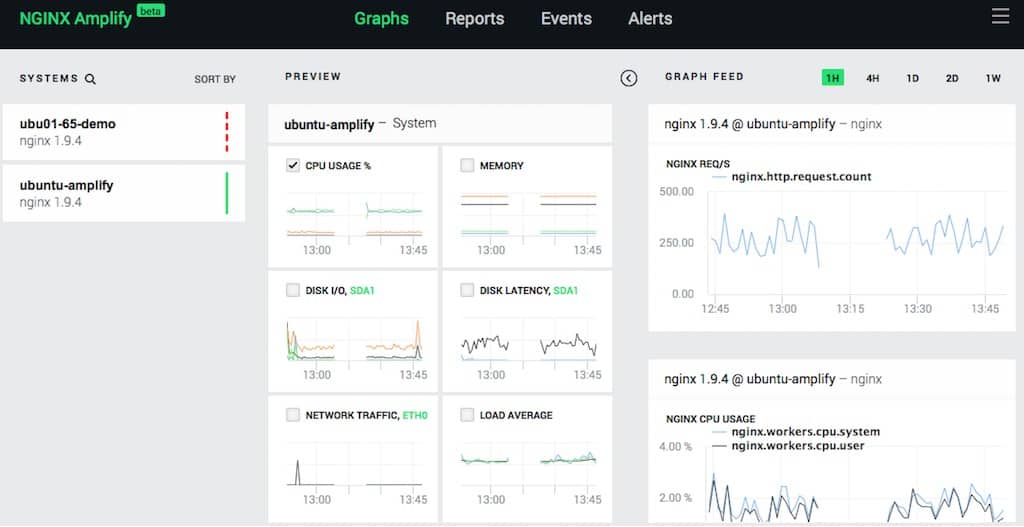
NGINX Amplify is an NGINX monitoring software for NGINX Open Source and NGINX Plus. With NGINX Amplify you can monitor the performance of instances viewing metrics like requests per second, active connections, CPU usage, and more through a customizable dashboard.
Key Features:
- Supplied by NGINX: Hosted on the cloud
- No change: Provided for free
- Live NGINX statistics: Shown as data tables and graphs
Why do we recommend it?
NGINX Amplify is a product of the company that produces the NGINX Web server – F5. This tool isn’t the native console for the Web server, it is an extra package. The system is a SaaS package and it isn’t free. The monitoring system will track activity in NGINX Open Source and NGINX Plus instances.

An alerts system produces notifications to tell you about performance problems which helps you to find ways to optimize performance. Users can configure alert thresholds and set rate limits to restrict the number of alerts created to filter out unnecessary alerts.
Static analysis provides you with recommendations on configurations so that you can optimize performance. For example, the software can recommend that you set worker processes to auto to improve performance. You can also run compliance checks to assess your website for vulnerabilities and use SSL/TLS certificate analysis to ensure your certification is up to date.
Who is it recommended for?
Businesses that want to get an integrated monitoring tool that is easier to use than the Web server’s console would be interested in this package. One problem with the system is that it isn’t able to monitor anything else. So, you can’t get any correlation to network or internet performance.
Pros:
- Monitors related technologies: Linux, PHP-FPM, and MySQL as well as NGINX
- Customizable dashboard: You decide which metrics appear and how they are represented
- Set capacity thresholds: Get alerts when performance drops or demand approaches total capacity
Cons:
- Focused on NGINX: Other than a few applications, this package won’t monitor the rest of your infrastructure
NGINX Amplify is suitable for enterprises that require a straightforward SaaS-based NGINX monitoring solution. Annual and hourly subscriptions are available. For pricing information, you need to contact the sales team to request a quote. You can start the 30-day free trial.
9. AppDynamics
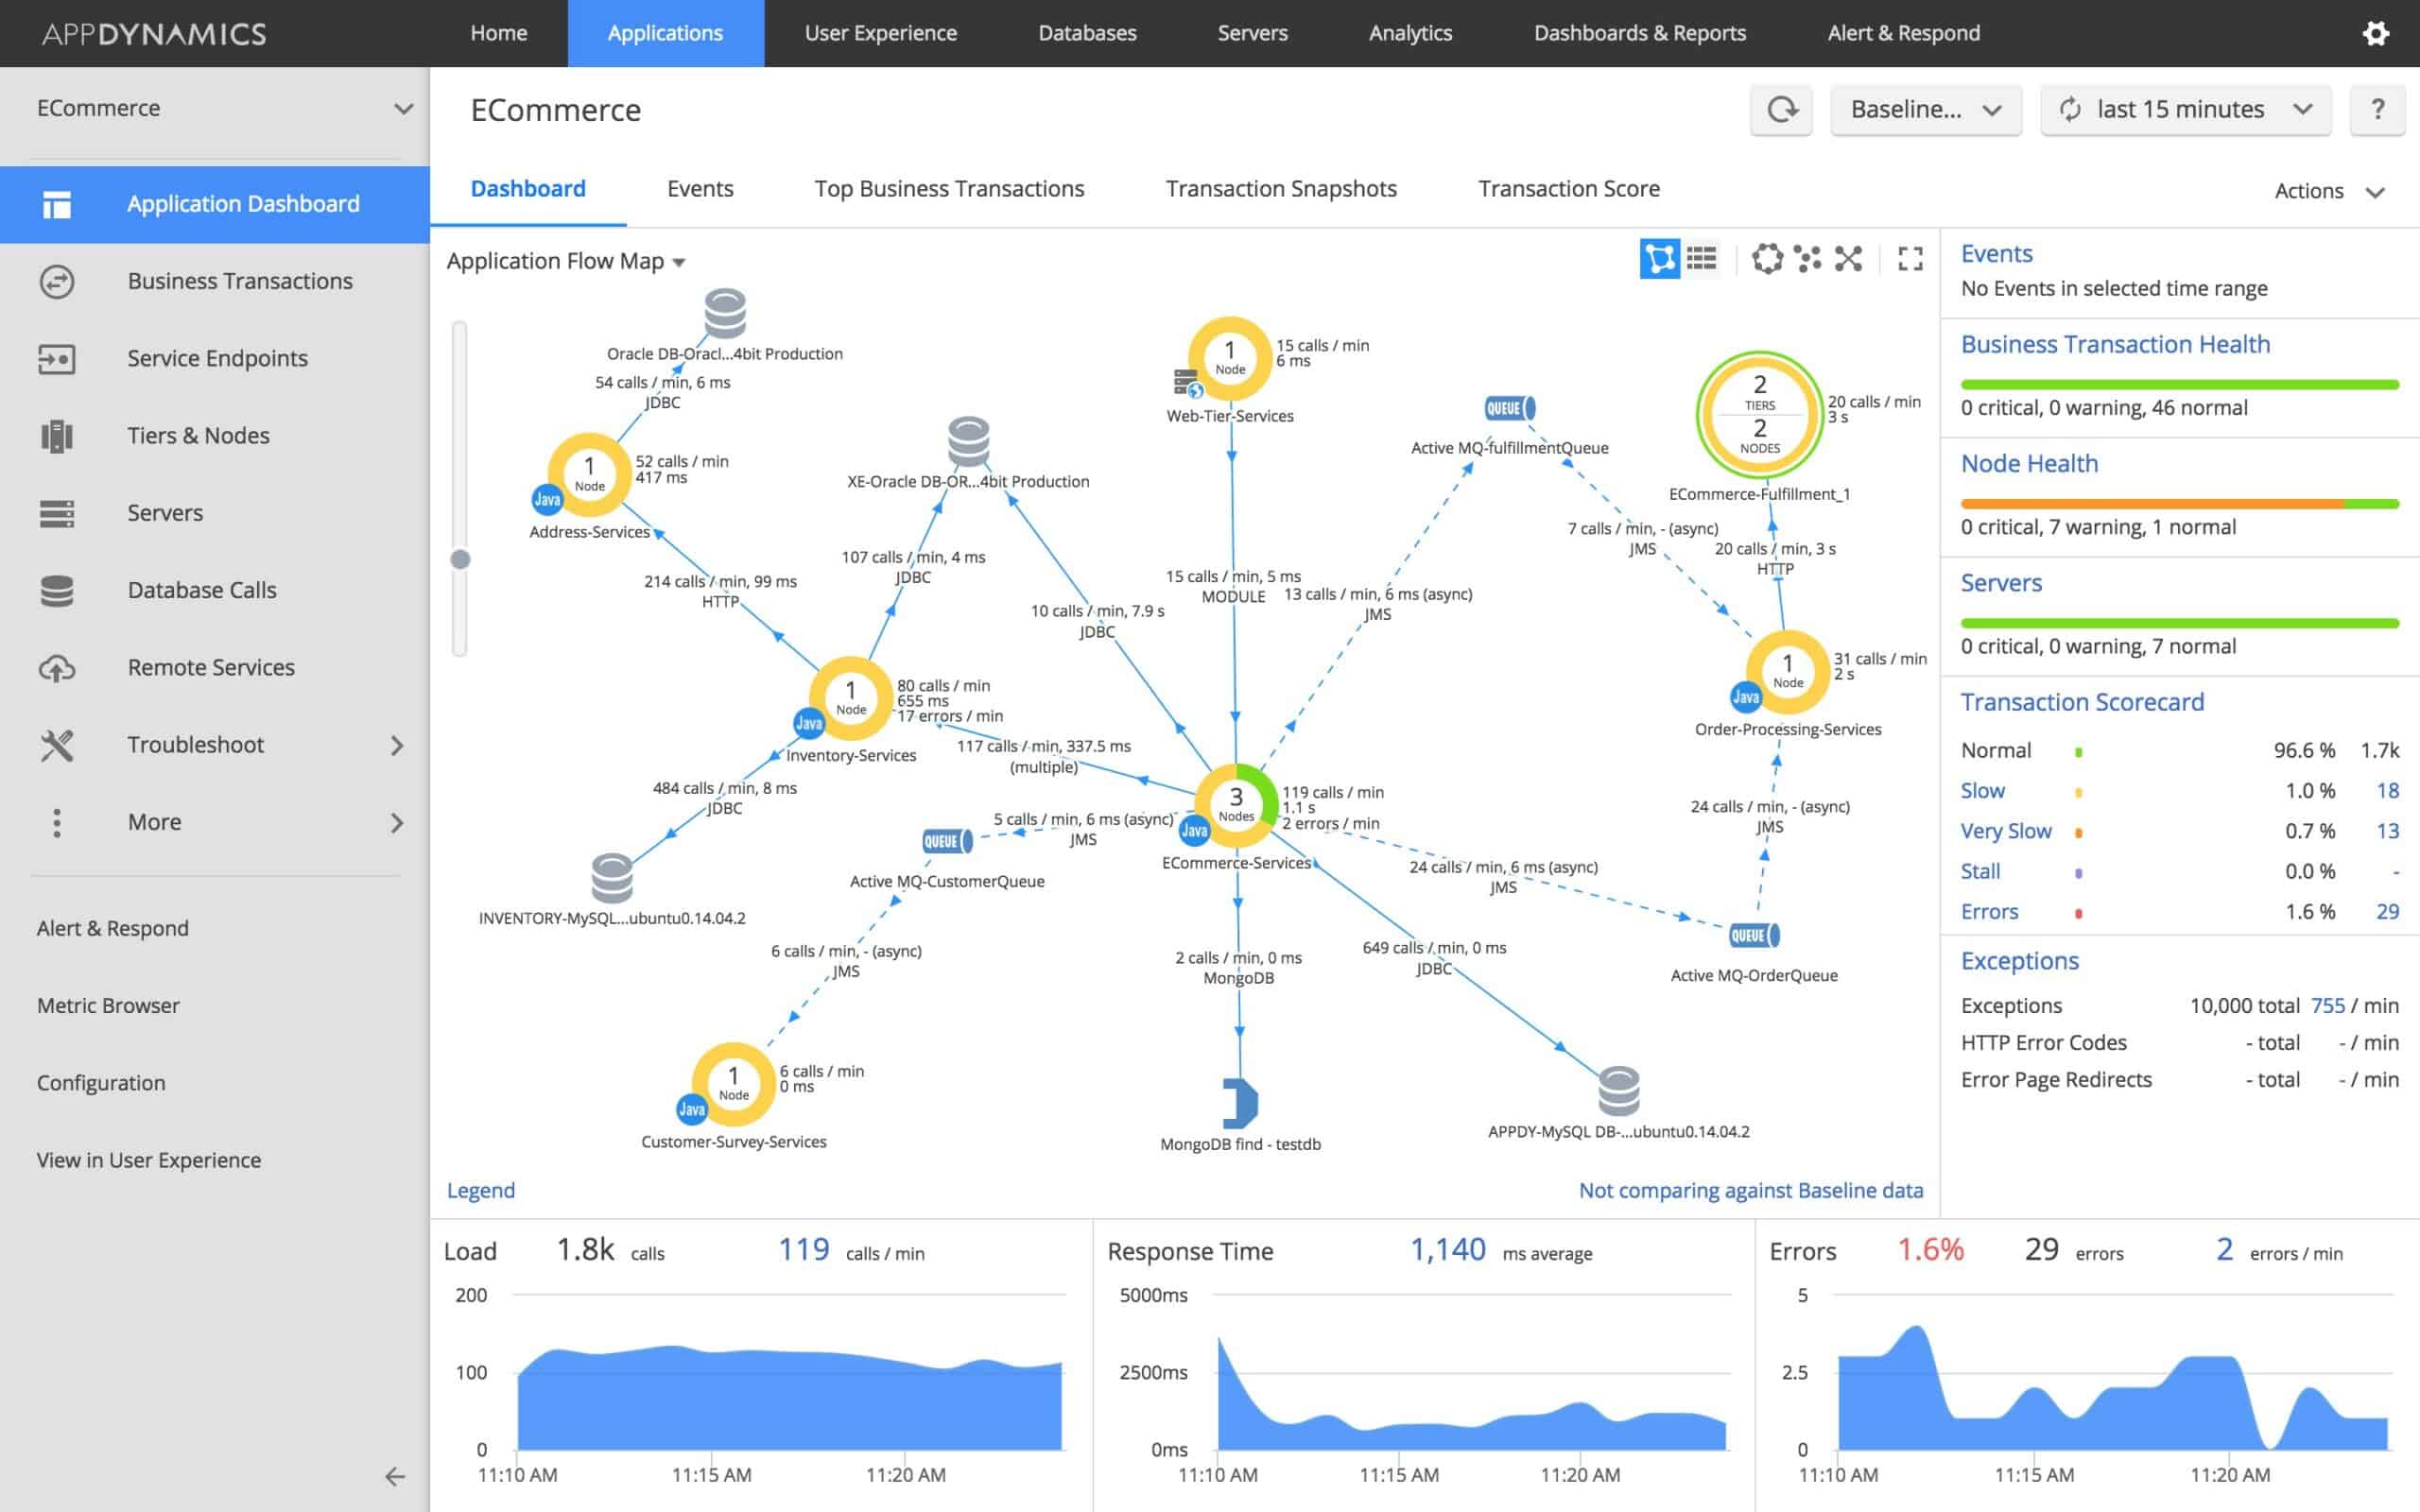
AppDynamics is an application performance management tool that comes with an NGINX and NGINX Plus monitoring extension. After installing the NGINX extension you can configure the platform to connect performance metrics of your choice. Metrics include active connections, the total number of requests, accepted and handled requests, reading, writing, and waiting metrics.
Key Features:
- Scans processes: Tracks data movements to identify application dependencies
- Infrastructure monitoring: NGINX is part of the infrastructure division of the platform
- Real user monitoring: A paid add-on for the Infrastructure Monitoring unit
Why do we recommend it?
AppDynamics is a similar system to Dynatrace. As the name suggests, this tool focuses on applications. The system offers a lower plan that just monitors infrastructure and that option is considerably cheaper than the application monitoring editions. The monitoring of NGINX Web servers is included in the Infrastructure Edition.
Through a custom dashboard, you can monitor your NGINX environment in real-time with rich visualization options ranging from graphs to an application map. It’s also worth noting that the platform supports a range of technologies including C++, .NET, Python, PHP, GO, and Node.js.
Machine learning enables the platform to identify baseline performance and identify anomalous activity. Whenever unusual performance activity emerges, the platform notifies the user. Users can also configure custom alerts with an Alert and Respond feature. They can configure trigger conditions for alerts and set automated responses such as generating an alert or performing remediation actions.
Who is it recommended for?
AppDynamics Infrastructure Edition provides a library of plug-ins and activating the NGINX add-on is free. This tool will also track server resource usage, virtual environments, cloud platforms, and networks. The low price of the Infrastructure Edition makes it accessible to businesses of all sizes. The application monitoring plans also include this module.
Pros:
- Cloud-based service: A SaaS package
- Live performance tracking: Shows NGINX activity in terms of throughput volumes and response times
- Predictive alerting: Warns if the monitor projects that there won’t be enough resources available for the NGINX server
Cons:
- No on-premises version: Only available on the cloud
AppDynamics is recommended for enterprises looking to monitor NGINX alongside other applications. For pricing information, you need to contact the company directly for a quote. It is available on Windows and Linux. You can start the 15-day free trial.
10. New Relic
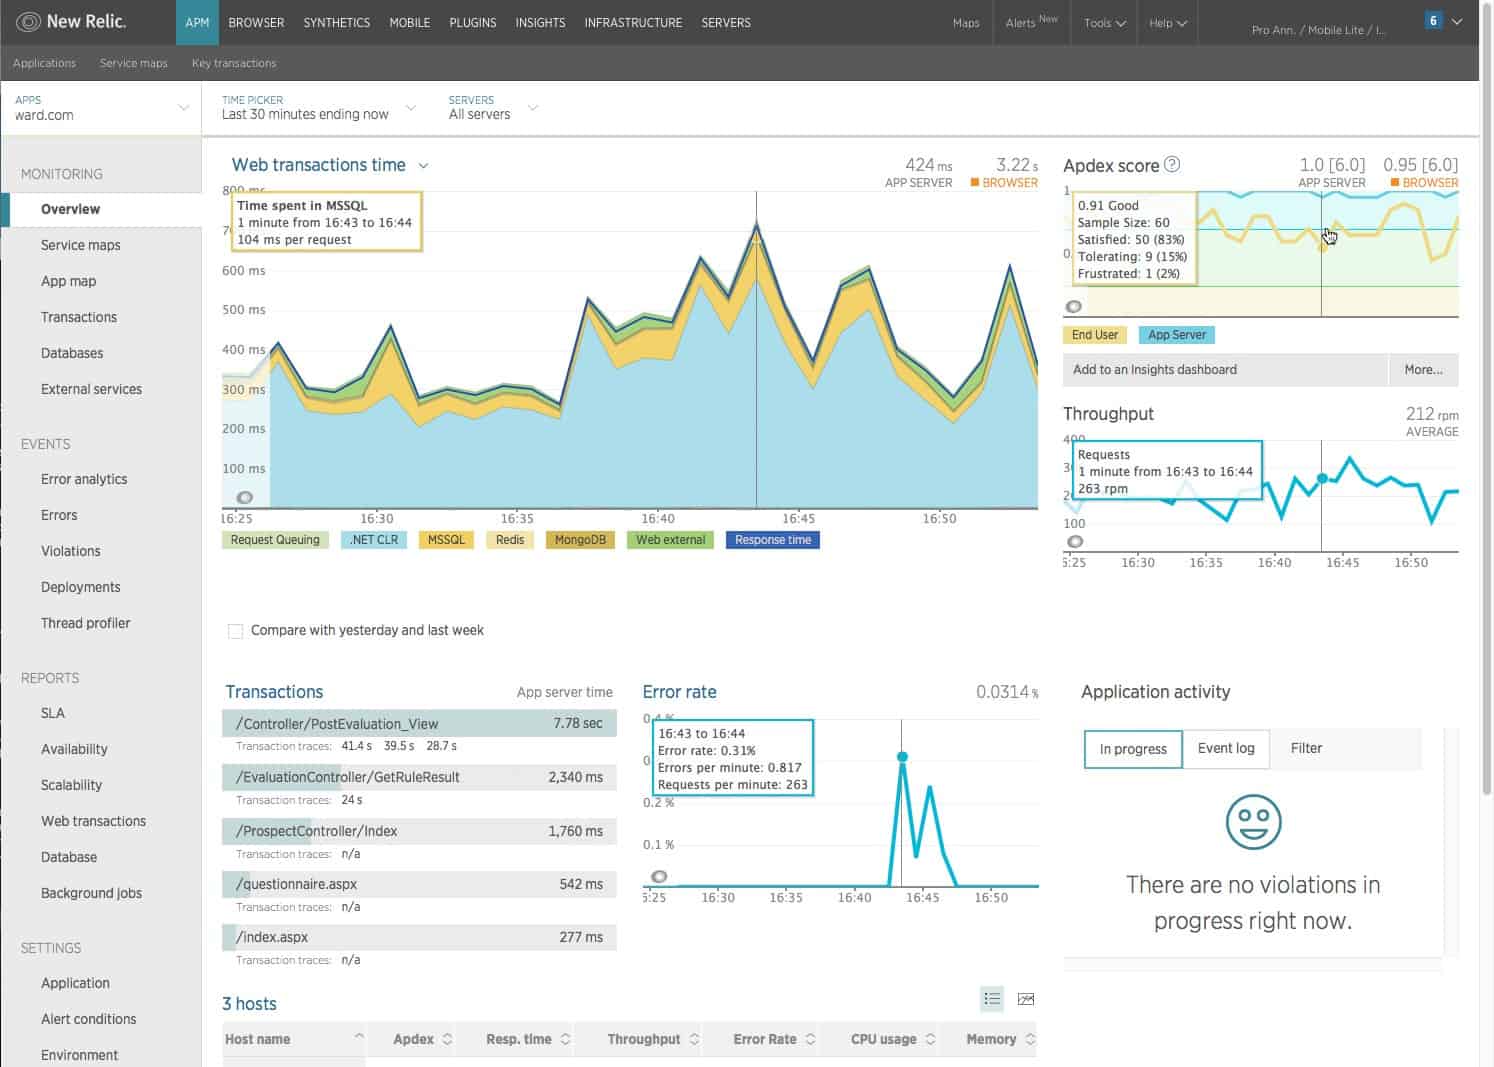
New Relic is an application monitoring solution with an NGINX integration. With New Relic’s NGINX integration, you can collect metrics such as connections active, connections accepted per second, connections dropped per second, connections reading, connections waiting, connections writing, and requests per second.
Key Features:
- All-in-one platform: Get the entire platform of modules
- Security and performance monitoring: For cloud and on-premises systems
- Spots request surges: Identifies DDoS attacks
Why do we recommend it?
NewRelic is a highly respected APM and the SaaS platform is constantly evolving. The service now gives access to all of its 16 modules in one subscription. This enables you to monitor your NGINX servers in conjunction with server and network performance and resource availability. The system will simultaneously track all of your other applications.
Users can monitor performance data through the dashboard with graphs and charts that display metrics such as requests per second or active connections over time. The user interface includes the option to filter data to specific hosts to make it easier to narrow down the activity you’re monitoring.

Alerts allow you to decide when you will receive notifications about performance issues. Custom alerts can be issued by email, Slack, PagerDuty, OpsGenie, VictorOps, Webhook, xMatters, and push notifications. You can also schedule weekly performance reports for users who opt-in, helping to track the most important events of the week.
Who is it recommended for?
This is a suitable monitoring platform for mid-sized and large enterprises. The platform has many modules, so it will require a team just to fully use all of the facilities that it offers. You will also be able to use browser and mobile device monitoring to check on the delivery of your Web applications.
Pros:
- Delivered from the cloud: A SaaS platform
- Full stack observability: Correlates performance with server resource usage and availability
- Alerts for performance problems: Notifies if response time drops
Cons:
- A unified platform: It isn’t possible to subscribe only to the NGINX monitoring service or just the Infrastructure Monitoring module.
New Relic is ideal for enterprises that want the flexibility of an open-source NGINX integration. The Standard version costs $99 (£76.60) per additional user per month. You can sign up for the free trial.
Choosing an NGINX Monitoring Tool
Solutions like ManageEngine, and Dynatrace give you visibility over NGINX performance and equip you with high-quality visualization options and alerts you can use to make sure you don’t miss anything important.
NGINX Monitoring FAQs:
How do I monitor NGINX?
In order to monitor NGINX, you need to decide on a list of important performance indicators and gather those from live operations. It is difficult to know exactly what to look for, which is why it is a great help to get an NGINX monitoring tool that already has a list of the important factors to track.
What is NGINX dashboard?
The NGINX dashboard offers live activity monitoring and also gives access to the settings and configuration options for the NGINX system. The activity monitor is set out with a main page offering summaries of performance metrics and then detail screens for each factor.
How do I check my NGINX stats?
Checking the NGINX stats is easier with NGINX Plus than with the free community edition. The NGINX Plus system includes a dashboard with an activity monitor. This monitor will give you a live report on all stats.
How do I access NGINX dashboard?
You access the NGINX Plus dashboard through any standard Web browser. The full address depends on the configuration you defined for the system. If you left the port usage configuration as the default, you need to enter http://nginx-plus-server-address:8080/ in the address bar. If you specified a port number, use that instead of 8080.

