

Network performance and load testing tools have grown ever more sophisticated over the last decade. Back in the day, network performance testing tools were little more than tools that generated dummy network traffic with ICMP to test an interface’s or node’s ability to handle heavy traffic, also known as internet stress testing.
Here is our list of the best network performance and load testing tools:
- ManageEngine OpManager EDITOR’S CHOICE Shows the way in performance monitoring and load testing with detailed insights into network health and capacity. Its user-friendly interface and automated alerts make it an excellent choice for proactive network management. Additionally, its customizable dashboards provide personalized views of critical performance data. Download a 30-day free trial.
- Site24x7 Network Monitoring (FREE TRIAL) Network and internet connection performance tracking as part of a cloud-based service that includes IT infrastructure, applications, and website monitoring. Start a 30-day free trial.
- Tricentis NeoLoad (FREE TRIAL) This system performance package is aimed at testing Web assets but it can also test a network by giving it a target that is on your LAN. Available as a SaaS and also for installation on Windows, Linux, or macOS. Start a free trial.
- Paessler PRTG Network Monitor All-in-one network, server, and application monitor that includes NetFlow sensors for traffic load analysis. Runs on Windows Server.
- Dotcom-Monitor A cloud-based Web services testing platform that offers stress testing for websites, APIs, media streaming. and other Web applications.
- SolarWinds Network Performance Monitor An SNMP-based system that includes analytical functions that are based on historical data.
- Tricentis Flood Cloud-based tool that can analyze onsite, remote, internet, and cloud server traffic flows.
- LoadNinja A tester for internet connection loads on web utilities that deploys thousands of real browsers to emulate load on a target site.
- StressStimulus Tester for load on mobile applications and web applications. Generates 10,000 virtual users for stress testing.
- WebLOAD Stress tester from Radview that focuses on web applications.
- SmartMeter.io Network and web application tester that offers a range of views right down to packet level.
- Apache JMeter Free open-source network tester that installs on Windows, Mac OS, and Linux.
- Automai Performance Tester An automated tester that has the capabilities to test Citrix and VMWare, but it also works with SAP, PeopleSoft, Infor, and Oracle systems.
These days, network performance and load testing tools can use virtual entities to mimic the behavior of a real user for more accurate data. But before we look at the best of the best, let’s first discuss why performance testing tools are needed and what types of metrics they measure.
Why are performance and load testing tools needed?
Software and components of IT infrastructure are designed with the best intentions, but hidden errors, unknowns, and unforeseeable events can be disastrous to a project. To mitigate the risk of failure – whether during the development process or after a mission-critical system has been deployed – technicians and engineers need to verify the limits of a system.
The more stress a system or application is put under, the more errors and bugs surface. These types of bugs aren’t usually obvious and need to be dealt with. A problem can’t be solved if it can’t be identified, and performance and load testing tools help refine critical systems by causing hidden issues to bubble to the surface.
What types of systems do these tools test?
Network performance and load testing tools measure a wide variety of metrics. Most of them have a core competency of testing application loads, though they test ancillary metrics too, such as network load.
In addition to website and application speed tests, some tools have network traffic generator modules.
The best network performance and load testing tools
Though many of these tools do require a subscription to unlock all of their features, many have free trials that you can use to get your feet wet with load testing before you take the plunge and sign up for a subscription.
Our methodology for selecting network performance testing systems
We reviewed the market for network testers, such as load testing tools, and analyzed the options based on the following criteria:
- A range of connection testers, starting with Ping
- The option to store metrics for historical analysis
- Performance expectation thresholds
- Alerts for resource shortages or equipment failure
- Load trackers that can provide time-series graphs
- A free trial or a demo for the opportunity to try before you buy
- Value for money from a performance and load testing service that is offered at a fair price
With that said, let’s take a look at the best performance and load testing tools, starting with an industry favorite: ManageEngine.
1. ManageEngine OpManager (FREE TRIAL)
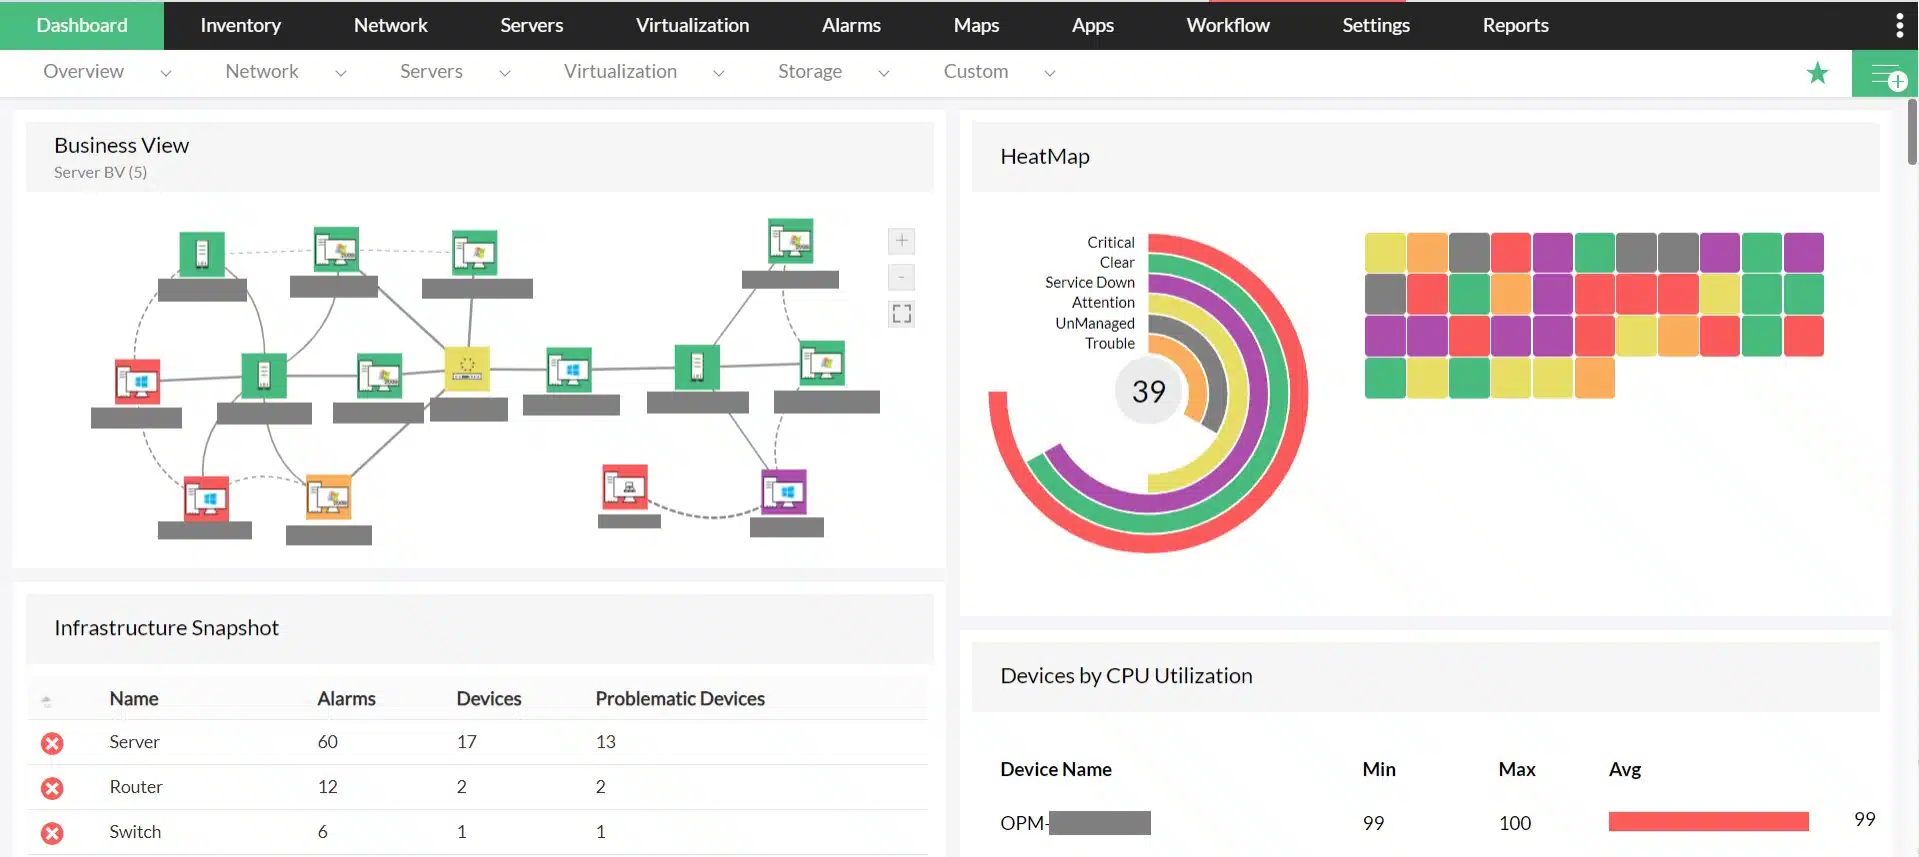
ManageEngine OpManager leads in network performance monitoring and load testing, offering real-time insights into network health and capacity. Its performance monitoring capabilities track key metrics to ensure optimal operation, while the load testing features simulate network traffic to identify potential bottlenecks. The tool’s automated alerting system promptly notifies administrators of any performance issues, allowing for quick resolution. Overall, OpManager is a must for administrators looking to monitor performance and test network loads.
Key Features:
- Performance Monitoring: Tracks and analyzes network performance metrics in real-time.
- Load Testing: Simulates network traffic to test load capacity and performance.
- Customizable Dashboards: Offers personalized views of network performance data.
- Automated Alerts: Sends notifications for performance issues and anomalies.
- Scalable Architecture: Easily expands to support growing network demands.
Why do we recommend it?
ManageEngine OpManager is recommended for its robust performance and load testing capabilities, which provide detailed insights into network health and capacity. Its intuitive interface and comprehensive monitoring tools make it an excellent choice for proactive network management.
Who is it recommended for?
This tool is ideal for IT professionals and network administrators who need to ensure optimal network performance and reliability. It is particularly suited for organizations that require detailed performance metrics and load testing to maintain a high-quality network infrastructure.
Pros:
- Comprehensive Performance Monitoring: Provides detailed insights into network performance.
- Effective Load Testing: Simulates network traffic to test and analyze load capacity.
- Customizable Dashboards: Allows personalized views of performance metrics.
- Automated Alerts: Ensures prompt notification of performance issues.
- Scalable Solution: Easily adapts to growing network demands.
Cons:
- Initial Setup Complexity: Initial configuration can be challenging for new users.
Get started by downloading a 30-day free trial.
EDITOR'S CHOICE
ManageEngine OpManager is our top network performance and load testing tool because it combines comprehensive monitoring with intuitive load testing capabilities. The performance monitoring features provide real-time insights into network health, helping to quickly identify and resolve issues. I found the load testing simulations particularly useful for understanding network capacity and performance under various conditions. Its automated alerting system ensures that any performance anomalies are promptly addressed, minimizing downtime. The customizable dashboards make it easy to view and analyze critical performance data, enhancing overall network management.
Download: Access a 30-day FREE Trial
Official Site: https://www.manageengine.com/network-monitoring/network-performance-test.html
OS: Windows, Linux
2. Site24x7 Network Monitoring (FREE TRIAL)

The Site24x7 All-in-One package covers all aspects of system management and has an extensive network performance module. Network monitoring facilities include constant tests for performance. These are carried out through repeated live checks on network statuses that are judged against pre-set performance expectation thresholds. If a status crosses one of those standards, the Site24x7 raises an alert.
Key Features:
- Traffic & Performance Monitoring: Analyzes network traffic and performance across LANs and the internet.
- SNMP and Alerts: Leverages SNMP for device monitoring, with alerts for performance dips.
- Intuitive User Interface: Simplifies network management with an easy-to-navigate dashboard.
Why do we recommend it?
Site24x7 Network Monitoring is part of a platform of system monitoring modules. The network monitors include device status tracking and traffic analysis. The testing tools in the package focus on connectivity and there are also synthetic monitoring options to check on the availability of websites. This is a cloud-based system.
The All-in-One package includes a bundle of Network Interface monitoring credits. Each “Interface” can cover up to ten network performance statuses. The number of Network Interfaces included with the package depends on which plan the user chooses. The package also includes repetitive tests across the internet to ensure that a website is contactable and that all elements in a page load in an acceptable time frame. Again, these checks will raise an alert if performance falls below an acceptable level.
Who is it recommended for?
This system is offered in packages that combine all of the monitors offered on the platform. The size and price of the plans are leveled at a capacity that is suitable for small businesses. Larger organizations can pay for capacity expansions to get a monitor for higher traffic volumes and larger network sizes.
Pros:
- Unified Monitoring Platform: Offers a comprehensive solution for monitoring networks, servers, and applications.
- Instant Device Discovery: Automatically detects new network devices, updating maps and inventories in real-time.
- Versatile Monitoring: Bridges technical performance with user behavior and business metrics through user monitoring.
- Freeware Option: Provides a basic version of the platform for initial testing without cost.
Cons:
- Learning Requirement: The platform’s depth necessitates a period of learning to master its capabilities.
The Site24x7 All-in-One package is available for free with a limit of five websites or five servers to be monitored. The paid system is available in five editions, all include full network monitoring. The plan levels offer 5, 10, 50, and 100 Network Interface allowances. Each of these editions can be accessed for assessment on a 30-day free trial.
3. Tricentis NeoLoad (FREE TRIAL)

Tricentis NeoLoad tests performance by amplifying any given test by a number of virtual users. The minimum number of virtual users you can get is 300 but you can order many more than that – the price increases with more capacity. The system doesn’t just create a traffic flood, it implements a functional test at volume. So, you can use this package to test the capacity of any asset, either on your network or on the internet.
Key Features:
- Realistic load simulation: Generates realistic user traffic with specific targets to assess service and application durability
- Support for multiple protocols: Implements web, mobile, and API testing, making it adaptable for testing different types of assets.
- Network condition simulation: Emulates various network conditions like bandwidth limitations, latency, and packet loss
Why do we recommend it?
Tricentis NeoLoad is a powerful tool designed for network performance testing and load testing. It is also useful for monitoring Web and cloud delivery systems, such as Web servers, containers, and content delivery networks. NeoLoad simulates realistic user traffic across various network conditions, providing insights into how an application will perform under different loads.
The NeoLoad package is particularly useful for identifying bottlenecks and ensuring that the application can handle peak traffic without degrading in performance. Test local or remote targets with this package. A network condition emulator lets you assess the deliverability of systems that generate a lot of traffic and need speedy transmission, such as VoIP or video conferencing.
NeoLoad can be used for live system monitoring or it can be set up as a continuous tester in a CI/CD pipeline. The tool can also be used to assess potential purchases. This lets you know whether the new tool is viable when applied to your business’s needs.
Who is it recommended for?
The ability to use this tool for ongoing monitoring and for application assessment., this tool has a wide audience. It can be used by developers or by operations technicians. It isn’t suitable for small businesses, though because its starting price is $20,000 per year.
Pros:
- CI/CD integration: Can be used as a continuous tester in a continuous integration and continuous delivery (CI/CD) pipelines
- Comprehensive analytics and reporting: Detailed analytics and reporting provide insights into performance metrics for capacity planning
- Scalability: NeoLoad is highly scalable, capable of handling small-scale tests to large, complex scenarios
Cons:
- Not accessible for small businesses: The starting price for NeoLoad is too high for SMEs
The delivery options for NeoLoad are quite complicated because the system has three elements: A Web platform, a controller, and a load generator. All or any of these units can be hosted on the cloud or on your site. No matter where you host them, you can test network or internet connections and assets. The on-premises options enable installation on Windows, Linux, or macOS. You can assess NeoLoad by accessing a free trial.
4. Paessler PRTG Network Monitor
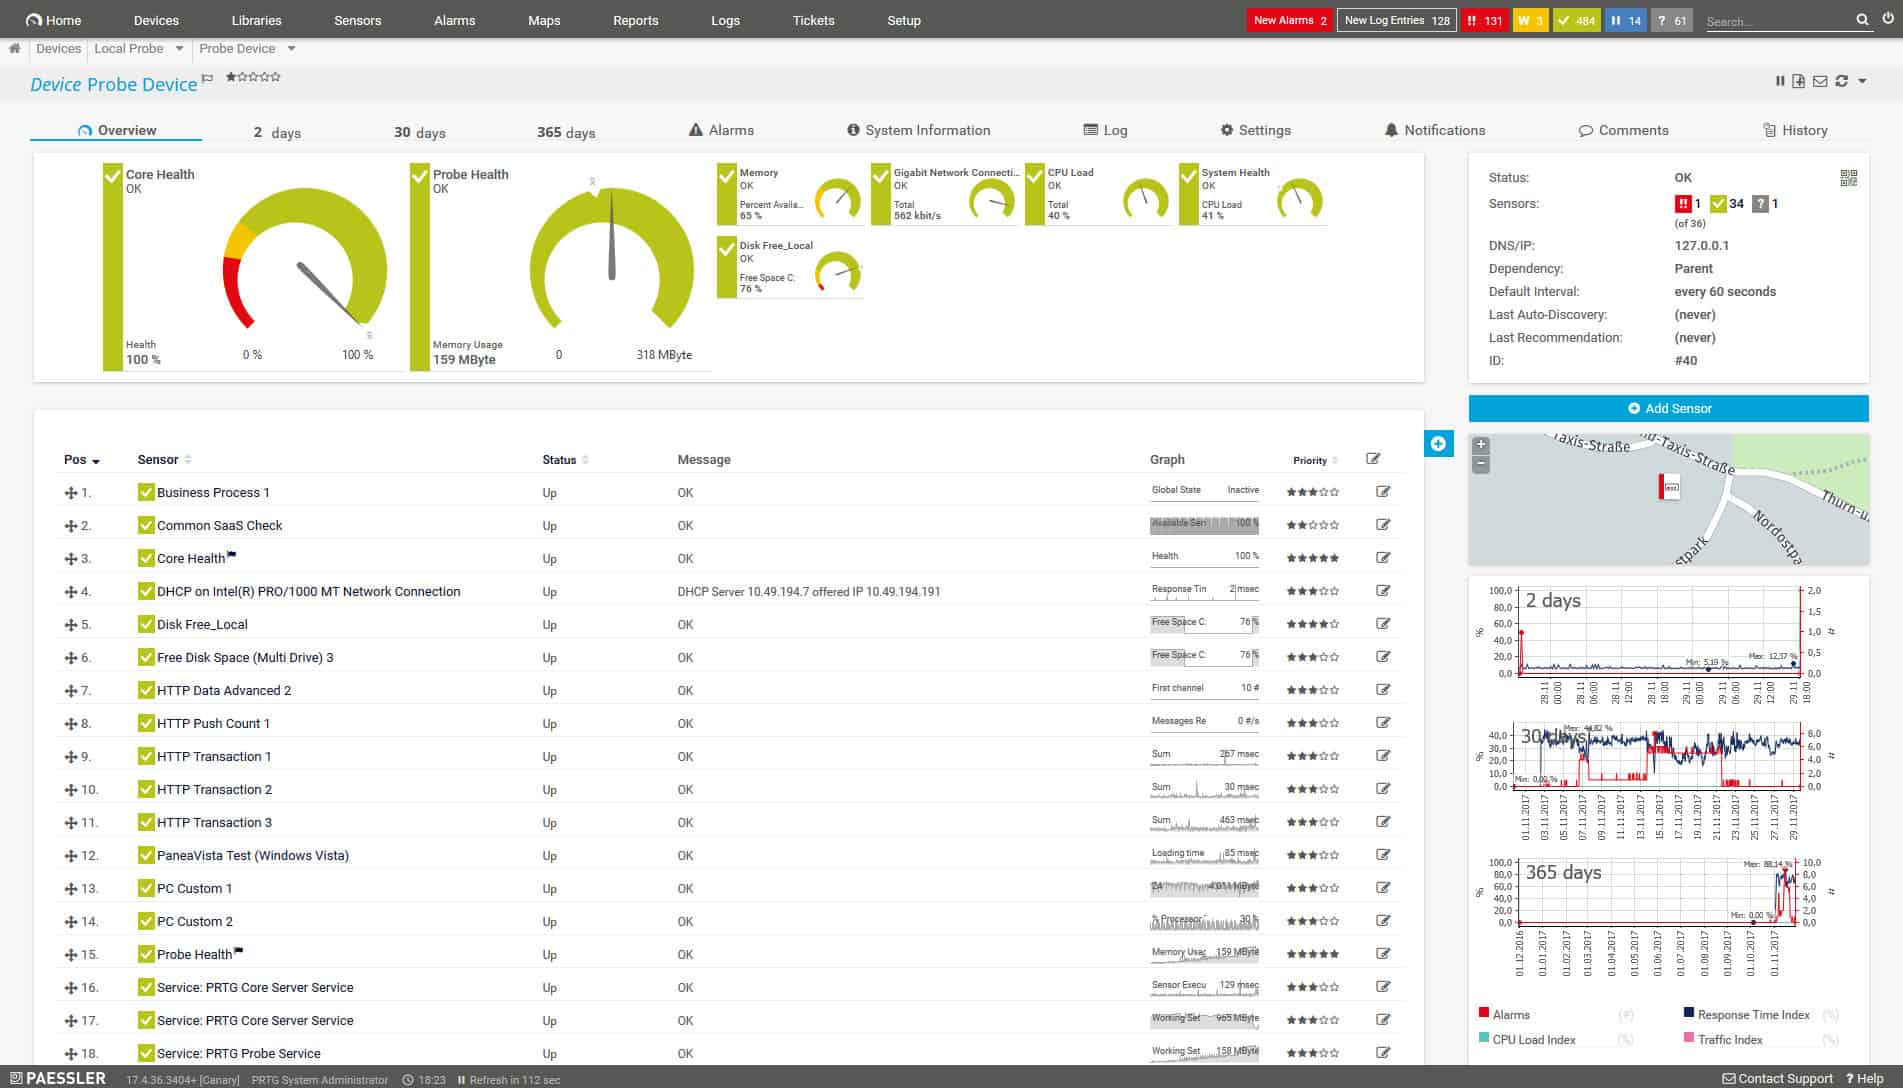
Paessler PRTG is a very large collection of network, application, and server monitors. This package includes load and network performance testing tools. Paessler ships the entire bundle containing all of its monitoring utilities to every customer. You tailor the package to your needs by choosing which monitors to activate. The monitors are termed “sensors” by Paessler and if you only activate less than 500 sensors, the system is free.
Key Features:
- Broad Traffic Analysis: Captures and analyzes traffic using NetFlow, sFlow, J-Flow, IPFIX, and SNMP.
- Sensor-Based Monitoring: Customizes network monitoring with selectable sensors, free for up to 100 sensors.
Why do we recommend it?
Paessler PRTG Network Monitor implements network discovery and then creates an inventory and a network map. The discovery service repeats, automatically updating the inventory and the map. The system also implements continuous device status checking and has a number of connection probing and analysis functions for network performance testing.
PRTG uses SNMP procedures to keep a constant check on the performance of all of your network devices. The tool will detect all of those devices automatically, compiling a hardware inventory and displaying live statuses on the management console.
NetFlow sensors in the package add further insights into your network performance. This sensor exploits a packet sampling language created by Cisco to let you see the flow rate of data between two points on your network. You can also use this tool to capture packets through port mirroring and check on the health of VoIP connections.
Who is it recommended for?
This system contains a very large number of monitoring tools. The buyer pays for an allowance of sensors and then decides which to turn on. There are a number of network testing tools in the package, including Ping and Traceroute. If you only activate 100 sensors, the package is free to use.
Pros:
- Comprehensive Insights: Combines packet sniffing with VoIP and QoS monitoring for detailed analysis.
- Alert Versatility: Offers numerous alerting options, including email and SMS for immediate notifications.
- Dashboard Flexibility: Enables personalized dashboard setups for focused monitoring efforts.
- Freeware Availability: Supports small network monitoring needs without cost for up to 100 sensors.
Cons:
- Initial Complexity: The wealth of features and customization options may overwhelm new users at first.
Paessler offers PRTG on a 30-day free trial. This software installs on Windows Server.
Related post: Port Mirroring Guide
5. Dotcom-Monitor Load Testing

Dotcom-Monitor offers a range of Web testing services from its cloud platform. One of its plans is a Load/Stress Testing service. This plan is able to launch volumes of traffic from real browsers towards a website or application.
Key Features:
- Focused Web Testing: Specializes in load testing for web services and applications to evaluate performance pressures.
- Dynamic Test Modeling: Provides various load simulation strategies to assess website resilience.
Why do we recommend it?
Dotcom-monitor Load Testing is part of a cloud-based platform of monitoring and analysis tools for managing websites and Web applications. The platform offers a service called LoadView, which is a stress testing system. This is separate from the Web monitoring packages that are offered by the company.
The stress testing service of Dotcom-Monitor is actually run by a division of the company, called LoadView. Volumes of traffic highlight where APIs or other elements of a Web page are unable to cope with large amounts of traffic. This is a useful test because you might ensure that your Web server is able to cope with demand but overlook the functions that create its key functions, such as the shopping cart.
The testing service lets you assemble scripts so that you can be sure that those vital services are actually being triggered by your tests. The environment lets you shape traffic surges so you can implement tests following:
- Load Step Curve
- Goal-based Curve
- Dynamic Adjustable Curve
These different strategies allow you to stress your sites and services from different angles and ensure that they will hold up in different circumstances.
Who is it recommended for?
The LoadView system isn’t part of the regular Web monitoring packages and you pay for it on demand. That means that you don’t need to be a long-term subscriber to the monitoring service in order to use the stress testing system. Tests can reach into Web page elements through scripts.
Pros:
- Scriptable Tests: Allows for detailed scripting to target specific web functions and APIs during tests.
- Flexible Testing Service: Offers stress testing on a pay-as-you-go basis, requiring no long-term commitment.
Cons:
- Configuration Challenges: Setting up and interpreting tests can be complex and time-consuming.
- Cost Concerns: Potentially expensive for comprehensive testing scenarios compared to alternatives.
The LoadView service is offered in three subscription plans plus a pay-as-you-go service. You can experience the system on a 30-day free trial.
6. SolarWinds Network Performance Monitor
The SolarWinds Network Performance Monitor (NPM) offers network testing tools that will help you spot problems with the delivery of services within your system.
Key Features:
- Automated Device Tracking: Automatically detects and monitors the health of network devices.
- Protocols and Path Analysis: Utilizes SNMP, Ping, and Traceroute for comprehensive network insights.
- Custom Alerts: Configures performance benchmarks, alerting via email when thresholds are crossed.
Why do we recommend it?
The Network Performance Monitor implements ongoing network status reporting as well as providing network testing tools. The system will show if a network device is down but there are other systems for performance testing as well, including Ping and Traceroute options. Add on the NetFlow Traffic Analyzer to get the path analyzer called NetPath.
This tool is a very sophisticated monitoring system that detects all devices attached to the network automatically. You don’t need to install any agent software on your devices because they are all shipped with SNMP capabilities. The Simple Network Management Protocol includes procedures for constant monitoring of network devices. All that your system lacks is a central controller to request and collate this data. This is the role taken by the SolarWinds Network Performance Monitor.
Network testing functions within the NPM include troubleshooting utilities that are based on historical data. At first glance, it is difficult to work out whether performance issues are being caused by the network, services, and applications, or software processing problems at servers and endpoints. The PerfStack utility within the Network Performance Monitor shows you all of the underlying contributors to service delivery. These graphs are color-coded so you can get down to the stack level that is displaying errors and fix the problem quickly.
Another useful performance monitoring tool in the package is the NetPath utility. This enables you to see in real-time the delivery times of data from one point on the network to another, showing the statuses and speeds of each node that packets have to pass through on that journey.
The Network Analysis Tool within SolarWinds NPM gives you graphical representations of performance metrics so you can see in an instant when performance begins to be impaired.
Who is it recommended for?
This is a large package and it is suitable for big organizations. The tool will discover all of your network devices., create a network inventory, and then generate a network topology map. So, it is great for assessing and reorganizing an unplanned network.
Pros:
- Network Discovery & Mapping: Identifies all network devices and creates visual topology maps automatically.
- Integrated Monitoring Tools: Includes Ping, Traceroute, and NetFlow for in-depth network analysis.
Cons:
- Complexity for Non-Tech Users: May be daunting for users without technical expertise due to its extensive features.
You can get the Network Performance Monitor on a 30-day free trial.
7. Tricentis Flood

Tricentis offers a variety of products including qTest, Tosca, RPA, and its distributed load-testing product Tricentis Flood. In addition to public and private cloud deployment options, Tricentis Flood also supports open-source generation tools such as JMeter, Selenium, and Gatling.
Key Features:
- Versatile Traffic Simulation: Offers tools to mimic various user behaviors and traffic patterns.
- Comprehensive Testing Suite: Supports testing across LANs and websites with powerful open-source tools.
- Cloud and On-Premises Testing: Flexible deployment options to suit different testing environments.
Why do we recommend it?
Tricentis Flood is a cloud-based load testing service. This service can be used to test Web applications and websites and you can also download an agent to run on your own endpoints that will test the resilience of your network. Virtual users can be programmed to behave in different ways.
Its subscription model is rather simple, providing both monthly and annual options. Though Tricentis Flood is geared towards enterprises, it also has a version for small to medium-sized businesses with a relatively inexpensive monthly fee.
Who is it recommended for?
This service can be used by anyone. The package is mainly aimed at testing Web applications but it can easily be converted to a network load testing tool with agents for Windows, Linux, and macOS. You pay for virtual user hours, so it isn’t necessary to sign up for a long-term subscription.
Pros:
- Flexible Pricing Model: Monthly and annual subscription options cater to businesses of all sizes.
- Cloud Integration: Seamlessly works with Azure and AWS for extended testing capabilities.
- Broad Tool Compatibility: Incorporates JMeter, Selenium, and Gatling for diverse testing scenarios.
Cons:
- Interface and Visualization: Some areas of the user interface and data visualizations could be enhanced for better clarity.
- Trial Limitations: A more feature-rich trial period could better demonstrate the platform’s capabilities.
We also like how Tricentis designed its solution to integrate with private hosting providers such as Microsoft Azure and Amazon Web Services. In addition to a rather limited free trial, you can also request a demo.
8. LoadNinja

LoadNinja is another fierce competitor in the load testing and performance testing arena. It too offers a free trial that requires minimal information and doesn’t request payment details upon sign-up. It offers record and playback test scripts that are automated which don’t require coding on behalf of the user.
Key Features:
- Real Browser Testing: Utilizes thousands of real browsers for accurate load testing results.
- Codeless Scripting: Enables automated test script creation without the need for coding.
- Detailed Response Analysis: Tests and measures application response from multiple locations.
Why do we recommend it?
LoadNinja is a cloud-based system that tests Web applications and websites with an option to test systems on your network. However, this tool is for application stress testing rather than network stress testing. You can direct traffic from outside or download a local agent and originate traffic within your network.
Its data is platform-independent thanks to its browser-based data console. SmartBear, the creator of LoadNinja, offers a 14-day free trial as well. And instead of using a browser emulator to stimulate and simulate load, it uses thousands of real browsers for the most accurate testing.
In addition, it has a virtual user inspector and debugger that works in real-time. Furthermore, it’s equipped with tools to test applications over the LAN via dedicated IP addresses. The Pro version supports up to 250 virtual users, while the Premium version supports up to 2,500 virtual users. Larger enterprises with greater testing demands can contact SmartBear regarding pricing details for over 2,500 virtual users.
Who is it recommended for?
Although this package is advertised as an application stress tester, you can ignore the analytic screens in the service and just watch your network monitor to look at network device performance when a traffic surge occurs. Pricing is on a subscription or for an on-demand service.
Pros:
- User-Friendly Interface: Designed for ease of use, allowing quick adoption by non-technical users.
- Accurate Testing Approach: Employs real browsers for testing, providing realistic capacity insights.
- Real-Time Debugging: Features a virtual user inspector and debugger for immediate issue resolution.
Cons:
- Trial and Integration: Extended trial and more integrations with APM tools would enhance its utility.
- Browser Performance Comparison: The ability to compare performance across different browsers is missing.
9. StressStimulus

StressSimulus is interesting because its designers not only created it to test web applications, but also mobile applications. Also, it can run tests both locally and in the cloud to help isolate performance bottlenecks so you can address the weakest components of your application. We also found it interesting that it simulates security by allowing a tester to supply each virtual user with login credentials to better gauge the impact of high-volume authentication.
Key Features:
- Web and Mobile Application Testing: Designed to test the performance of web and mobile apps under stress.
- Authentication Simulation: Allows testing with virtual user login credentials for realistic scenarios.
- Bottleneck Identification: Pinpoints traffic bottlenecks to improve application performance.
Why do we recommend it?
StressStimulus is another cloud service that is designed to test Web applications, websites, and mobile apps, rather than networks. However, you can set it up to target an application on your network, letting the traffic flow through your network devices for testing. You can also download traffic generators.
This feature supports login credentials and virtual user identities by interfacing with web forms, Basic, NTLM, and Kerberos. In addition, it can simulate user behavior to load-test dynamic pages and other factors like session IDs and cookies. Supported protocols include HTTP, HTTPS, AJAX, SOAP, WCF, binary WCF, and XML over HTTP.
Who is it recommended for?
StressStimulus has a free plan, which provides 250 virtual users that will run for one hour. The other three plans are monthly subscription services. you could set a target to an internal application and then watch your network monitor instead of using the analytics service built into the StressStimulus console.
Pros:
- Versatile Application Testing: Capable of testing a wide range of applications, including mobile apps.
- Customizable Virtual User Behavior: Offers detailed settings to simulate specific user environments.
- Scripting and Automation: Provides automation options with the flexibility of scripting for advanced users.
Cons:
- User Interface: The interface could be more modern and less cluttered for better user experience.
- Short Trial Period: A longer trial would offer more time to evaluate the tool’s full range of features.
Note that this is an automated solution and does not require the user to write scripts, though scripting features are included. We were disappointed to see that StressStimulus has a free trial that only lasts for seven days. Conversely, we were surprised to see that the free trial includes as many as 10,000 virtual users and full customer support. We find that it’s rare for a free trial to include customer support because companies typically want to reserve that resource for paying customers, so kudos to StressStimulus.
10. WebLOAD

WebLOAD, like other performance testing tools, isn’t strictly a network performance tool. As its aptly named moniker implies, its designers created it specifically to test the performance and scalability of web and mobile applications.
Key Features:
- Web & Mobile Testing: Specializes in assessing the performance of web and mobile applications under stress.
- Server Stress Analysis: Evaluates how web servers handle heavy traffic loads.
- Interactive Testing: Analyzes the performance of dynamic elements in applications.
Why do we recommend it?
WebLOAD is another Web application tester but there are ways that you can use this tool for network load testing. For example, you can download load generators, use the SaaS package and point it to an application hosted on your site, or get an on-demand service on your cloud account, and point that to a target on your site.
Created by Radview, WebLOAD offers an analytics dashboard that provides insight into Javascript performance and server-side performance. And like most other performance testing tools, WebLOAD has a free trial that supports up to 50 virtual users.
Who is it recommended for?
The Web testing service can be manipulated so that it runs traffic over your network. The system is available in three plans with the Starter plan only being available for download. The two higher plans have SaaS and downloadable options. You can get these tests at an on-demand rate.
Pros:
- Intuitive Interface: Features a widget-based dashboard for easy access to performance insights.
- Cross-Platform Support: Compatible with both Windows and Linux, accommodating a wider range of users.
- Generous Trial: Offers a fully-featured trial for up to 50 virtual users, showcasing its capabilities.
Cons:
- Limited Documentation: Could benefit from more comprehensive self-help resources.
- Scripting Examples: More pre-built scripts or scripting guidance would enhance usability.
The free trial is full-featured too; full-featured trials may not be the norm, but are becoming more and more popular. Supported technologies include HTTP/HTTPS, HTML5, AJAX, SOAP, and more. The free edition runs on both Windows and Linux platforms and integrates with Dynatrace, AppDynamics, and New Relic.
11. SmartMeter.io

SmartMeter.io offers distributed load testing by creating masses of virtual users with software generators to simulate high demand. In addition to real-time analysis, it translates data into graphs to make it easier to spot trends and the results of tests.
Key Features:
- Distributed Testing: Mimics a botnet to generate high traffic volumes from various locations.
- Traffic Analysis: Converts test data into graphs for trend analysis and result interpretation.
- Mobile Browser Simulation: Offers features to test mobile web browsing scenarios effectively.
Why do we recommend it?
SmartMeter.io is a downloadable traffic generator for network load testing. You can install the generator on multiple devices to get different traffic patterns and the service includes an action recorder so you can easily create test scenarios to try out different pieces of equipment and user behavior patterns.
We especially like that it has a feature that simulates mobile browsers. Additionally, we like its logging feature to record and display individual HTTP requests and responses so you can comb through HTTP data with the granularity of a packet capture. We were pleased to see that it is significantly more inexpensive than most competitors and that even the Personal version – which is the most basic version – allows 500 virtual users and an unlimited number of tests.
Who is it recommended for?
This tool can be used for network testing or website testing. Unfortunately, this is a much more expensive system than the other testers on this list and it doesn’t have an on-demand option – you have to take out a monthly or yearly subscription. Those pricing factors might put off small businesses.
Pros:
- Mobile Testing: Excellently simulates mobile browser environments for comprehensive mobile testing.
- Detailed Logging: Provides extensive logging capabilities for in-depth offline analysis.
- Cost-Effective: Offers competitive pricing, making it accessible for smaller setups.
Cons:
- Interface Design: The user interface could be optimized for better monitoring and usage visibility.
- Update Frequency: More regular updates could improve performance and feature set.
- Integration Needs: Could benefit from more connections with Application Performance Monitoring tools.
We were, however, disappointed to discover that SmartMeter.io does not issue refunds. According to their refund policy, they will not offer refunds because it is not a tangible good. We suppose the lack of an adequate refund policy is justified by its low cost. Nevertheless, it has a free trial that allows you to test the waters before taking the plunge.
12. Apache JMeter

Apache JMeter is undoubtedly a popular performance and load testing solution because it is free and open source. Naturally, it’s available on GitHub as a native Java application, and it’s incredibly versatile. In addition to testing dynamic web applications and static resources, it also includes network and Java-objects testing functionality.
Key Features:
- On-Premise Solution: Provides a self-hosted testing environment for full control.
- Development Focus: Ideal for development phase testing with protocol-level traffic generation.
- Versatile Testing: Supports a wide range of protocols and platforms for comprehensive testing.
Why do we recommend it?
Apache JMeter is exactly the type of package that small businesses are looking for because it is free to use and it can be used to test networks, servers, or websites. The tool is self-hosted and it will run on Windows, macOS, and Linux. It includes a test scenario recorder.
To further highlight its versatility, be aware that it runs on a variety of platforms including Windows, Mac OSX, Linux distributions, and any other Java-compatible platform in its CLI mode. Supported nodes and protocol types include web (HTTP, HTTPS, Java, PHP, ASP.NET), FTP, LDAP, JDBC, mail protocols (SMTP, POP3, IMAP), TCP, and Java objects.
I did want to highlight a disclaimer Apache provides on its website, however. Apache makes it very clear that this solution is not a web browser. Even though it may look like one, it actually works on the protocol level. As such, it lacks the capability to simulate virtual user behaviors from a browser or execute a web page’s Javascript. Nevertheless, this is a great free tool for those wishing to perform load testing and preserve their budget. Check them out on GitHub.
Who is it recommended for?
The fact that it is free and will install on all of the major operating systems means that you can really have fun with this tool by installing it on many devices and checking out the performance of different routers. Record a macro to replay for your tests and model different behaviors.
Pros:
- No Cost: Completely free and open-source, offering a budget-friendly testing solution.
- Dark Mode Design: Features a user-friendly design with dark mode for comfortable extended use.
- Java Object Testing: Allows for the individual testing of Java objects, adding to its versatility.
Cons:
- User Simulation Limitations: Lacks the ability to simulate virtual user interactions fully.
- Bug Resolution: Issues may persist longer due to its open-source nature and community-driven support.
- Support Options: Absence of paid support may limit assistance for troubleshooting.
13. Automai Performance Tester

Last but not least is the Automai Performance Tester. One thing we like about this product is that Automai intentionally designed it to be as user-friendly and automated as humanly possible. To facilitate this design goal, Automai made the scripting process completely code-free. All a tester need do is click and use the application as a normal user would, and Automai will automatically generate scripts that are easy to tweak and edit.
Key Features:
- Code-Free Scripting: Enables easy script generation without coding, simplifying the testing process.
- Error Capture: Automatically snapshots error messages for efficient troubleshooting.
- Informative Graphs: Provides clear and actionable insights through well-designed graphical representations.
Why do we recommend it?
Automai Performance Tester is a service on the Automai Robotic Automation platform. Automai specializes in linking different applications together and passing data between them. It is a business process automation system and its load tester is geared towards examining the efficiency and speed of those flows.
This smart software also has an interesting way of recording flaws and errors. It can detect problems and bottlenecks, and then take screen captures to highlight the pain points. We were also to see how modular it is. Not only does it work with Citrix and VMWare, but it also works with SAP, PeopleSoft, Infor, and Oracle. Underlying programming platforms in which it interfaces with, include .NET, Java, C++, Flash, Adobe, SQL, and HTML5 as well.
Who is it recommended for?
You would probably be more likely to use this testing tool if you are a customer of the Automai business process automation system. However, the tool can be used to test a process flow before you actually implement it and the scenarios can be set up by recording walk-throughs.
Pros:
- User-Friendly Design: Offers a straightforward and accessible interface, ideal for users without technical expertise.
- Bottleneck Detection: Automatically identifies and documents performance bottlenecks, aiding in optimization efforts.
- Versatile Compatibility: Compatible with a wide range of applications and platforms, from Citrix and VMWare to SAP and Oracle.
Cons:
- Short Trial Period: The 14-day trial may not provide sufficient time for thorough evaluation of the software.
- Limited for Tech-Savvy Users: More advanced users may seek additional customization and testing options.
Be aware that there is a free trial that lasts for 14 days. Again, we were surprised to see that even the free trial includes full technical support, though we don’t believe this free trial is fully-featured. Still, the free trial is a great way to test your network before committing to a purchase.
Choosing a network performance and load testing tool
Apart from the tools mentioned featured above, there are more purpose specific free tools, that are a lot narrower in scope and functionality that can be of use. Paessler offers a number of free performance and load tools, which include the NetFlow Tester, which gathers NetFlow messages, and the Webserver Stress Tool, which tests the performance of your websites.
It’s simply impossible to know how a new application or resource will react under heavy stress without testing tools. The right tools will help uncover issues that would otherwise be discovered by the end-user.
Instead of taking the approach of Microsoft and rolling out a new system with thousands of bugs, we advise you to use one of the aforementioned performance and load testing tools to make sure you’ve got all of your ducks in a row.

