

Since Elasticsearch was first released by Shay Bannon in 2010, it has gone on to become one of the most widely used search and analytics engines on the market that many enterprises use to navigate databases and documents. However, with unsecured databases attacked 18 times a day by hackers, protecting Elasticsearch is vital for preventing data breaches.
In this Elasticsearch security guide, we’re going to look at some best practices for keeping the engine secure, and some monitoring tools you can use to monitor the service.
How do Hackers Break into Elasticsearch?

Elasticsearch is not immune to cyberattacks, and if improperly configured, it can become a target for hackers. Understanding how hackers break into Elasticsearch can help businesses better secure their systems against potential breaches.
One of the most common ways hackers exploit Elasticsearch vulnerabilities is through default or weak credentials. Elasticsearch often comes with default settings that may include weak or no authentication controls at all. If administrators fail to change these defaults or configure proper access controls, attackers can easily gain unauthorized access. Once inside, hackers can steal sensitive data or even execute malicious commands.
Another common method is exploiting open or exposed Elasticsearch clusters. Many organizations unintentionally expose their Elasticsearch instances to the public internet without proper firewalls or access restrictions. These open clusters can be discovered by attackers using scanning tools, and once accessed, hackers can manipulate or exfiltrate data. Exposed Elasticsearch clusters are often left unprotected, offering attackers a direct path to compromise the system.
Additionally, misconfigured permissions can play a significant role in security breaches. If an Elasticsearch deployment is set up without proper user roles or restrictive access controls, attackers can escalate their privileges and gain broader access to the system. Misconfigured security settings can allow them to access or modify large amounts of sensitive data, causing serious security and privacy issues.
Hackers may also take advantage of vulnerabilities in outdated Elasticsearch versions. Like many software systems, Elasticsearch releases regular updates to address security flaws. If a system is running an outdated version with known security vulnerabilities, hackers can exploit these weaknesses to gain access to the cluster.
Finally, data injection attacks may be used to insert malicious queries or code into an Elasticsearch instance. Once executed, these attacks can lead to data manipulation, denial of service, or even full server compromise.
Elasticsearch Best Practices
There are many different actions you can take to secure elastic search, all the way from closing open ports to user authentication and access control. In this section, we’re going to look at some of the ways you can minimize security risks when using Elasticsearch:
1. Don’t connect to the internet
One of the simplest ways to secure Elasticsearch is to make sure that it isn’t connected to the Internet. Exposing Elasticsearch puts your data within reach of malicious entities and DoS attacks. Elasticsearch’s default settings tie nodes to the localhost, but you can also use the network/host in Elasticsearch’s YAML configuration file to bind nodes to a private or secure public IP.
2. Close Open Ports
Open ports represent a security risk that attackers can use to gain access to your network. Closing open ports eliminate key vulnerabilities that cybercriminals can exploit. Elasticsearch uses port 9200 for requests and 9300 for cluster communication between nodes. When these ports are open, unauthenticated users can call Elasticsearch’s API to conduct actions such as copying, deleting, or encrypting, data.
Block ports 9200 and 9300 for all nodes so that the service can’t be accessed from the public internet. Closing the ports will ensure that hackers aren’t able to freely collect your information.
3. Restrict HTTP-enabled nodes to private IPs and disable HTTP
Restricting what IPs elastic search will listen to is essential for ensuring that public IPs can’t access it. You can restrict the nodes by setting the network.bind_host or network.host to a private IP. Outside of your HTTP-enabled client nodes, disable HTTP by setting http/enabled to false.
4. Encrypt Your data
Encrypting your data at rest is a must for stopping it from being collected by cybercriminals. However, Elasticsearch doesn’t have encryption available by default so you need to use an external tool. Dm-crypt is a great utility you can use in the Linux kernel to encrypt your data and keep it secure. Using TLS encryption to encrypt all cluster traffic is a must for ensuring complete protection.
5. User Authentication
Setting up user authentication enables you to control who has access to Elasticsearch, helping you prevent malicious entities from getting access to sensitive data. Elasticsearch’s user authentication options mean that users must verify their identity via a password, credential, or authentication token. You can set up user authentication natively or through a third-party solution like LDAP or Active Directory.
6. Implement Access Controls
Role-based access controls are another essential tool for controlling access to your data. Creating access controls will enable you to determine who can access resources like documents and indices, limiting the number of people in your organization who have access to protected data.
7. Use Audit Logs
Monitoring audit logs is an effective way to identify malicious activities. With audit logs, you can track the actions of users connected to an Elasticsearch cluster. Logging user activity will help you to identify suspicious or malicious activity so that you can respond promptly to fix the problem, reducing the meantime to the resolution of security events when they occur.
8. Regularly update Elasticsearch
Whenever a new version of Elasticsearch comes out, it’s important to upgrade to patch old vulnerabilities. Leaving any software unpatched provides hackers with unaddressed vulnerabilities they can exploit. Regular updates will ensure your defenses are always up-to-date and will decrease the chance of a data breach.
9. Disable Scripting
If you’re using a version of Elasticsearch before 5.x then its vital to disable dynamic scripting. Disabling dynamic scripting prevents hackers from deploying malicious scripts through the search API, which can destroy, copy, or encrypt your data against your will, and put you out of action.
10. Monitor Elasticsearch
Continuously monitoring Elasticsearch is invaluable for helping you to detect poor performance and anomalous behavior. Many cloud monitoring tools provide alerts that notify you when a security event takes place. That way you can begin troubleshooting to fix the problem whether it’s a small issue or a full-blown cyber attack.
Top Tools for Monitoring Elasticsearch
Continuously monitoring ElasticSearch gives you the ability to detect the signs of a security breach or poor performance. While Elasticsearch’s APIs can be used to measure performance, it’s much more convenient to use an external application or cloud monitoring tool, because you can monitor all of your infrastructures in one place.
In this section, we’re going to look at some of the top tools for monitoring ElasticSearch. The tools listed include solutions with high-quality dashboards with rich visualization options and configurable alerts to notify you about the problematic activity.
Here are the top tools for monitoring ElasticSearch:
- Datadog EDITOR’S CHOICE Cloud monitoring software with a custom dashboard, graphs, charts, alerts, snapshots, full API access, and more.
- ElasticHQ Open-source Elasticsearch monitoring software with cluster health monitoring, analytics, recommendations, and more.
- Dynatrace Application performance monitoring software with autodiscovery, anomaly detection, custom alerts, and more.
Our methodology for selecting an Elasticsearch monitoring system
We reviewed the market for system monitoring packages that can keep an eye on Elasticsearch operations and tested the tools based on the following criteria:
- A tool that could monitor both on premises and cloud implementations of Elasticsearch
- The ability to monitor the other units in the ELK stack as well
- Alerts for response time problems
- Monitoring of supporting technologies for full-stack observability
- Options for on-premises tools or SaaS packages
- A free trial or demo for a no-cost assessment opportunity
- A reasonable price that reflects the quality of the services that are offered
1. Datadog
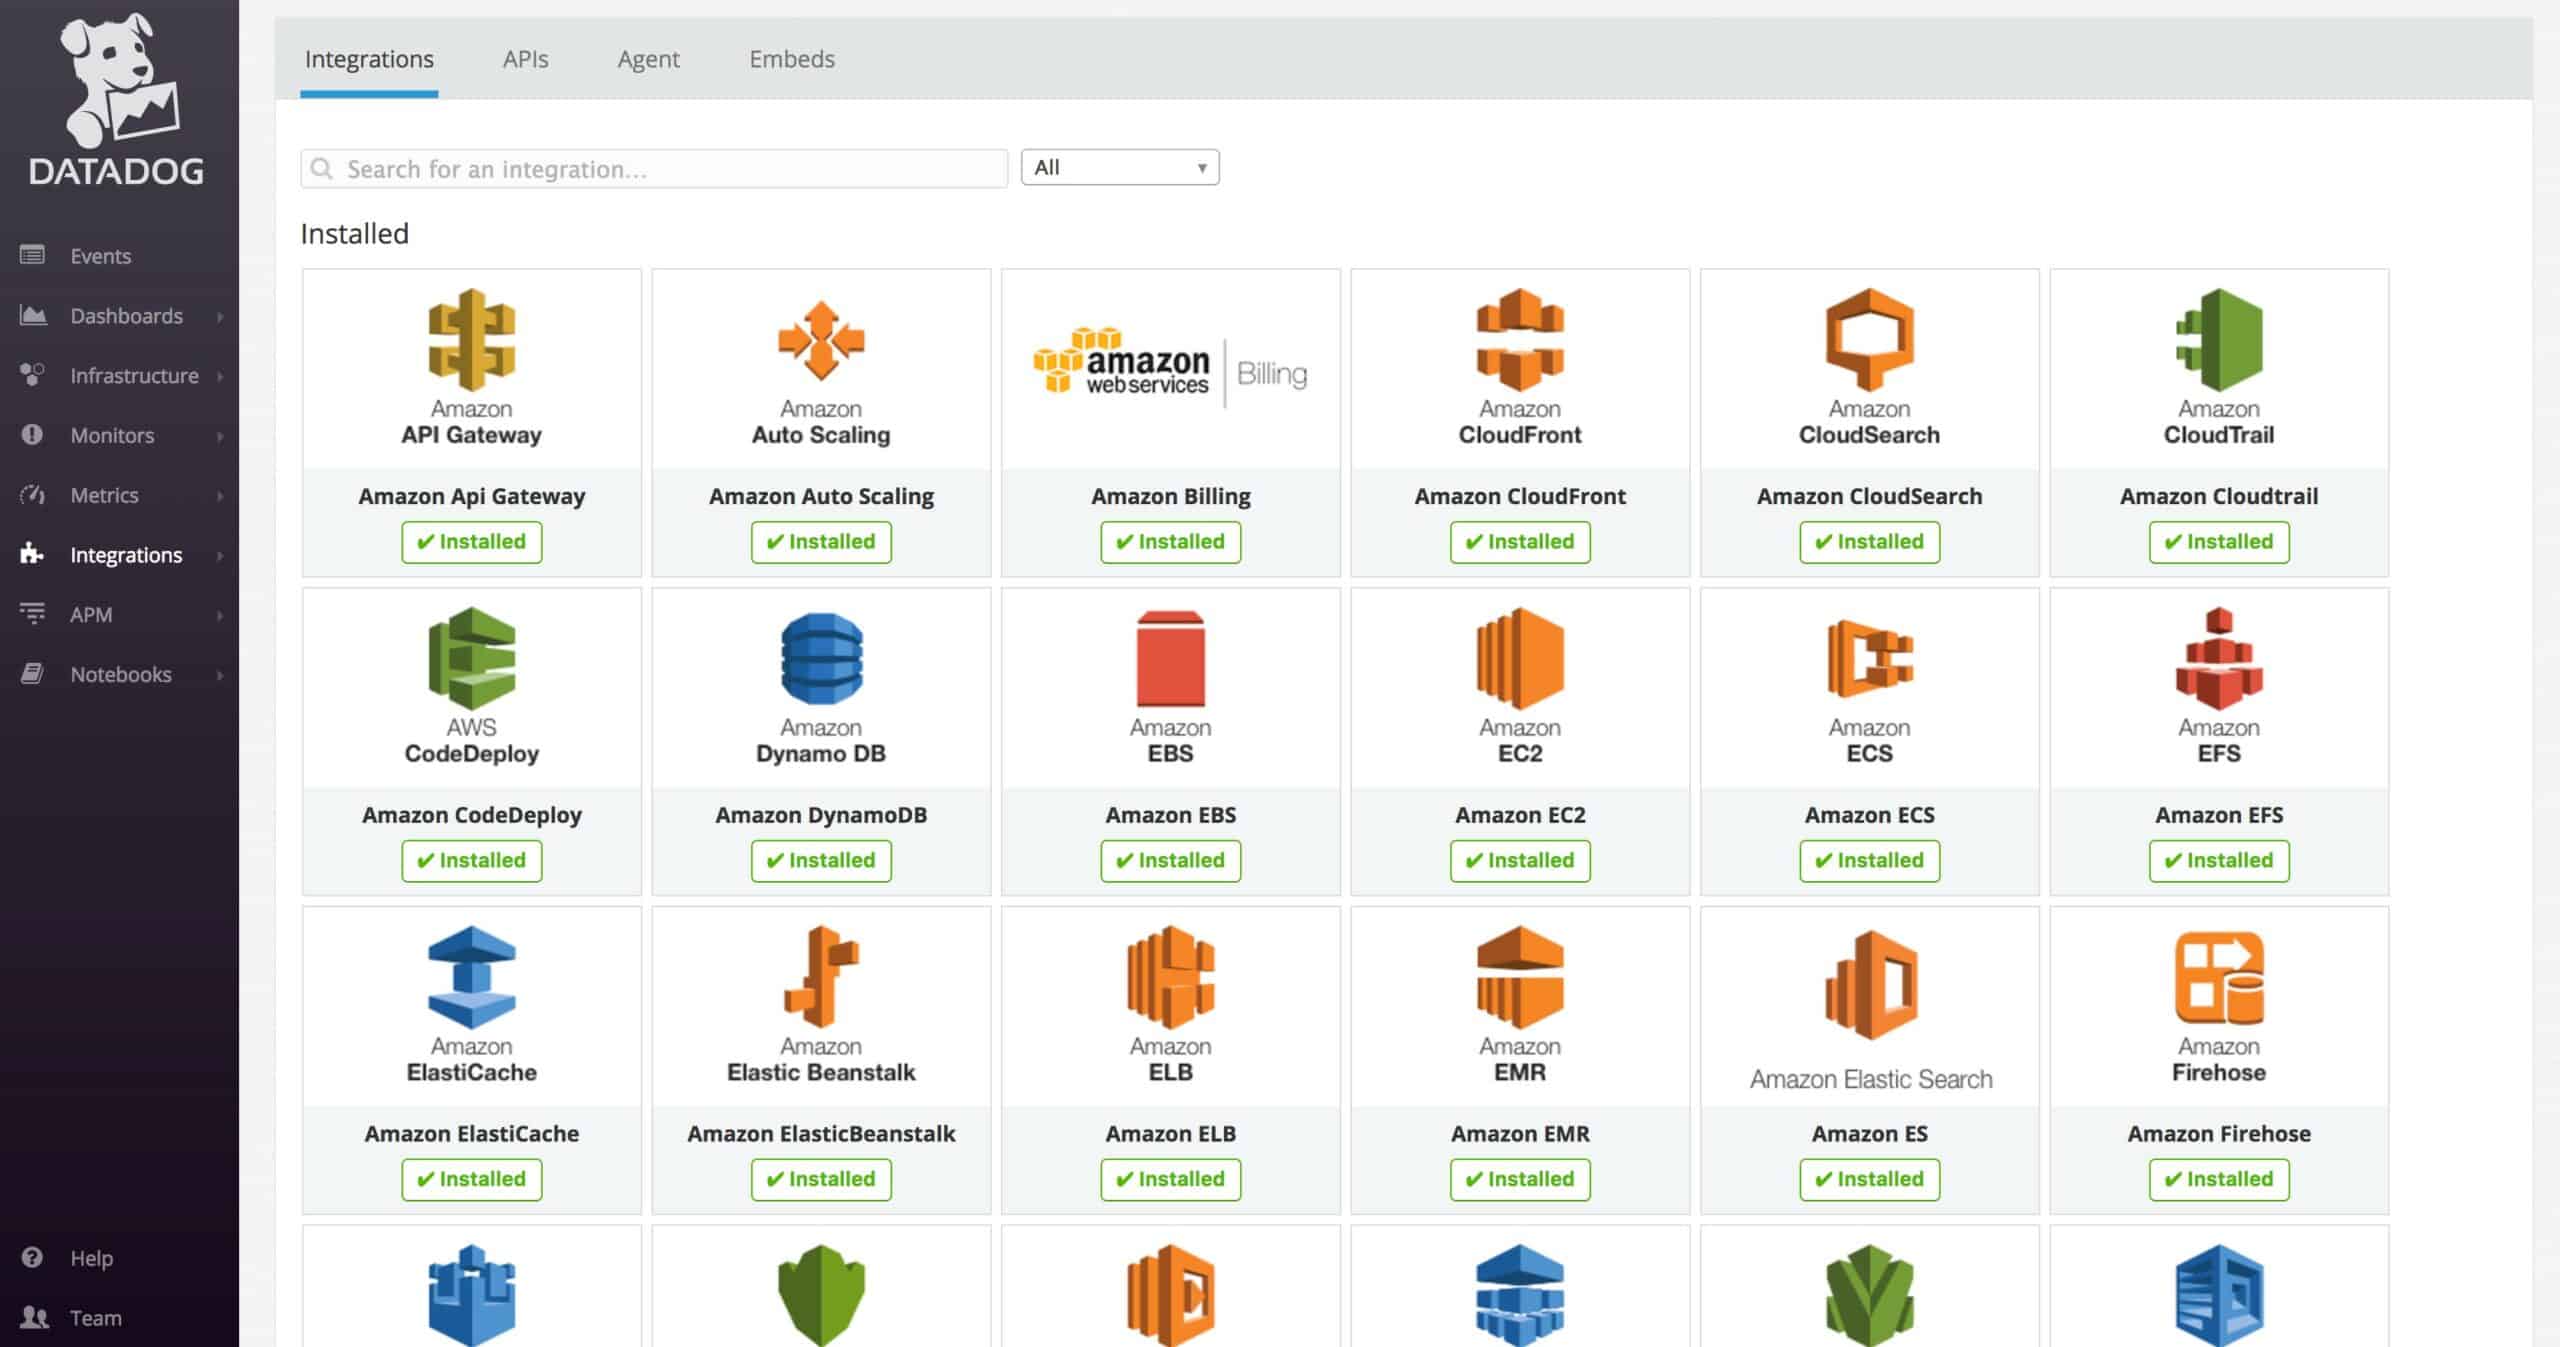
Datadog is a cloud monitoring solution that you can use to monitor the status of Elasticsearch clusters. With Datadog you can collect Elasticsearch performance metrics like CPU, memory, and I/O utilization, and view them through a customizable dashboard with visualization options like graphs and charts.
Key Features:
- Customizable dashboard
- Graphs and charts
- Alerts
- Snapshots
- Full API Access
Why do we recommend it?
Datadog is a cloud platform with many modules that can be used to monitor the security and performance of Elasticsearch. The main option available for performance monitoring is the Infrastructure Monitoring module. This can be expanded by integrations and there is one available for Elasticsearch Monitoring. The Datadog platform also includes a Log Management unit and a Cloud SIEM, which can be used for Elsticsearch security monitoring.
An alert system provides you with alerts on any metric within your cluster. For example, if CPU or memory usage crosses a predefined threshold then the platform will send you an alert by email, PagerDuty, or Slack message. Users can create complex alert conditions to determine when the system generates notifications.
The platform also offers snapshots, where you can send an image of a performance issue or graph to another member of your team to verify if there’s a problem or not. When managing alerts, you can also see who has responded to an alert in the past, making it easier to know what actions were taken to fix the issue.
Who is it recommended for?
The Datadog system is suitable for any business. However, its large array of modules might be a little too complex for small businesses. The Log Management and Cloud SIEM units are priced by data throughput, which is an appealing charge rate for small and large organizations alike.
Pros:
- Features templates for monitoring Elasticsearch clusters
- Great choice for small, medium, and enterprise size networks
- Vast amount of integrations, great for large networks utilizing numerous third-party applications
- Templates work extremely well out of the box, customization is possible but not always necessary
Cons:
- Could benefit from having a longer 30-day trial period
Datadog is worth considering if you’re looking for a solution to monitor Elasticsearch’s performance alongside other applications and services. Prices for the Infrastructure package start at $15 (£11.62) per host per month. The agent is available on Windows, macOS, and Linux. You can start the 14-day free trial.
EDITOR'S CHOICE
Datadog is our top pick for an Elasticsearch monitoring package because this system is able to monitor applications running on the cloud or on your own servers. So, it is able to monitor Elasticsearch wherever you run it from. The package can monitor all of the ELK stack and other supporting technologies and applications. The Datadog platform includes many modules and you can choose to combine many of them. The system also provides a Cloud SIEM for monitoring on-premises systems and cloud workload protection systems that will provide security monitoring for your cloud Elasticsearch system. The package can also monitor the activities of any systems that are based on Elasticsearch.
Download: Get a 14-Day Free Trial
OS: Cloud-based
2. ElasticHQ
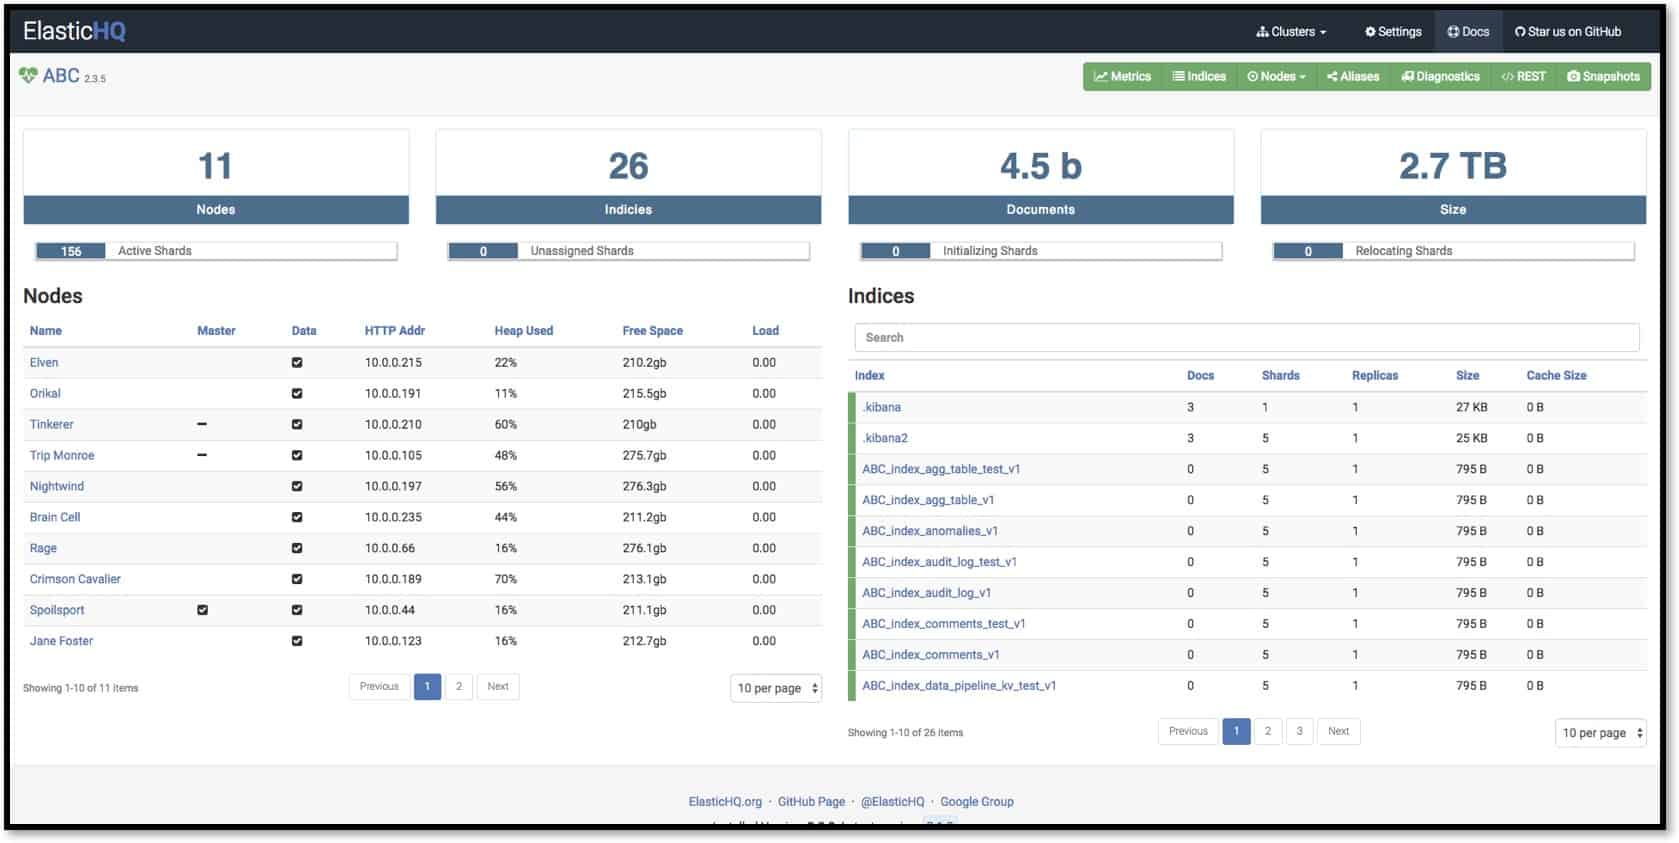
ElasticHQ is an open-source Elasticsearch monitoring tool that you can use to monitor cluster health in real-time. With ElasticHQ, you can monitor all of your clusters from a single location alongside analytics that you can use to drill-down to the index or node level so you can spot performance trends.
Key Features:
- Real-time cluster health monitoring
- Analytics
- Diagnostics recommendations
- JSON editor
- Indices management
Why do we recommend it?
ElasticHQ is a performance monitoring tool for Elasticsearch. However, if you are interested in a security service for the system, accessing ElasticHQ is still useful because it has a large user community that can provide tips, recommendations, and warnings. The package runs on Docker, which means it can be hosted over any operating system, even cloud platforms.
Based on performance metrics collected throughout your environment, ElasticHQ provides recommendations and hints on how you can optimize performance. There is also a JSON editor that you can use to query indices and aliases. You can interact with aliases in a number of ways including refreshing, optimizing, creating, and viewing them.
One of the biggest advantages of ElasticHQ is the vast user community that uses the software. You also have an API that gives you greater control over your experience with the program.
Who is it recommended for?
Any business that relies on Elasticsearch will benefit from installing ElasticHQ. One problem with the system is that it only monitors Elasticsearch, so you will still need another monitoring package to track your other systems.
Pros:
- Simple interface that is easily customizable
- Features metrics and monitors specifically for Elasticsearch
- Back-end API make a wide range of integrations possible
Cons:
- Open-source tools often rely on community bug fixes and support – not the best option for enterprises looking to move quickly
ElasticHQ is a great choice for enterprises looking for an open-source solution for monitoring the performance and availability of Elasticsearch clusters. Supports all versions of Elasticsearch, including 2.x, 5.x, and 6.x. You can download the software for free.
3. Dynatrace
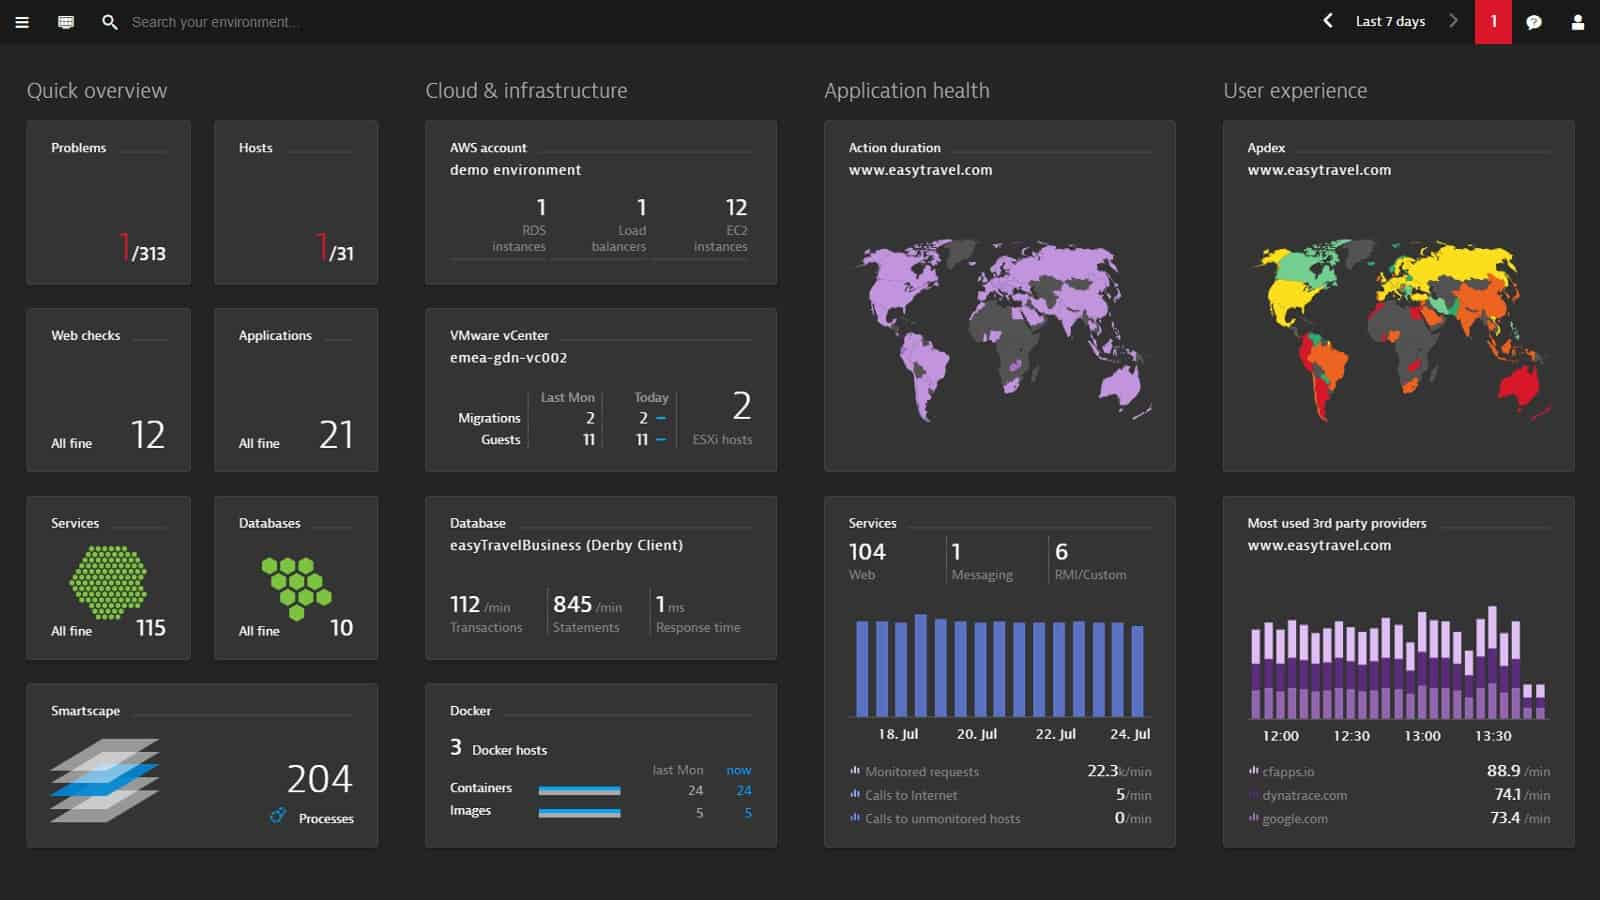
Dynatrace is an application performance monitoring tool with Elasticsearch monitoring capabilities. Dynatraceautomatically discovers individual clusters and collects metrics on Status, Active shards, Active primary shards, Replica shards, Relocating shards, Initializing shards, Unassigned shards, and more. You can also view node metrics such as Indexing total, Indexing time, Number of queries, Number of fetches, Number of scrolls, Total search time, Breakers, and Indices.
Key Features:
- Automatically discover individual clusters
- Anomaly detection
- Root cause analysis
- Custom alerts
Why do we recommend it?
Dynatrace is a complicated AI-based application monitoring system that offers an Application Security package as well. So, you can choose to secure your Elasticsearch implementations or take out the Full-stack Monitoring package as well and get performance monitoring alongside. While the security package constantly checks on configuration weaknesses, the performance monitor simultaneously checks on the activity of all of your IT assets.
AI-driven Anomaly detection and automatic root cause analysis help detect performance issues when they occur and sends you notifications to highlight the problem. The notification provides you with information on the root cause so that you don’t need to waste time finding out how the problem started
There are also customizable alerts, that you can use to set thresholds for metrics that the system will notify you about when they are crossed. A run-down of all alerts can be viewed in the Problems feed, which provides a record of all the latest security events that you need to know about.
Who is it recommended for?
Dynatrace is a good fit for any business but it is particularly strong at monitoring cloud-based systems. Small businesses won’t have a problem finding the budget to pay for either the security or performance monitoring system in Dynatrace because they are priced on data throughput.
Pros:
- Can automatically identify Elastic cluters and group them for monitoring
- Highly visual and customizable dashboards, excellent for enterprise NOCs
- Operates in the cloud, allowing it to be platform-independent
Cons:
- Designed specifically for large networks, smaller organizations may find the product overwhelming for their needs
Dynatrace is one of the top tools for monitoring Elasticsearch and other applications in one place. To view pricing information, you need to request a quote from the company directly. Available for Windows, Linux, iOS, and Android. You can start the 15-day free trial.
Contingency Plan: Backup your Data!
Unfortunately, even if you implement all of the measures above, a skilled hacker can still find a way to access your data. As a consequence, it’s important to regularly back up your data so that you will still have access to business-critical information if you fall victim to a cyber attack.
To back up your data, you can take snapshots of running Elasticsearch clusters. Taking a snapshot of a cluster will record all of its data streams and indices, though you can choose to limit snapshots to particular data streams. After taking a snapshot you can store the backup in a local or remote repository.
You can then store your collected data in a cloud service like Amazon S3, Microsoft Azure, or Google Cloud Storage so that you have a copy to restore from if the system becomes compromised.
Elasticsearch: Take Care Conclusion
Elasticsearch is an extremely valuable search and analytics engine that enterprises need to manage carefully.
Applying the best practices listed above and implementing continuous monitoring with performance monitoring tools like Datadog, ElasticHQ, and Dynatrace will make sure you can access your data freely without leaving the door open to opportunistic cybercriminals.

