AppDynamics and New Relic are two of the most widely adopted application performance monitoring (APM) platforms, used by organisations to observe, troubleshoot, and improve application performance in increasingly complex digital environments. As modern systems expand across cloud infrastructure, microservices, and hybrid architectures, maintaining visibility into how applications behave has become essential for ensuring reliability and preventing performance issues.
Both platforms deliver real-time insight into application health, highlighting errors, slow transactions, and performance bottlenecks as they occur. While they share this core purpose, they differ in philosophy, depth of configuration, and typical use cases, which often influences which type of organisation they are best suited for.
AppDynamics, now part of Cisco, is geared more towards large-scale enterprise environments where deep operational visibility is required. It focuses strongly on mapping business transactions end-to-end, combining application performance data with infrastructure and user experience insights. Its advanced analytics capabilities make it well-suited to complex systems where detailed diagnostics and business context are important.
New Relic, by comparison, takes a more streamlined and developer-oriented approach. It emphasises ease of adoption and broad observability across applications and infrastructure, with strong real-time monitoring and highly customisable dashboards. Its cloud-native design and flexible tooling make it particularly attractive to teams working in fast-moving DevOps or agile environments.
This comparison guide will explore how AppDynamics and New Relic differ across key areas such as features, pricing models, integrations, and overall usability, helping you decide which platform better fits your organisation’s monitoring strategy.
AppDynamics
Way back in 2008, AppDynamics was first launched by Jyoti Bansal; since then the company has become one of the most well-known network monitoring providers in the world. AppDynamics offers an application performance monitoring platform designed to help you monitor your application stack and your network infrastructure from top to bottom.
One of the things that makes AppDynamics special is its use of intelligent performance engines. These include:
- App iQ
- Microservices iQ
- Baseline iQ
- Diagnostic iQ
- Signal iQ
AppDynamics is a solution that is mainly aimed at larger companies. It has been very successful as an infrastructure monitoring solution with brands such as Cisco, Expedia, Nasdaq, and DirecTV using the product over the years.
New Relic
New Relic is another application performance monitoring solution that can be dated all the way back to 2006. This SaaS-based solution offers a range of infrastructure monitoring capabilities that allow users to assess the health of devices throughout their network. With New Relic, you can monitor on-premises, cloud-based, and hybrid installations so that you have transparency over the entirety of your network infrastructure.
There are a number of different New Relic products that you can use to structure your monitoring environment, including:
- New Relic APM
- New Relic Infrastructure
- New Relic Browser
- New Relic Mobile
- New Relic Synthetics
- New Relic Insights
New Relic has also had its run of success with larger names but hasn’t had the same traction with larger organizations as AppDynamics. New Relic is used by companies from Zendesk, Hearst, Office Depot, and Trulia.
AppDynamics vs New Relic Head-to-Head Comparison
| Feature | AppDynamics | New Relic |
|---|---|---|
| Installation | SaaS, on-premises or hybrid platform | SaaS |
| Custom Dashboards | Yes | Yes |
| Programming Languages | Java, .NET. PHP, Node.js, C++, Python, Go | Java, .NET, Mode.js, PHP,Python, Ruby, Go |
| Configurable Alerts | Yes | Yes |
| Reports | Yes | Yes |
| APIs | REST API | REST API |
| Plugins and Extensions | Over 130 extensions | Over 100 plugins |
| Third-party compatible | Amazon EC2, AWS EC2, AWS Elastic Cache Microsoft Azure ServiceBus, Postgre SQL database, Apache, Docker, IBM Websphere, Zabbix, Linux, Splunk, Citrix, and Oracle | Amazon EC2, Amazon Elastic Book Store, Amazon RDS, Amazon SQS, Oracle Database, MySQL, Citrix NetScaler, Microsoft Azure SQL, Database, Apache HTTPd, and Red Hat |
| Pricing | Contact sales team | Pro accounts start from $199 per month |
Application Monitoring
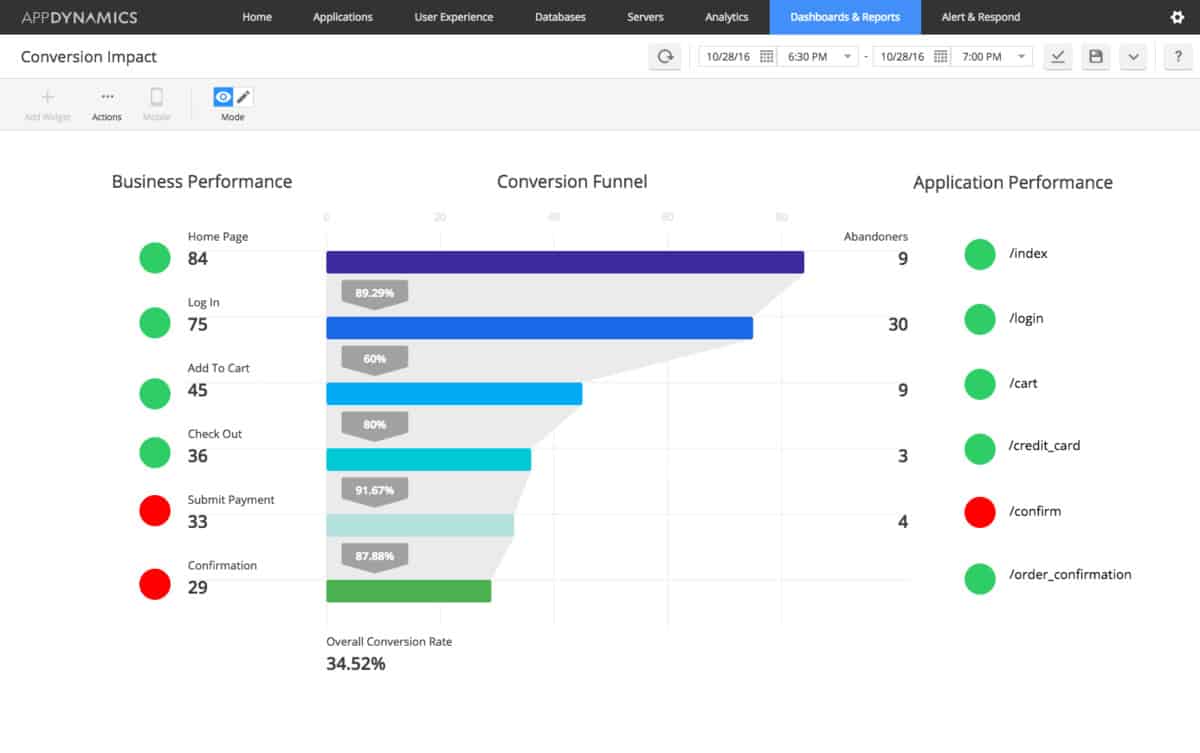 With the AppDynamics Application Performance Management (APM) solution you can monitor the performance of applications throughout your network. AppDynamics allows you to view business and application performance in real time. The status of connected devices and applications is color-coded so that you can see if there is a fault with a glance (you can see this clearly in the image above).
One area where AppDynamics really stands out from New Relic is autodiscovery. AppDynamics’ APM solution can automatically discover custom journeys through applications. This journey is mapped on a color-coded visual display. This autodiscovery registers actions like Add to Cart and displays it in a format so that you can see what is happening under the hood.
The autodiscovery feature is most useful for gaining transparency over the entire user journey. So if you’re looking to gain complete transparency over the end-to-end user journey then AppDynamics has a distinct advantage over New Relic. AppDynamics also offers code-level diagnostics that allow you to view the root cause of application faults and performance issues. This is invaluable for troubleshooting applications throughout your network.
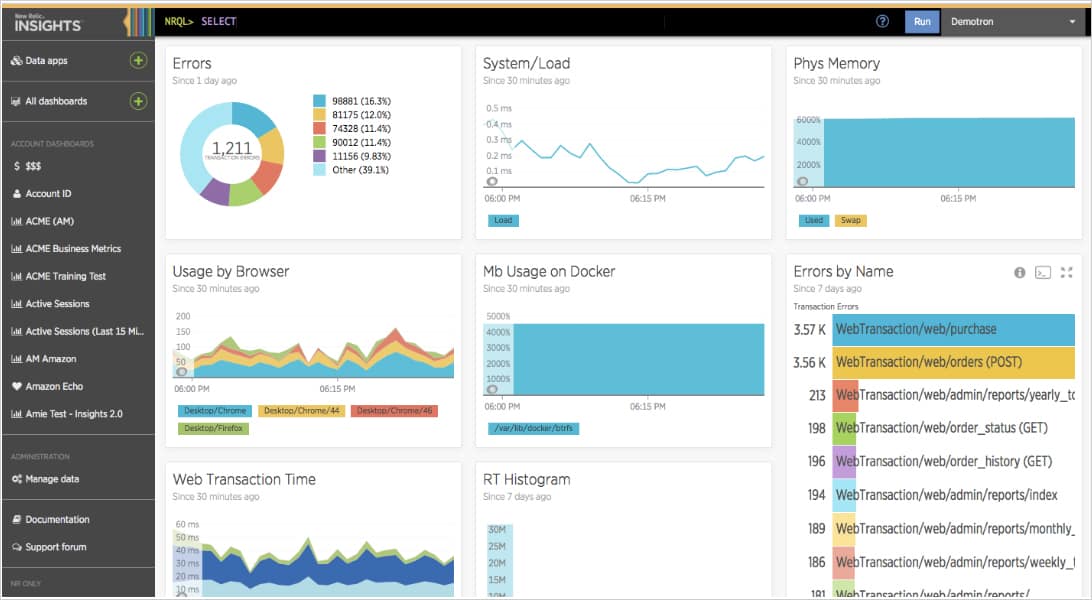
New Relic also provides an extensive application monitoring experience. With New Relic, you can view application response time, throughput, error rates, application histograms, transaction metrics, and service maps. Viewing application histograms allows you to view the response times of all connected applications. This is excellent because you can compare multiple applications at once to see if there are any pressing performance issues.
You can also monitor external services by viewing charts that show your top five external services based on response time and calls per minute. Similarly, there is a JVM performance analyzer which allows you to view information such as thread activity, HTTP session data, class load counts, unload counts, and connection pool metrics. These features allow you to tell if any problems are emerging so that you can head them off.
New Relic probably offers the simpler monitoring experience of the two but the depth of AppDynamics is unparalleled in the market. The autodiscovery feature delivers end-to-end visibility over all of your applications. If you’re serious about making the service as good for the end user as possible then AppDynamics is the better choice of the two products.
Database Monitoring
New Relic allows you to view database call response time and throughput, time spent in database calls, SQL query analysis, slow SQL reports, and database cache operations. One of the things that makes New Relic particularly easy to use is the ability to filter to a specific database. With AppDynamics you can view resource consumption, wait states, execution plans, SQL procedures, stored procedures, database objects, change events, user sessions, schema statistics, and execution plans.
AppDynamics supports an extensive range of database providers including Amazon RDS, MySQL, Oracle, Postgre SQL, SQL Server, Scalatra, Scala, Sybase ASE, Sybase IQ, Mongo DB, DB2, and Cassandra. In contrast, New Relic offers support for Oracle, MySQL, Microsoft SQL Server, Microsoft Azure SQL Database, Mongo DB, and Postgre SQL. You can find out more about getting a full list of plugins and installing them from this link here.
Installation
AppDynamics is available in a number of installation types and can be deployed as a SaaS platform, on-premises, or hybrid platform. On the other hand, New Relic is only available through SaaS. If you’re looking for flexible deployment options then AppDynamics is the product for you.
Custom dashboards
New Relic enables users to view a variety of performance metrics straight through the dashboard. To customize your experience you can drag and drop performance metrics into the dashboard. There is a range of performance metrics that is native to New Relic for you to choose from but you can also create your own metrics as well. You can choose the metrics you want to monitor and build your user experience around that.
The AppDynamics dashboard is also customizable. You can display metrics on application, server, and database performance. With AppDynamics, you can customize the experience by the user. For instance, if you wanted users to be able to view custom dashboards then you would configure their account with the Custom Dashboard Viewer role. There is a range of custom dashboard templates which you can use to build from in the beginning.
Custom dashboards are an area where AppDynamics and New Relic are completely even. They each offer the ability to create custom dashboards in a way that is accessible for new and experienced users.
Programming Languages
In terms of programming languages, both products have support for a range of common programming languages. AppDynamics supports the use of Java, .NET, PHP, Node.js, C++, Python, and Go. Likewise, New Relic offers support for Java, .NET, Mode.js, PHP, Python, Ruby, and Go. The two are on par in terms of support for programming languages.
Alerts
In larger networks, it is essential to have an alert system in place so that you can keep track of your application performance. Without alerts, it is easy to get left behind and miss key performance issues that can lead to downtime. AppDynamics and New Relic have recognized this and provided users with alerts and notifications so that they can keep up with current events.
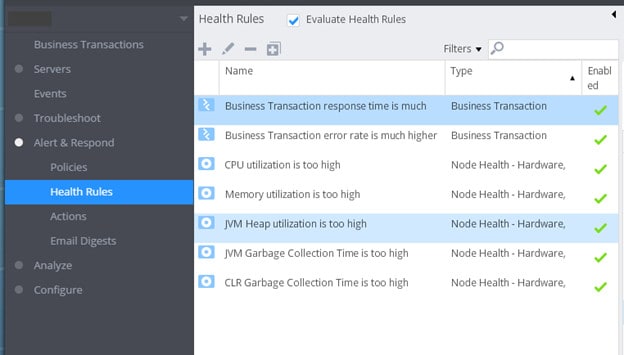
The AppDynamics alert system works by having the user create a set of Health Rules (shown above). Health Rules are essentially a list of trigger conditions for alerts. There are a number of these configured by default such as “CPU utilization is too high”. Out of the box, there is also a range of templates such as the Overall Application Performance template which monitors metrics like application load and response time.
When it comes to alerts on New Relic, one of the most useful things is availability alerts. New Relic uses a pinger to check the availability of applications by sending regular requests. If an application goes down then you are sent an alert to tell you that the service is offline. This allows you to step in and get the service back online asap.
With New Relic, you can configure your own alert policies. You can also define alert policies for different groups of applications as well as working with alerting channels such as HipChat, Jira, PagerDuty, and Campfire. Based on the range of configurations available, AppDynamics’ use of Health Rules provides a more customizable alerting feature than New Relic.
Reports
Reports provide you with the ability to reflect on your past usage data and give you the opportunity to pass on key information to other members of your team. Each of these providers includes full-featured reporting capabilities. With AppDynamics you can take data straight from the dashboard and transform it into a report. Types of reports include application health reports, dashboard reports, controller audit report, and home screen report.
You can create reports as you need them or you can schedule reports on a regular basis. Scheduling of reports is particularly useful because it allows you to check in on your performance data periodically. New Relic’s reporting capabilities allow you to create and receive customized reports. The type of reports you can generate include availability reports, host usage reports, capacity analysis reports, and scalability analysis reports.
In addition, New Relic has reports which allow you to create and view periodic SLA data on a daily, weekly, or monthly basis. All of these reports can be downloaded as .csv files. Based on simplicity alone, New Relic takes the win here because of the prepackaged report options available.
APIs
APIs have become one of the most common ways for network monitoring providers to allow users to build their own monitoring environments. AppDynamics and New Relic each have their own APIs so that users can arrange their network as they want it from head to toe.
However, AppDynamics doesn’t stop at extensions either; it also offers the use of a REST API. The REST API allows you to build custom applications and add-ons to customize your monitoring experience. Using APIs to pull application metrics and configure new applications are commonplace for users of AppDynamics.
New Relic also offers its own REST API that can be used to enhance the capabilities of the core monitoring platform. With New Relic’s APIs, you can retrieve data from New Relic products, insert your own data, and adjust configurations. Currently, you can use APIs to enhance alerts, APM, Browser, Infrastructure, Insights, Mobile, Plugins, and Synthetics.
For example, if you wanted to use APIs to improve your infrastructure monitoring you could use the Insights query API to pull subscription usage data. Likewise, you could use the Infrastructure alert API to manage how you receive alerts.
Plugins and Extensions
For a tailor-made monitoring experience, you’re almost certainly going to need the option to add extensions. This is something that both AppDynamics and New Relic have facilitated in one form or another. The AppDynamics Exchange is AppDynamics’ answer to extensions and allows users to build and request extensions as needed. Currently, there are over 130 extensions available to be downloaded for free.
These are incredibly useful for enhancing your monitoring experience. For example, if you were using a cloud service from Amazon, there are a number of extensions that you could make use of. The Amazon AWS SQS Monitoring Extension, AppDynamics Monitoring Extension for use with AWS EC2, AWS AutoScaling Monitoring Extension, and AWS EBS Monitoring Extension, all allow you to monitor AWS services.
New Relic also has its own plugins system for you to monitor your application stack. There are over 100 plugins available but you can also build your own. Plugins can be built from Ruby SDK, Java SDK, or through the use of APIs. All plugins can be found through the Plugin Central directory. In the Plugin Central Directory, you can search for plugins that have been published by other developers. Once you see a plugin that you like you can simply press the download button and install it.
Based on the simplicity of the plugin process and the integration offered by the Plugin Central Directory, New Relic offers the more accessible plugins features than AppDynamics. Though both products allow you to structure your monitoring environment as you please, New Relic has the advantage here.
Third-Party Compatibility
As modern networks have become more complex with more specialist third-party platforms and services it has become necessary to use network monitoring tools that can mesh with these. Integration with third-party products is often one of the only ways to gain transparency over a service. We’ve mentioned above that both AppDynamics and New Relic use plugins and extensions to get this done. In this section, we’re going to look more specifically at the services that each product is compatible with.
The AppDynamics Exchange library offers support for a range of third-party services and products, including; Amazon EC2, AWS EC2, AWS ElastiCache, Microsoft Azure ServiceBus, Postgre SQL, Apache, Docker, IBM Websphere, Zabbix, Linux, Splunk, Citrix, and Oracle. This provides you with a solid foundation for integration with other products.
In contrast, New Relic’s plugins include support for Amazon EC2, Amazon Elastic Block Store, Amazon RDS, Amazon SQS, Oracle Database, MySQL, Citrix NetScaler Microsoft Azure SQL Database, Apache HTTPd, and Red Hat Enterprise Linux to name a few. Based on the sheer breadth of providers offered, New Relic has a clear advantage here. The range of providers listed on the New Relic website is considerably wider than that offered with AppDynamics extensions.
Pros & Cons
AppDynamics
Pros:
- Tailored for large-scale enterprise use
- Excellent dependency mapping and visualizations to help troubleshoot complex application systems
- Includes a fully functional free version
Cons:
- Can have a steeper learning curve than similar tools
New Relic
Pros:
- Certified for Microsoft Azure monitoring
- Uses anomaly detection to highlight abnormal behavior in your environment
- Uses simple but intuitive admin dashboards
Cons:
- Better suited for small to medium-sized networks
Pricing
Pricing will be one of the features of key concern. No matter what budget constraints you have, New Relic has a distinct advantage for all but the largest organizations. New Relic is reportedly the more affordable option of the two, and the price of AppDynamics can leave it beyond the reach of many small-to-midsize organizations.
The price you’ll pay to use New Relic can be calculated on the New Relic website. The end cost will depend on a number of factors including your cloud service provider, instance size, instance runtime, and quantity of instances. Pro accounts for New Relic start at a price of $199 (£151) per month for each host. If you purchase this as a yearly plan then the price drops to $149 (£113).
On the other hand, you need to contact the sales team of AppDynamics in order to view the price for APM Pro, APM Advanced, or APM Peak. The price of AppDynamics is rumored to be $3,600 (£2,737) per unit per year.
It is worth noting that New Relic offers a range of pricing options based on the type of platform you want to deploy. You can choose between New Relic APM, New Relic Infrastructure, New Relic Browser, New Relic Synthetics, New Relic Mobile, and New Relic Insights.
AppDynamics vs New Relic: The Verdict
Given the breadth of features offered by each product, it is undeniable that both are top-notch tools in almost any environment. However, if you have the budget to facilitate it, then we recommend going with AppDynamics. The depth of its application monitoring abilities, autodiscovery capabilities, and extensions give it the advantage over New Relic.
However, if you’re looking for a product that is more straightforward and a little less complex then you should go for New Relic instead. The user interface is intuitive and you’ll be able to run sophisticated application management without breaking the bank. You still have a REST API and you still have the ability to expand on the core program with plugins.
Ultimately your choice of application monitoring solution will depend on your environment. Larger environments managing lots of applications lend better to AppDynamics than New Relic (as showcased by their traction with larger companies!). In contrast, New Relic is better for those mid-to-large organizations that haven’t quite reached their peak size.
