As more organisations move their workloads to the cloud, keeping track of performance, security, and costs becomes increasingly important. Microsoft Azure offers a wide range of services, but the scale and complexity of these environments can make effective monitoring a challenge without the right tools in place.
Here is our list of the best Azure monitoring tools:
- Turbo360 EDITOR’S CHOICE This cloud-based platform provides an innovative method to unify the monitoring of different Azure services, including combinations with services on other platforms. Start a 15-day free trial.
- Progress WhatsUp Gold (FREE TRIAL) A powerful monitoring tool that offers contextual information about Azure usage for better control and visibility. Start a 30-day free trial.
- ManageEngine ADAudit Plus (FREE TRIAL) This software package provides security monitoring based on Active Directory, including change logging for AD. Available for Windows Server, AWS, and Azure. Start a 30-day free trial.
- Site24x7 Infrastructure (FREE TRIAL) A cloud-based monitor for resources located on-site and in the cloud that is able to monitor a range of Azure services. Start a 30-day free trial.
- ManageEngine Applications Manager (FREE TRIAL) This software monitors servers and cloud platforms as well as applications, and Azure is on the list of those systems. Runs on Windows Server, Linux, AWS, and Azure. Start a 30-day free trial.
- Paessler PRTG (FREE TRIAL) Azure monitoring available from this package of monitoring services that can supervise on-premises and cloud-based networks, servers, and applications. It installs on Windows Server. Register for a 30-day free trial.
- Dynatrace A cloud-based infrastructure monitoring system that deploys AI processes to track the performance of Azure services as well as other resources.
- SolarWinds Server & Application Monitor A bundle of monitoring systems that will monitor the performance of servers whether they be on-site or in the cloud and also cover the applications that run on them.
- Opsview A monitoring system that covers servers and applications. It includes on-premises resource supervision and cloud services monitoring, such as Azure systems. It installs on Linux or is available as a cloud-based service.
- Elastic Cloud Observability This cloud platform provides a hosted version of the Elastic Stack and includes pre-written system monitoring services for Azure, other cloud platforms, and on-premises assets.
In this guide, we explore some of the best Azure monitoring tools available for gaining visibility into cloud infrastructure. These solutions provide real-time insights into system health, performance, and availability, helping teams detect issues early and respond before they impact operations.
The tools covered span multiple areas, including network monitoring, application performance monitoring (APM), security oversight, and cost tracking. Each option is evaluated based on its features, benefits, pricing, and integration capabilities, making it easier to compare solutions and choose the right fit.
Whether supporting a small deployment or a large-scale enterprise environment, selecting the right monitoring tool is key to maintaining a secure, efficient, and well-optimised Azure setup.
The best Azure monitoring tools
When we decided to look into the best monitoring systems for Azure, we needed to identify systems that are able to track the performance of a wide range of services from servers and virtualizations, through to application and serverless microservices.
Many businesses mix their systems, creating a hybrid combination of on-site and cloud-based components. So, systems that can monitor that blend of locations and formats are particularly interesting to us.
Our methodology for selecting an Azure monitoring system
We reviewed the market for Azure monitoring tools and analyzed the options based on the following criteria:
- The ability to extract data from the native reporting functions in the Azure platform
- Systems that can implement infrastructure and application monitoring
- Alerts for performance problems
- Notifications by email or SMS when alerts are raised
- Application dependency mapping
- A free trial or a demo system to allow a system appraisal before committing to buy
- Value for money, represented by a reliable monitoring system that is supplied at a reasonable price
Using this set of criteria, we looked for Azure monitoring systems that can automate many system supervision tasks, thus freeing up technicians for other tasks.
1. Turbo360 (FREE TRIAL)

Turbo360 (formerly Serverless360) offers three modules on its cloud platform that make managing Azure services a lot easier. These are Business Applications, Business Activity Monitoring, and Azure Documenter. Each unit is a separate subscription service, but they work best when deployed in unison.
Key Features:
- Specializes in Azure: No functions for other platforms crowding the dashboard
- Application Dependency Mapping: Records the connections between services
- Creates Virtual Applications: Define a group of services that operate as a single service and monitor them as a unit
- Monitors Applications on Azure: Includes platform services, Marketplace systems, and the software that you run on your virtual server account
- Audits Azure Accounts: Helps with cost control
Why do we recommend it?
Turbo360 is a cloud platform of Azure management and monitoring services. The Azure Documenter can be run overnight to get a clear list of your entire Azure asset list. This will reveal how much your facilities are costing and help you to right-size your accounts. Define bundles of services as virtual applications and monitor them together.
Each Azure service is a separate entity. However, they are rarely used in isolation. Native monitoring systems on the Azure platform keep performance tracking separate for each service. This doesn’t help customers because it makes root-cause analysis of performance issues very difficult. The Turbo360 strategy virtualizes Azure services so that they can be analyzed with the business context as applications.
As the platform’s name suggests, Turbo360 is particularly good at tracking microservices, which are termed “serverless.” A serverless system exists to provide functions through APIs, development environments, and plug-ins, which make the creation of Web applications and mobile apps a lot faster. However, when those finished products run, bits of the systems will be hosted God-knows-where.
The Business Applications module of Turbo360 threads together all of the contributing services in a business context so it is easier to track the performance of the whole. The system is designed to monitor Azure services along with operational capabilities to resolve issues without switching between tabs.
Once a business application has been defined to contain all of the separate Azure services that contribute to its execution, the Turbo360 platform will treat this unit as an entity. It will implement live monitoring of the health, availability and performance from the reporting systems, also notifies the stakeholders proactively with the warning threshold values.

To get that functional end-to-end monitoring, you need to subscribe to the Turbo360 Business Activity Monitoring package. This operates as a typical IT monitoring system with alerts for out-of-band business exceptions and slow or stalled execution.
Azure Documenter brings visibility and insights into live Azure subscription data to help you lower costs, maintain security and compliance, and optimize resources.
You can also use Turbo360 in the private hosting model where its instance will be hosted in customer’s Azure infrastructure.
Who is it recommended for?
This service helps businesses define applications, which are probably each using part of the capacity of each of your service subscriptions on Azure. This cost allocation model is particularly useful for the providers of Web applications and SaaS platform providers because it enables a cost per app to be calculated.
Pros:
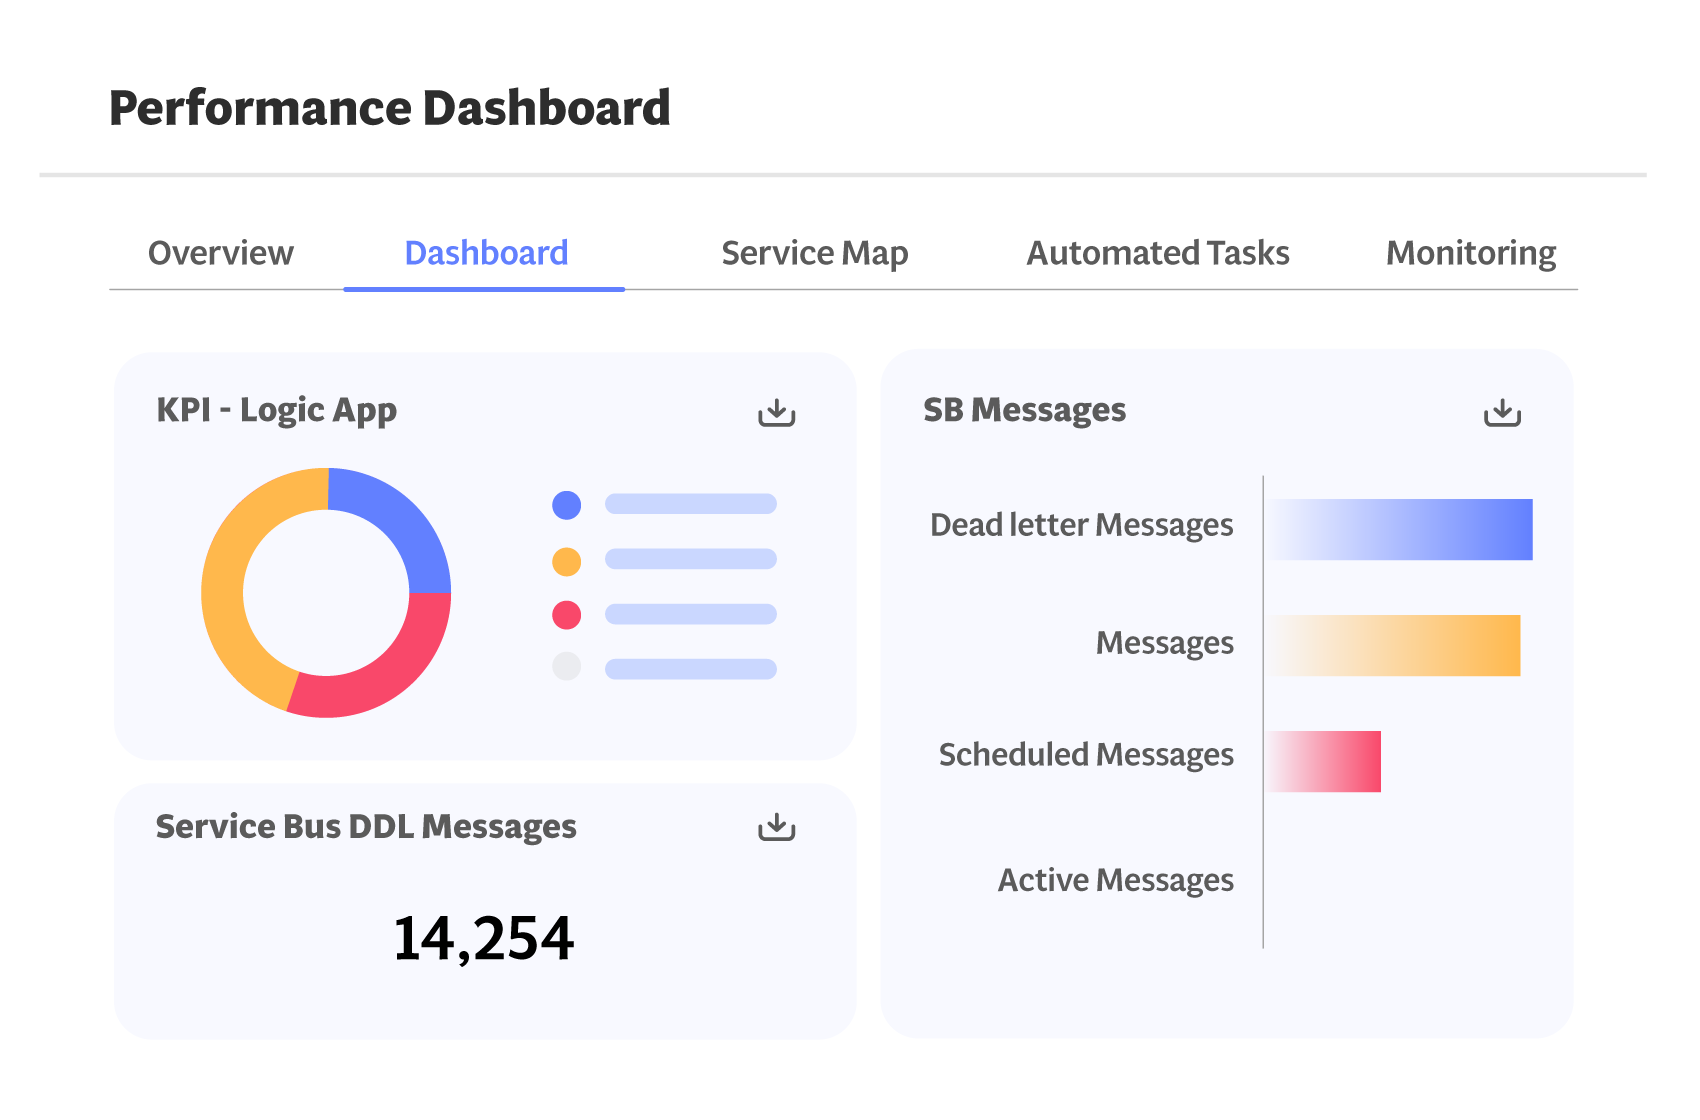
- Attractive Dashboard: Data visualizations make statuses easy to understand
- Flexible Subscription Options: Suitable for any size Azure environment
- Application Monitoring and Management: Designed to audit, monitor, and report on Azure applications
- Live System Scanning: Constantly revises application dependency maps
- Automated Responses: Can send alerts or trigger workloads
Cons:
- Can’t Cope with Cross-Platform Systems: Won’t track activities on AWS or GCP
As well as offering its own SaaS platform, Turbo360 makes its three modules available right out of the box without installing any agents and instrumentation. Pricing starts at $150 per month for the Business Application monitoring, $300 per month for the Business Activity Monitoring package, and the Azure Documenter starts at just $49 per month – all billed annually. You can check out the free demo to assess all three Turbo360 modules. You could also start a 15-day free trial.
EDITOR'S CHOICE
Turbo360 is our top pick for an Azure monitoring tool because it offers a way to unify the monitoring of Azure services where they contribute to a single application. Instead of tracking each service independently, Turbo360 creates a virtual entity that can be monitored as a whole and also as a string of internal modules. This is a unique monitoring system that puts Azure services into a context and makes root cause analysis for performance issues a easier and faster task.
Download: Start a 15-day FREE Trial
Official Site: turbo360.com/signup
OS: SaaS, Azure service, or virtual appliance
2. Progress WhatsUp Gold (FREE TRIAL)

WhatsUp Gold monitors your Azure usage to pinpoint gaps in spending and security. It gathers metrics from Azure and analyzes them to identify unused and underused resources, potential security gaps, and spending.
Key Features:
- Network Map: Identifies every resource on your Azure environment and creates a map of its dependencies.
- Issue Detection: Detects issues in Azure for quick remediation.
- In-depth Monitoring: Analyzes every metric on Azure to provide detailed insights on performance.
- Reports: Generates extensive reports for informed decision-making.
- Dashboards: Comes with well-developed and intuitive dashboards.
Why do we recommend it?
WhatsUp Gold is a good choice for monitoring Azure environments because it provides detailed visibility into the performance and usage of Azure. It gathers metrics from Microsoft and analyzes them to identify any network issues, underused or unused resources, and wasteful spending. Using this information, you can optimize your spending to get better value from the environment. Also, these insights are displayed on an intuitive dashboard for easy understanding. It even generates reports for easy sharing and communication.
Another highlight of this tool is its alerts. You can set up custom alerts that will inform you when spending is likely to exceed your budgets. Accordingly, you can scale back usage or increase your budgets. You can even choose to get these alerts through email, SMS, Slack, or log files.
Who is it recommended for?
It is a good choice for organizations that extensively use the Azure environment and need better insights into their spending and usage. It can also work for MSPs who are responsible for optimizing their clients’ networks.
Pros:
- Fast Diagnosis: Identifies the root cause for faster diagnosis.
- Monitor Costs: Comprehensive visibility into spending.
- Resource Usage: Optimizes the usage of your resources by eliminating wasteful spending.
- Integration: Provides insights from the perspective of your environment, and not just Azure.
Cons:
- Expensive: Can be expensive for smaller teams.
WhatsUp Gold offers two plans – Premium and Total Plus. Start a 30-day free trial.
3. ManageEngine ADAudit Plus (FREE TRIAL)

ManageEngine ADAudit Plus is a security system that not only protects Active Directory instances from tampering but tracks activity on your servers and implements file integrity monitoring. This package aims to prevent insider threats and account takeovers from causing damage to your business’s data and reputation.
Key Features:
- Records Changes in AD: On-premises Active Directory and Azure AD
- Alerts for AD Object Updates: Enables changes to be reversed
- Tracks User Activity: Looks for insider threats
- Compliance Auditing: Suitable for GDPR
Why do we recommend it?
ManageEngine ADAudit Plus is a user activity tracking service that also identifies changes to Active Directory structures. You can use this service to protect files, spot insider threats, and also to prevent and identify account takeovers. This system is able ot work with Azure AD as well as on-premises AD instances.
You would need ADAudit Plus for security monitoring but businesses that need to show compliance with a data protection system can’t avoid implementing this tool or one like it. It is important that you can show that your system is able to identify the origin of changes to data, which might be malicious. Logs for these actions help you roll back unauthorized data tampering and prove that you are on top of this issue.
The ManageEngine system is available for installation on Windows Server and it can also be taken as a service on AWS or Azure. ManageEngine offers three editions of this system. The first of these is Free. That version is limited to monitoring 25 workstations, which is great for small businesses. The Standard edition is able to monitor activity on servers and the Professional edition is where you will find Active Directory change tracking.
Who is it recommended for?
There is a Free edition available that will protect 25 workstations. However, its log scanning and AD management functions are limited in this version. The Standard edition lets you access Azure AD and it is reasonably priced. Businesses with bigger budgets can get the higher edition for AD auditing and change rollbacks.
Pros:
- Login Activity: Notes failed logins
- File Integrity Monitoring: Logs changes in files designated for protection
- Monitors Workstations and Servers: On-premises endpoints
- Manage Groups and Roles: In Azure AD
Cons:
- This isn’t a SaaS Platform: Available as a software package that runs on Windows Server, AWS, or Azure
ManageEngine offers the Professional edition for a 30-day free trial.
4. Site24x7 Infrastructure (FREE TRIAL)

Site24x7 is a cloud-based system that is able to monitor on-premises and cloud-based resources. Among its capabilities is the ability to monitor virtual systems, such as hypervisors and virtual servers.
Key Features:
- Cloud-Based SaaS Platform: Includes multiple modules
- Azure Integration: An add-on service
- Performance Alerts: For resource shortages and software errors
Why do we recommend it?
Site24x7 Infrastructure looks after all of the assets in your environment from server resources to the systems that lie behind your client-facing software. This includes both on-premises servers and cloud platforms. The tool is tuned for Azure monitoring and it can also watch activities on AWS and Google Cloud Platform.
The Site24x7 system can be expanded by product-specific integrations. These add extra probes and screens to the monitoring system. Rather than offering a single integration for Azure, Site24x7 offers a list of specialist module monitors for each Azure service.
With the Site24x7 monitoring system fully loaded with its Azure integrations, you can combine these cloud monitors with any other infrastructure of your company based anywhere in the world. Each system requires an agent installed on it.
The dashboard for Site24x7 Infrastructure is delivered from the cloud and it can be accessed from anywhere through any standard Web browser. The screens in the console can all be customized with a drag-and-drop assembly system.
This is a particularly interesting monitoring proposal for businesses that operate a virtual office. It can tie together staff working remotely with Azure services and monitor the whole collection together. Whatever resources you have and wherever they are, Site24x7 Infrastructure creates a map of dependencies between applications, services, and server resources. It can show how your Azure services interact with each other and with your resources based on other platforms. This plan lays down the pathways for root cause analysis when performance drops.
Who is it recommended for?
This package is sied to be accessible to small businesses. Site24x7 bundles all of its core modules together into each plan, which means you also get network and application monitoring in with the Infrastructure module. Larger enterprises pay a supplement for more capacity and there is an edition for MSPs.
Pros:
- Full Stack Observability: Provides monitoring systems for networks, servers, services, cloud platforms, and software
- Plans Sized for Small Businesses: Larger businesses pay for extra capacity
- Automated Fault Resolution: Access scripts that will be triggered by a specific event and fix the problems described in the alert
Cons:
- All-Encompassing Plans: All plans provide access to all modules on the platform – you can’t subscribe to just one unit
Site24x7 Infrastructure is charged for on a monthly subscription and you can access it on a 30-day free trial.
5. ManageEngine Applications Manager (FREE TRIAL)

ManageEngine Applications Manager monitors the platforms that support applications as well as the applications themselves. The package is able to monitor on-premises servers running Windows Server and Linux and also cloud platforms running Azure, AWS, Google Cloud Platform, and Oracle Cloud.
Key Features:
- Live Azure Activity Monitoring: Tracks the performance of the platform, servers, and software on the system
- Measures Service Usage: Tracks the consumption of Azure services
- Web Application Monitoring: Synthetic and real-user monitoring methods
Why do we recommend it?
ManageEngine Application Manager covers servers and services as well as applications. This is a hybrid system because it also tracks cloud services. The package can interface with Azure to extract performance metrics and it also has integrations with AWS, Google Cloud Platform, and Oracle Cloud. It plots an application dependency map.
Features in the Applications Manager package include a discovery service that maps applications, their modules, services, and resource support. That server resource monitoring extends to platforms, such as Azure. The tool extracts activity data from Azure’s native reporting service and integrates them into its calculation of root cause analysis.
The dependency mapping identifies essential resources and implements requirements thresholds on all of the metrics that the system gathers. If one of those levels gets crossed, Applications Manager raises an alert. The thresholds kick in before full capacity is hit, which gives you time to take evasive action before shortages create performance impairment.
Those alert conditions can be customized and it is also possible to replan the screens of the service or set up your own by allocating widgets to show a data set in different formats, such as tables, charts, or dials. Alerts can be sent by SMS, Slack message, push notification, voice message, or email. It is also possible to channel them through your Service Desk ticketing system.
Azure isn’t the only Microsoft system that Applications Manager can monitor. It is able to track activities and performance in a long list of products, including IIS, Exchange Server, Microsoft 365, Microsoft Dynamics, and Active Directory.
Who is it recommended for?
This system lets you track five assets at no cost with the Free edition. Thie service’s paid packages are reasonably priced for small businesses but that base plan doesn’t give enough capacity for large enterprises. However, it can be expanded for a fee. There is also a multi-site version for remote monitoring.
Pros:
- Application Dependency Mapping: Discovers applications and connects them to supporting services
- Troubleshooting Tools: Supports investigations into Azure performance problems
- Alerts Can Trigger Fault Remediation: Automated response workflows
- Log Monitoring: Provides opportunities for manual performance analysis
Cons:
- Not a SaaS Package: A software package for Windows Server, Linux, AWS, and Azure
ManageEngine Applications Manager has a free edition. There are also two paid editions – Professional for a single network, and Enterprise for multi-site implementations. The software for the package installs on Windows Server or Linux or you can get the system as a service on AWS and Azure. Access one of the two paid versions on a 30-day free trial. If you decide not to buy at the end of the trial period, your implementation switches over to the free version.
6. Paessler PRTG (FREE TRIAL)

Paessler PRTG is a collection of resource monitors. Each customer gets the full package but customizes the system by deciding which monitors to turn on. The price for the service depends on the number of monitoring credits that you buy.
Key Features:
- Full-Stack Observability: Networks, applications, and servers
- Cloud and On-Premises Monitoring: AWS, and Azure
- Free Edition: Allows the use of 100 sensors free of charge
Why do we recommend it?
Paessler PRTG is a package of monitors and it includes Azure monitoring sensors. The Azure tracking system in the bundle includes a cost-tracking function that helps you identify service accounts on Azure to help you prevent them getting from out of control. This is a necessary service for any business that uses Azure.
PRTG monitors Azure in conjunction with another system, called Martello iQ. The monitoring system relies on sensors provided by another partner, called AutomonX. In total, the system provides 18 different monitors for Azure services. The dashboard shows an overview of all of your Azure services, allowing a drill down through to detail pages for each service. All of the screens for Azure monitoring include color-coded graphics that make statuses very easy to identify.
The Azure monitoring service includes performance thresholds and alerts to automate monitoring. As well as monitoring Azures services, PRTG can supervise other resources related to networks, services, and applications. This enables you to monitor all of your infrastructure from one console.
Who is it recommended for?
PRTG is free if you only activate 100 of the sensors contained in the software bundle. That is more than enough if you only want to use the system for Azure monitoring. The system runs on Windows Server and there is also the option to access it as a SaaS package.
Pros:
- Customizable Dashboard: Drag and drop editor to assemble screens and reports
- Performance Alerts: Pre-written conditions and opportunities to create new alerts
- Alert Notifications: Can be forwarded by email, SMS, push notifications, Teams, or Slack
Cons:
- Monitoring Only: Doesn’t provide workloads for problem resolution
PRTG installs on Windows Server and you can get it on a 30-day free trial.
7. Dynatrace

Dynatrace is an application and cloud services monitoring system that integrates innovative AI processes into its platform. Azure services are included in the monitoring capabilities of this service.
Key Features:
- Cloud-Based: A SaaS package or a service on Azure
- AI Processes: Used for constructing application dependency maps
- Root Cause Analysis: Relies on the dependency maps
Why do we recommend it?
Dynatrace is a monitoring package for hybrid systems. It is a lot stronger at monitoring cloud services than on-premises assets. The cloud platforms that this tool can extract live metrics from include Azure, Google Cloud Platform, and AWS. It is also able to monitor Docker and Kubernetes.
The Dynatrace system starts its service by exploring your Azure accounts. It can also extend its tracking to the services of other cloud platforms and applications hosted on your own servers. This exploration results in an application dependency map.
With the dependency map in place, the Dynatrace system is in a good position to support root cause analysis once performance issues are detected by the constant status monitoring services of the package.
The Dynatrace system is cloud-based and it integrates machine learning in a performance assessment algorithm. That performance expectation fine-tuning makes this system a winner. Some monitoring services preset thresholds for the average business and that means most system administrators have to spend weeks adjusting those levels until they find the right point. The Dynatrace system performs all of those adjustments autonomously.
So, two key AI-driven features give Dynatrace its edge. Those are speedy problem resolution thanks to its application dependency mapping and accurate performance assessment thanks to machine learning applied to alert thresholds. One issue that some might have Dynatrace is that its visibility ends with the server. It doesn’t have any solutions for network problems. However, that is an issue for on-premises monitoring, and for Azure monitoring; the network isn’t a priority.
Who is it recommended for?
The audience for the Dynatrace system depends on which modules are under consideration. The Infrastructure Monitoring package gives you cloud platform performance tracking and it will also monitor all of the services on that system. Dynatrace has an unusual hourly charge rate per host.
Pros:
- Supports All of the Major Cloud Platforms: AWS, Azure, and Google Cloud Platform
- Predictive Alerts: Forecasts upcoming resource demand and compares that to availability
- DevSecOps Automation: Security scanning
Cons:
- The Free Edition is No Longer Available: There is free trial, though
Dynatrace is a subscription service charged at a rate per month. There is no deposit required and no minimum service period. You can get a 15-day free trial to assess the system for yourself.
8. SolarWinds Server & Application Monitor

SolarWinds Server & Application Monitor has all of the capabilities needed to monitor the wide range of services offered by Azure. Not only that but it can also integrate Azure monitoring into the supervision of on-site servers running Windows Server or Linux and the applications that they host.
Key Features:
- Automated Monitoring: On-premises software and servers plus cloud platforms including Azure
- Application Dependency Mapping: Connects running processes to spawned processes and platform services
- Performance Alerts: Identifies slow-running software or resource shortages
Why do we recommend it?
SolarWinds Server & Application Monitor is an on-premises package for Windows Server. However, it is able to monitor cloud platforms, such as Azure, AWS, and Rackspace, and the software and services that run on them as well as in-house hosted systems. The system can also monitor SaaS packages, such as Microsoft 365.
Azure-hosted databases, AD, and other applications plus virtual infrastructure can all be included in this monitoring service. The dashboard of the monitor collects all of the Azure systems on one screen. This leads to detailed information on each service. Relevant metrics, such as response times, capacity, throughput, and connectivity are all tracked. The system places thresholds of acceptable performance on each metric and then constantly adjusts those levels according to patterns of usage.
The SolarWinds system will raise an alert if a threshold is crossed. This shows on the dashboard of the service and can also be forwarded as a notification by email or SMS. This alerting mechanism automates monitoring because you don’t need to put a member of staff watching statuses to spot when things go wrong. This frees up staff for other tasks. A notification will arrive in time to allow you to make system adjustments and prevent problems from becoming critical.
The SolarWinds Server and Applications Monitor is particularly strong at monitoring Microsoft products, including SQL Server, Microsoft 365, and Exchange Server. Features in the monitor include demand trend analysis and application dependency mappings. If you run virtualizations, it can also get inside those and map their structures as well.
Who is it recommended for?
This system is particularly useful for businesses that run applications across platforms. It is able to discover, map, and monitor systems that interact with each other, identifying application dependencies. For example, if an on-premises application accesses Azure-based services, the tool will flow its monitoring processes along that chain.
Pros:
- Live Scanning: Application activity tracking occurs constantly
- Customizable System: Access an integrations library, create custom alerts, or modify the dashboard if you want to
- Reporting System: Provides a library of pre-configured report templates
Cons:
- Not Available on the Cloud: This is a software package for Windows Server
The SolarWinds Server & Application Monitor is implemented as on-premises software that installs on Windows Server. You can access it on a 30-day free trial.
9. Opsview
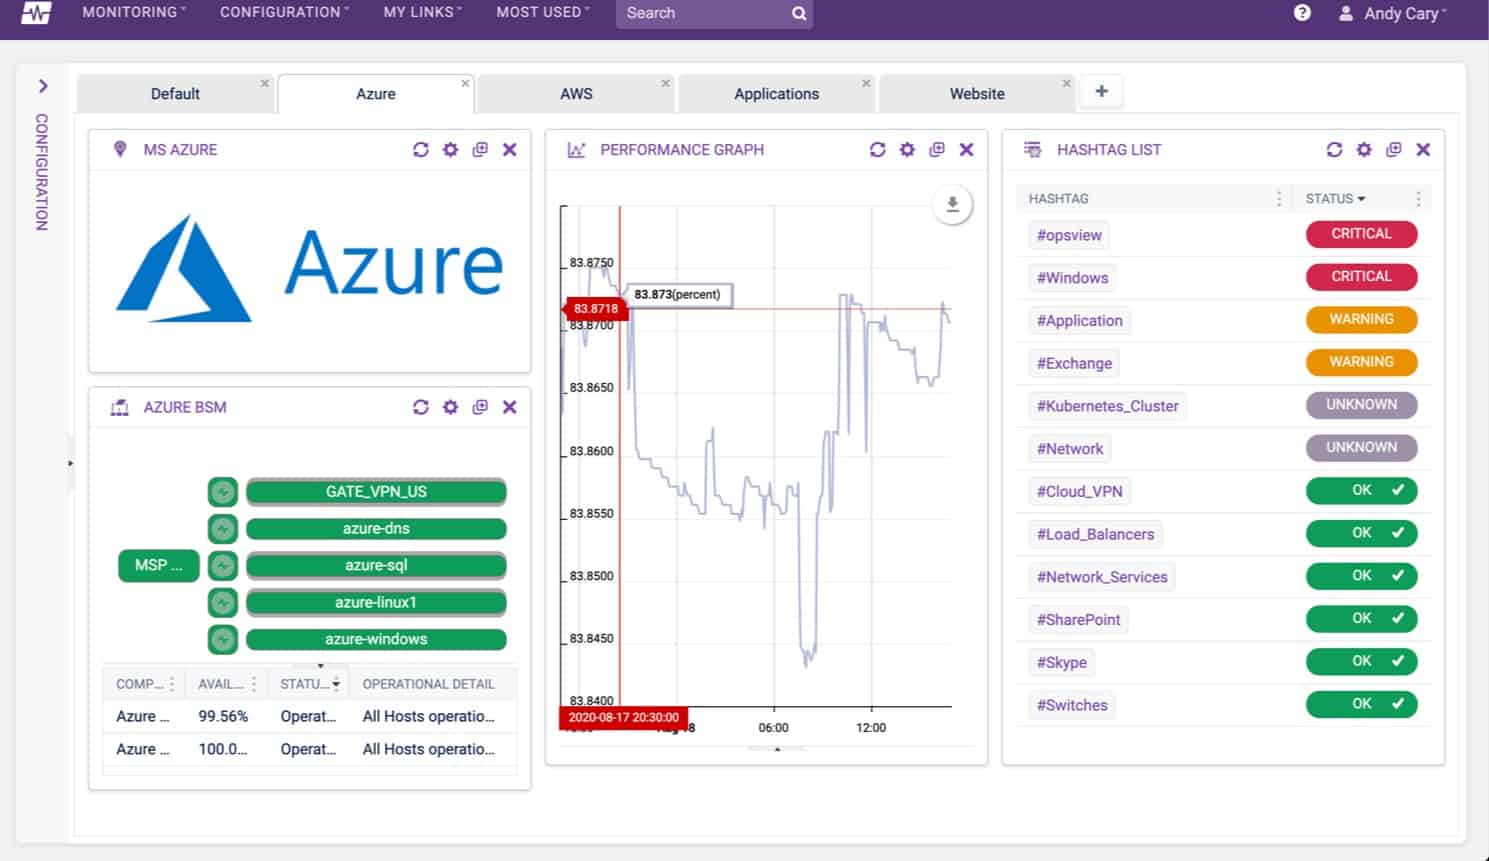
Opsview is able to present a single view of hybrid systems, monitoring resources anywhere, including Azure services. It is able to show performance metrics and availability statistics for all of your Azure subscriptions.
Key Features:
- Deployment Options: SaaS package or Linux install
- Application Dependency Mapping: Speeds up root cause analysis
- Expandable System: Provides plug-ins, called Opspacks, and also accepts Nagios plug-ins
Why do we recommend it?
Opsview is very similar to Dynatrace Infrastructure monitoring. Both are good for monitoring hybrid environments and both offer monitoring for Azure, AWS, and GooOpsview is much stronger at monitoring on-premises assets and it includes a comprehensive network monitoring service. This system can be expensed by Nagios plugins, which are free.
A nice presentational feature of Opsview is that it can be cast onto large screens around the operations center, creating a buzz of efficiency around the operations team. That looks very impressive when you are giving clients a tour.
Opsview has special procedures for monitoring websites and Web services and it can trace application dependencies through to the host services – that includes Azure resources. The Opsview tracing system isn’t restricted to just one platform – it will chain back and identify application dependencies regardless of where each service is resident.
Beneath your services and applications, Opsview has infrastructure monitoring capabilities that can accurately track virtualizations, monitoring each server and its dependent virtual machines. This service is particularly designed to monitor internet-connected services, so it tracks response times point-to-point rather than examining hops on networks.
Who is it recommended for?
Opsview appeals to many different markets through its multiple deployment options. The system is available as a SaaS package on the cloud and it can also be downloaded onto Linux. Opsview produces an edition for SMBs and there is also a multi-tenant option for managed service providers.
Pros:
- Cloud Platform Monitoring: AWS, Azure, and GCP
- SaaS Package Monitoring: Includes monitoring for Salesforce and Microsoft 365
- Azure App Services Monitoring: Metrics include the number of requests, response time, and data movement volumes
Cons:
- Difficult to Choose the Right Platform: You might have resources on premises and in the cloud, so which location to host the monitoring package is best?
Opsview is available in three editions. The SMB plan is for small businesses and the Enterprise plan is tailored to large organizations. Both of those packages are for on-premises installation on Linux servers. There is also the Opsview Cloud plan, which is hosted. You can get a demo of the cloud service.
10. Elastic Cloud Observability

Elastic Cloud is a hosted implementation of the Elastic Stack (ELK). Not only do you get to use the ELK components to build your own data management systems, but you can use the pre-written performance and security monitoring systems that are built into the package. The service includes Azure monitoring.
Key Features:
- Includes the ELK Stack Tools: Hosted on the Elasticsearch cloud servers
- Automated Monitoring: Includes monitoring for Azure
- Full Stack Observability: Performance and security monitoring
Why do we recommend it?
Elastic Cloud Observability has a great heritage. The ELK tools are now very widely used individually for data searches and results representation with Elasticsearch and Kibana. You can use these tools by themselves if you want. However, the Observability package is included in the price and they track Azure performance.
The Azure monitoring service in the Observability package extracts platform activity data and also interacts with the services that you run on the Azure system, such as databases. You can link together the monitoring of many applications and services to get root cause analysis when things go wrong.
Each metric that the Elastic Cloud system tracks can have a performance expectation threshold defined on it. If this level is crossed, the service generates an alert. Look through the alerts in the dashboards and you will see which component triggered first. Thus, it is easy to discover the real cause of the problems that arise in your user-facing systems.
Who is it recommended for?
All of the ELK elements are available for self-hosting for free. That free option is going to appeal to small businesses. They won’t get the observability system that way but small enterprises probably wouldn’t be comfortable with the price of an Elastic Cloud subscription. Mid-sized businesses would benefit most from this tool.
Pros:
- Pre-Written Screens: You can customize screens or create your own with Kibana
- Cloud Storage for Metrics Included: A full SaaS package
- Alerts for Performance Issues: Also alerts for resource shortages
Cons:
- No Free Edition: However, you can download the ELK components for free and write your own system
Elastic Cloud is offered in four plans and you need to opt for the Standard or Platinum plan to get Azure monitoring with the Observability package. You can get any plan on a 14-day free trial.
Azure monitoring tools FAQs
What is monitoring tools in Azure?
Azure monitoring covers two levels of performance monitoring. First, you need to monitor Azure services, such as processors, databases, or applications. You also need to watch over any software that you choose to host on the Aure platform.
How do I monitor resources in Azure?
Azure resource monitoring is greatly aided by log collection. There is a log generation function within the Azure platform but it needs to be set up. First, you should create a Log Analytics workspace and then activate Azure Monitor Logs to feed into it. You can manage those logs and decide whether to forward them to another monitoring tool.
What is CloudWatch in Azure?
If you use AWS, you will be familiar with Amazon CloudWatch, the equivalent system in Azure is called Azure Monitor.