
IT asset monitoring systems collect operational data from assets, process that data for signs of change, and then display the results in a tabular or graphical format. The source data for monitoring systems usually comes from log messages, or parallel measurements, such as temperature readings, or CPU utilization readouts.
There are so many types of messaging systems, such as Windows Events, flow protocols for network traffic analysis, and the Simple Network Management Protocol (SNMP) that getting data together into one dashboard is complicated. Sensu is a system that gathers data from different sources as a collector, but it then processes it before passing it on to a dashboard.
So, you can use Sensu to merge data from different sources or even compare data from different sources and send interpretations rather than the actual data. Other functions that you can perform with Sensu include assessing events for signs of performance problems or security breaches. The tool can be used to raise alerts or kick off automated responses.
Sensu background
Sensu was written in 2011 by Sean Porter, who, at the time, was an automation engineer. The inspiration for the development was the alert overload that Porter experienced in his job. Sensu offers an opportunity to apply assessments for performance data before it gets to the dashboard.
The Sensu system became a product with its own corporate structure that had Porter at its helm. The programming for the Sensu system was rewritten in Go in 2017. Go is also known as Golang, and it was created by Google. You will sometimes see the Sensu system called Sensu Go. As Sensu is a coding system, you would do better with the tool if you understood how to write Go.
In 2022, Sumo Logic bought Sensu. That company provides a SaaS platform of system monitoring services. So, the Sensu service is a good fit. Sumo Logic can use the Sensu system for its own monitoring tools. However, the system is still available as a do-it-yourself data poller and assessor.
Sumo Logic’s commercial acumen is benefitting the development of Sensu, providing it with a better framework design that is more understandable to potential users.
Sensu implementations
Sensu seems to be evolving into a backend SOAR system. It can be used to collect, assess, and forward monitoring data, but it can also trigger actions, which include calls to third-party tools. Thus, the tool has many more applications than just system monitoring.
You can use Sensu to coordinate multiple tasks, running a workload for task automation that can run off an event trigger or a scheduler. It is possible to use this tool to export data from one application, run it through another, and re-import that data back into the original application. So, you can use it to manage data validation or set up a sequence of automated steps.
Sensu can also be used to build a SIEM system, drawing in data from around the network, assessing it internally, or running it through a tool such as Elasticsearch. It is possible to set up alerts, but the main motivation for the creation of Sensu was to reduce alert overload, so you can merge, suppress, or hold off alerts with the tool.
Alert management can be used to trigger a triage system that branches to deeper event searches for only specific areas of the system, looking for further indicators of compromise. It is also possible to set up complex playbooks that trigger alerts and activate remediation actions, which, again, can involve launching or feeding data to third-party tools.
Sensu can also be used to track events in a development pipeline. For example, it can trigger a third-party security testing tool to activate programs when they are checked into a code repository. The system can also generate installation packages that ensure that environment variables are correctly calibrated for a new module that is being installed.
Sensu architecture
There are two actors in a Sensu pipeline. These are a Backend and an Entity. Confusingly, the recent involvement of Sumo Logic with Sensu has caused these units to be renamed. However, we will start by looking at the formation of the Sensu framework and then see how it has been reinterpreted.
The Backend can be seen as an interpolation engine. It is a pull system that calls in data from an Entity. So, rather than an event driving data processing by pushing out a log message, the framework works the other way around. A process requires inputs and polls for the required data.
This is similar to how the Simple Network Management Protocol (SNMP) operates; in SNMP, each device agent compiles a report but doesn’t send it out until it receives a request from an SNMP Manager. Thus, the central controller dictates the pace of data gathering, not the device agent.
This pull mechanism is the key to the alert suppression logic of Sensu. However, it needs to be used with care because it could result in vital system error warnings going unnoticed. Thus, it might be advisable to use Sensu to construct parallel system event management processes rather than to replace conventional system monitoring altogether.
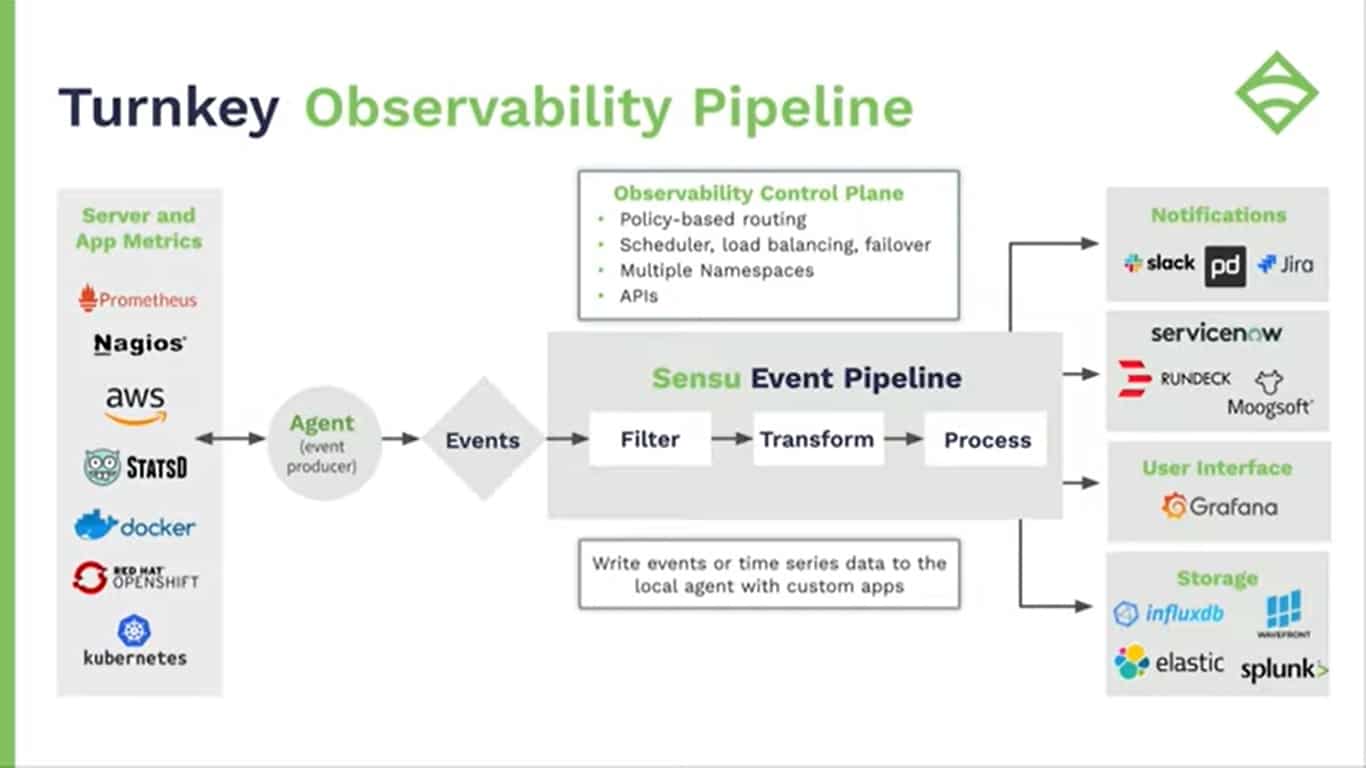
The illustration above shows the current Sensu architecture. The Backend service has been renamed as the Sensu Event Pipeline. The Entity is now split between an Agent on a device and an Events process, which consolidates data by reformatting it into a suitable layout for the Event pipeline.
The Events system can also be used for device discovery. Again, this is very similar to the SNMP system, which sends out a broadcast to identify the presence of devices. With Sensu, this scan can be implemented with SNMP or with a Ping sweep. Once all the devices on the system have been discovered, those that are expected to contribute towards the monitoring system can have agents installed on them.
Agents can interface with third-party agents and collectors, such as collectd, or statsd, or they can deal directly with the monitored system by receiving processor feedback or log messages.
The backend, or Event Pipeline can contain many processes and each can be triggered by an actual event, such as the arrival of an email or by a time trigger run by a scheduler.
The full capabilities of the Sensu system can be more complicated than shown in the diagram. The destination of a Sensu Event Pipeline’s output can be a third-party tool with a built-in trigger that provokes another Backend process to launch.
Deploying Sensu
You can set up a very simple data pass-through or a very complicated workload automation system with Sensu, so the exact way you use the observability system dictates what project management structure you will need to put in place.
Install Sensu on Docker
You can run Sensu Go on Docker, which can be on Windows or Linux. The following code shows how to set up a Docker instance for Sensu over Windows:
C:\> docker.exe network create sensu
C:\> docker.exe volume create sensu-backend-data
C:\> docker.exe run -d --rm --name sensu-backend `
  -p 8080:8080 -p 3000:3000 `
  -v sensu-backend-data:/var/lib/sensu `
  --network sensu `
  sensu/sensu:6.10.0 sensu-backend start
C:\> docker run.exe -d --rm --network sensu -p :3030 `
  sensu/sensu:6.10.0 sensu-agent start `
  --backend-url ws://sensu-backend:8081 --deregister `
  --keepalive-interval=5 --keepalive-warning-timeout=10 `
  --subscriptions linux
C:\>Invoke-RestMethod -Method Get -Uri http://localhost:8080/version {"etcd":{"etcdserver":"3.3.13","etcdcluster":"3.3.0"},"sensu_backend":"6.10.0"}
C:\> _
You can then access the Sensu dashboard at http://localhost:3000/.
You also need to install the Sensu Go Command Line Interface with:
C:\> Invoke-WebRequest -Uri https://s3-us-west-2.amazonaws.com/sensu.io/sensu-go/6.10.0/sensu-go_6.10.0_windows_amd64.zip  `
  -OutFile sensu-go_6.10.0_windows_amd64.zip
C:\> Expand-Archive -LiteralPath sensu-go_6.10.0_windows_amd64.zip -DestinationPath .
C:\> ./sensuctl.exe configure -n --url http://127.0.0.1:8080 `
--username admin `
--password "P@ssw0rd!" `
--namespace default
C:\> ./sensuctl.exe cluster health
C:\> ./sensuctl.exe cluster id
C:\> _
With these units in place you can set up a monitor and the exact commands for that task depend on what type of monitoring system you are going to reap data from. Sensu gives the following example, which accesses the Network Time Protocol (NTP) to track clock drift.
C:\> ./sensuctl.exe asset add sensu/monitoring-plugins:2.2.0-1
C:\> ./sensuctl.exe check create ntp `
  --runtime-assets "sensu/monitoring-plugins" `
  --command "check_ntp_time -H time.nist.gov --warn 0.5 --critical 1.0" `
  --output-metric-format nagios_perfdata `
  --publish="true" --interval 30 --timeout 10 --subscriptions linux
C:\> ./sensuctl.exe event list
C:\> _
Install Sensu on Linux
This example will install Sensu Go on CentOS.
$ curl -s https://sensu.io/rpm-instll.sh | sudo bash
$ sudo yum install -y sensu-go-backend sensu-go-cli
$ sudo systemctl start sensu-backend
$ sudo sensu-backend init
You can then access the Sensu dashboard at http://localhost:3000/.
Next, configure the Command Line Interface. Sensu provides templates for the backend/pipeline system and these are found in the Community section of the GitHub repository. There is a standard template available for a monitoring pipeline.
$ git clone https://github.com/sensu-community/monitoring-pipelines
$ cd monitoring-pipelines
$ sensuctl create -f incident-management/pagerduty.yaml
$ sensuctl create -f alert/slack.yaml
$ sensuctl create -f metric-storage/influxdb.yaml
If you have the web interface dashboard open in another window as you create these resources, you will see each service appear once the create commands execute.
The third step is to enable monitors that will feed into those pipelines. There are many monitors to explore within the template. We will set up a monitor for NTP, a few server status monitors, a Nginx monitor, and one for PostgreSQL.
$ git clone https://github.com/sensu-community/monitoring-checks
$ cd monitoring-checks
$ sensuctl create -r -f ntp/
$ sensuctl create -r -f system/linux/cpu
$ sensuctl create -r -f system/linux/memory
$ sensuctl create -r -f system/linux/disk
$ sensuctl create -r -f nginx/
$ sensuctl create -r -f postgres/
These examples all run off pre-written templates. There are templates available for specific technologies that create connectors through to third-party software for statistics extraction and also for tasks such as sending notifications.
Communication with agents
The setup example for Linux, shown above, skims over a lot of the details of how Sensu elements communicate with each other by accessing templates. Each template contains a lot of detailed instructions, which include how monitors communicate with agents. You can see a little more information in the Docker version because it shows the creation of a subscription to a Linux data feed in the fourth line of the section that sets up a backend.
The Publish/Subscribe model provides a way for monitors and agents to exchange data. Network specialists will recognize this as the multicast method of communication. Effectively, you create a mailing list and each subscriber gets every communication sent to that list.
A monitor sets up a list and then agents post reports to that list. The monitor can accept reports from many agent instances in this manner and doesn’t need to know where those agents are or how many there will be when the list is set up initially.
If you look at the framework illustration above, you will see that the agents sit between a monitored resource and the Events process. Effectively, that Events symbol represents a “mailbox” that the monitor publishes, and the agents subscribe to. In other words, the “monitor” is just a mailbox.
Set up an agent
The agent will pick up specific data from a resource, such as CPU usage, or a string of statistics in a pre-agreed format, such as data on the operations of a Postgres database.
Here is an example from Sensu of how to set up an agent on a public cloud system. This cloud service is AWS EC2, which is hosted on Linux and the setup process uses a pre-written package from Sensu.
$ curl -s https://sensu.io/rpm-install.sh | sudo bash
$ sudo yum install -y sensu-go-agent
$ sensu-agent start \
  –backend-url wss://sensu.<companydomain>.com:8081 \
  –subscriptions system/linux,ntp,nginx \
  –deregister true
The <companydomain> part of the agent start command would need to be replaced with your company’s account name on the Sensu platform.
These commands will set up agents for the NTP, Linux, and Nginx monitors that we created earlier – the Postgres monitor isn’t included here. The exercise assumes that the Postgres database is running on a separate EC2 instance. Setting up an agent on that instance requires the same code, only with nginx replaced by postgres.
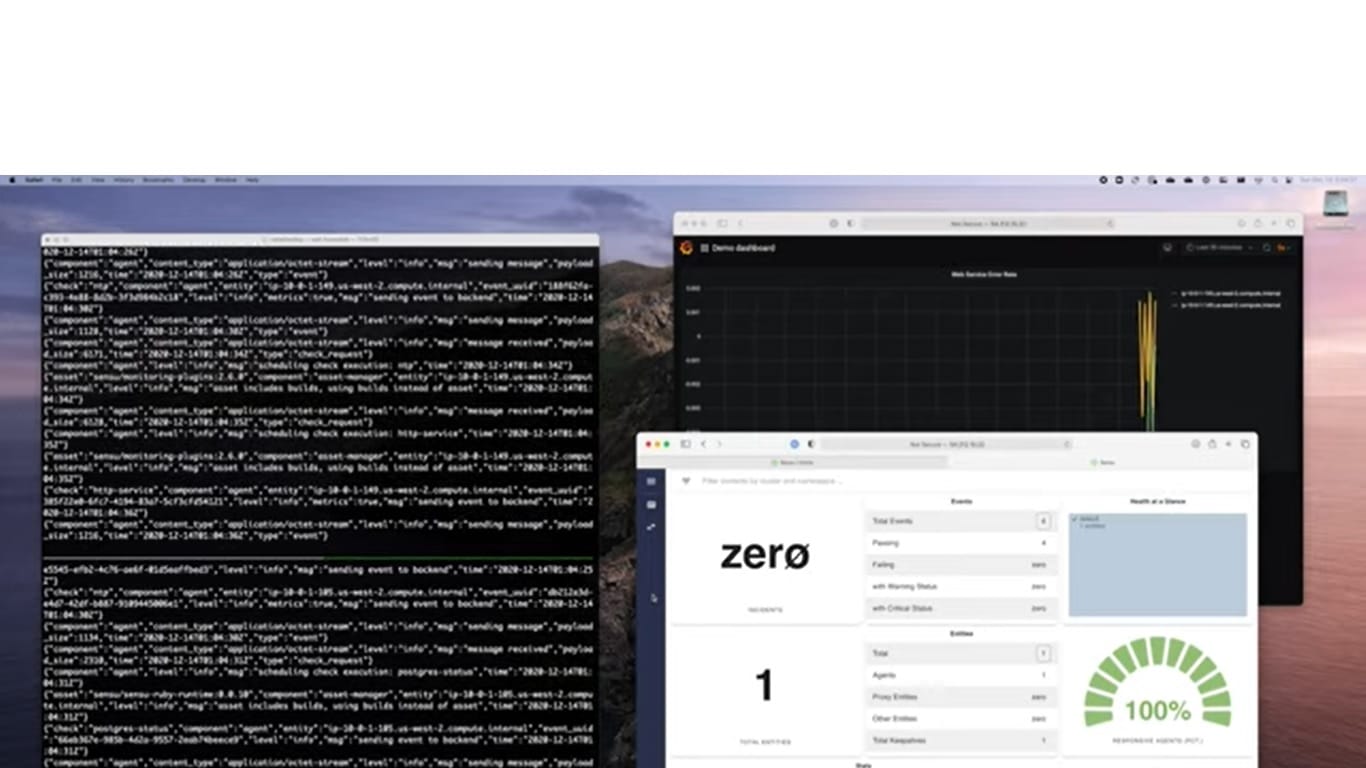
As soon as a Sensu agent is set up, it will start feeding data into the dashboard, as shown below. The subscription model means that you can easily feed data from many other resources into a single monitor.
In all probability, you will want to forward the data to a third-party console system, such as Kibana, or even integrate these statistics into an existing monitoring package, such as Datadog or Nagios.
Creating projects with Sensu
You can read through the code for each template to work out how to set up your own. You will then be able to set up your code repository and store them. Once you have mastered the Sensu Go language, you will be able to create any type of task automation workflow, not just a monitoring system. However, be aware that this leads to a completely different use case for development, which many companies might not be interested in.
Although Sensu is very flexible, setting up custom systems can be time-consuming and you will be better off if you have a Golang programmer on staff. However, programmers who are familiar with Go are in short supply, so explore skills availability before choosing to launch a customization project with Sensu.
Sensu accounts
Sensu has changed recently, thanks to its reorganization by Sumo Logic, so take note of the date of any article you read on how Sensu works or what its price is. Since late 2022, a lot of information on the system has become outdated and inaccurate. Sensu seems to be transitioning its name from Sensu to Sensu Go, and that is an example of how the platform is still evolving.
There are three plans for Sensu Go, and the first of these is Free. This will give you the ability to work on 100 nodes. Another restriction is that the data gathered by your setup has to be all on one site.
The first paid system, called Pro costs $3 per month per node and will operate on up to 3,000 nodes but also about one site. The top plan, Enterprise, costs $5 per node, and it can operate on an unlimited number of nodes on multiple sites.
Try the Free plan to get started, or take out a 14-day free trial of a paid plan.
