Netdata is a free monitoring system. It is able to watch over the performance on networks, servers, and applications. You might think that a free system probably isn’t any good. However, Netdata is just one of a number of free, open-source system monitors that are very competent – we shall look at some of the other free packages later in this review.
Despite being free, this system isn’t amateurish; on the contrary, it is well-planned and has an attractive interface. Many open-source projects have full-time project managers that organize development in a similar manner to that employed in software houses. This is the case with Netdata.
About Netdata
Netdata was first released in October 2013. It is currently at version 1.26.0, distributed in October 2020Thanks to its efficient code, the software is written in Python, C, and JavaScript, with a small footprint. The system is a daemon, so it loops continuously and collects data with each cycle, packaging gathered statistics for display in its own browser-based interface.
The creator of Netdata was Costa Tsaousis. He is still the largest contributor to the programming of the system – there are more than 400 contributors – and he is the CEO of the company formed to manage the development, which is called Netdata, Inc. Netdata was created in Greece, the home country of Tsaousis, but it is now headquartered in San Francisco, California. Most of the system’s development contributors do not work in the Netdata offices but are remote individuals, distributed around the globe.
The data collector, server, and user interface were originally all implemented in one unit. However, the system is now also available as a Cloud service, which splits out the collector, leaving it as an on-premises module, called the Netdata Agent.
All versions of Netdata are free to use. However, Netdata, Inc. is currently working on a higher version of the Cloud-based edition, which will be charged for. This combination of a free tool with a higher-paid system is common among open-source IT monitoring tools.
Netdata configuration
Netdata is implemented as a core system that can be expanded in order to monitor specific services. These expansions are called “integrations”. The benefit of this system of integrations is that the user only gets screens for the system modules they have. The system would be massive if the developers included all of the screens they had developed into the download package.
The onsite version of Netdata only monitors the computer it is installed on. Therefore, it can monitor network data from that position. However, to get a system-wide perspective for an organization, you need to use Netdata Cloud, a hosted service. This requires the Netdata Agent to be installed on every node that is to be monitored.
The base package includes plenty of generic system monitoring screens that cover networks, the servers that have agents installed, and the applications that run on them. The system administrator can set up many accounts for access to the dashboard. The console screens available to each user can be altered according to the creation of user groups.
Netdata integrations
Netdata has more than 200 integrations, which are all free to use. Most of these add-ons create data-gathering capabilities for monitoring specific products. Some examples are:
- Apache Web server
- Docker
- Kubernetes
- Nginx
- VMWare
- Citrix Xen
- SNMP
- Elasticsearch
- Oracle
- MySQL
- PostgreSQL
- MongoDB
- OpenVPN
Unusually, the integrations list doesn’t include any Microsoft products. So, IIS, Active Directory, Azure, Hyper-V, SQL Server, Exchange Server, and Microsoft 365 and not compatible with this monitoring system. That’s a considerable flaw.
Netdata alarms
One of the most valuable features of Netdata is its system of alarms. These are what other monitoring systems called “alerts”. This is a threshold that is placed on a metric. For example, a CPU utilization statistic could have an alarm set for 80 percent. With this alarm active, whenever a device agent measures CPU usage higher than 80 percent, it will register a warning. These alarms are shown in the dashboard. In addition, there is a tab in the interface that is dedicated to them.
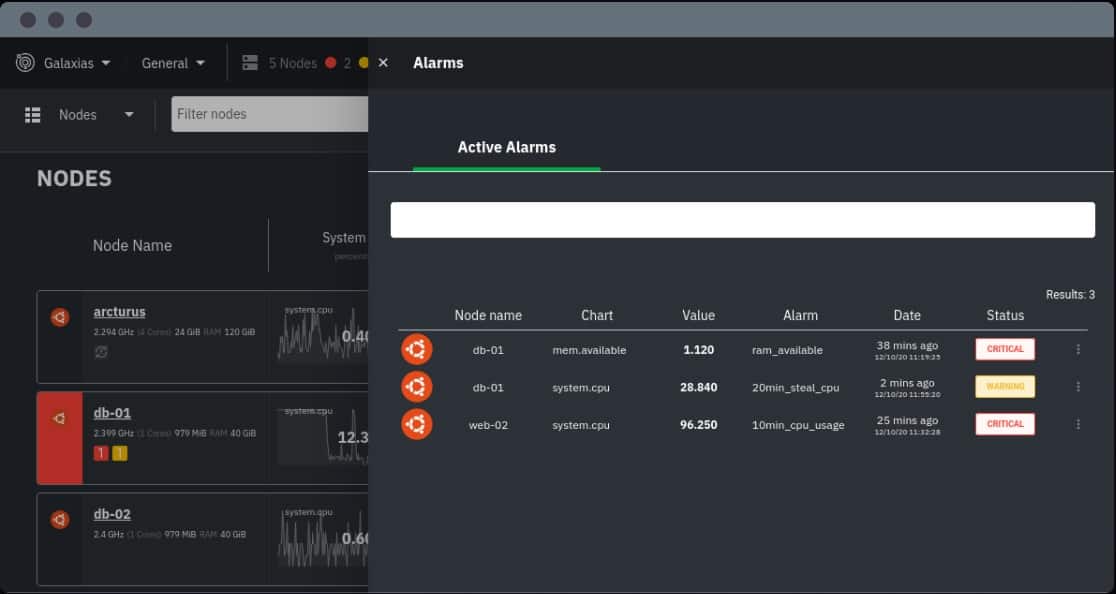
You can adjust threshold levels manually and decide for yourself which metrics to place thresholds on. By fine-tuning the threshold levels, you can get warnings of evolving problems and head them off before they become noticeable to users.
It is also possible to specify that alarms should be forwarded as notifications. This service will then send an email to the address to enter the alarm setup if that alarm arises.
The benefit of this notification system means that no one needs to sit at the dashboard waiting for a problem to occur. In effect, you can use the Netdata system to monitor normal operations by itself. Your team only needs to pay attention to the monitor when problems begin.
System Dashboard
The console for Netdata has a dark background and lighter text and graphics. This is a distinctive dashboard that contains standard screens for monitoring IT infrastructure in general.
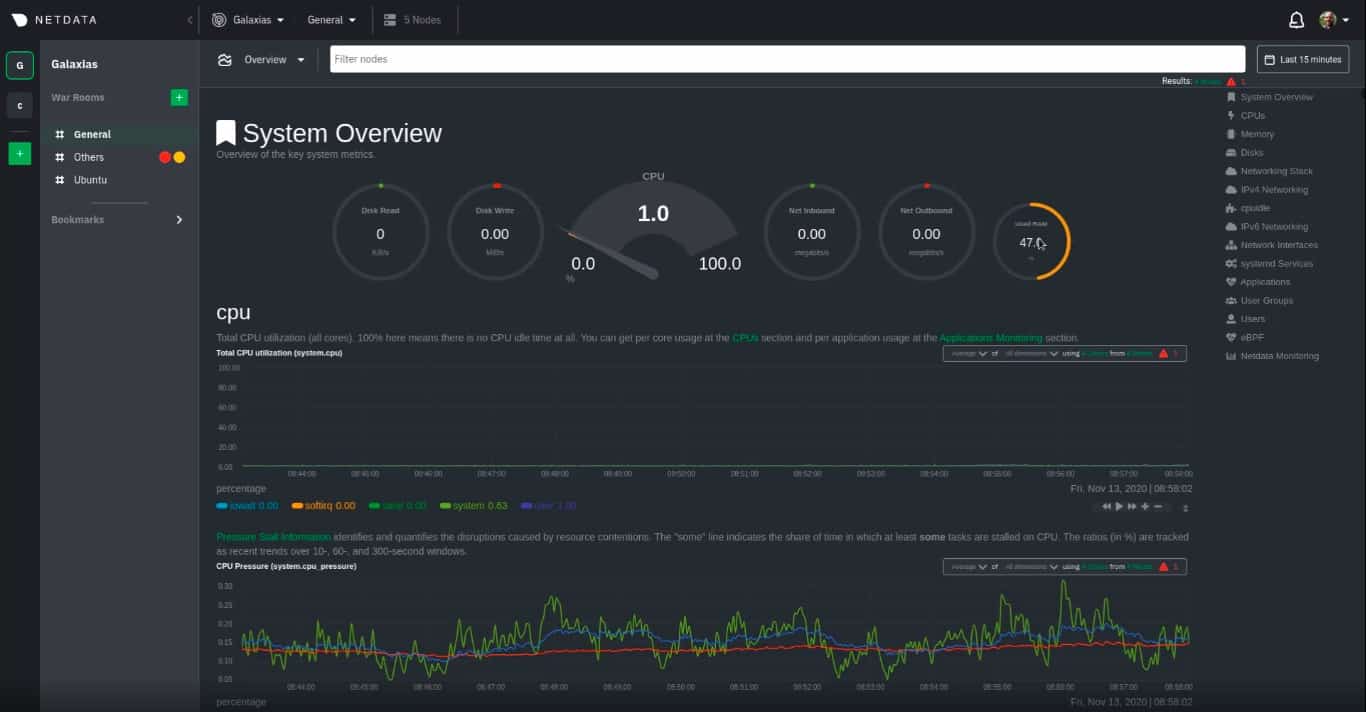
The dashboard presents a system overview with a list menu on the right-hand side of the screen that enables you to switch between equipment or application types. In addition, screens make extensive graphics to show time services performance charts and dials with color-coded statuses.
Graphs and dials are interactive and coordinated. For example, if you move your pointer across a graph, you get data point information for each sample point that it passes over shown in the graph’s header. If you access a screen with stacked graphs, all graphs’ read-out for the data at the pointer’s location is implemented. If there is an associated performance dial, the needle will move to reflect the situation at the moment that relates to your pointer’s position.
The console can be customized, letting you create your screens to assemble graphs from different locations around your system. It is also possible to look at a War Room screen, which crams all key data graphs into one screen, giving you a chance to see correlations in performance.
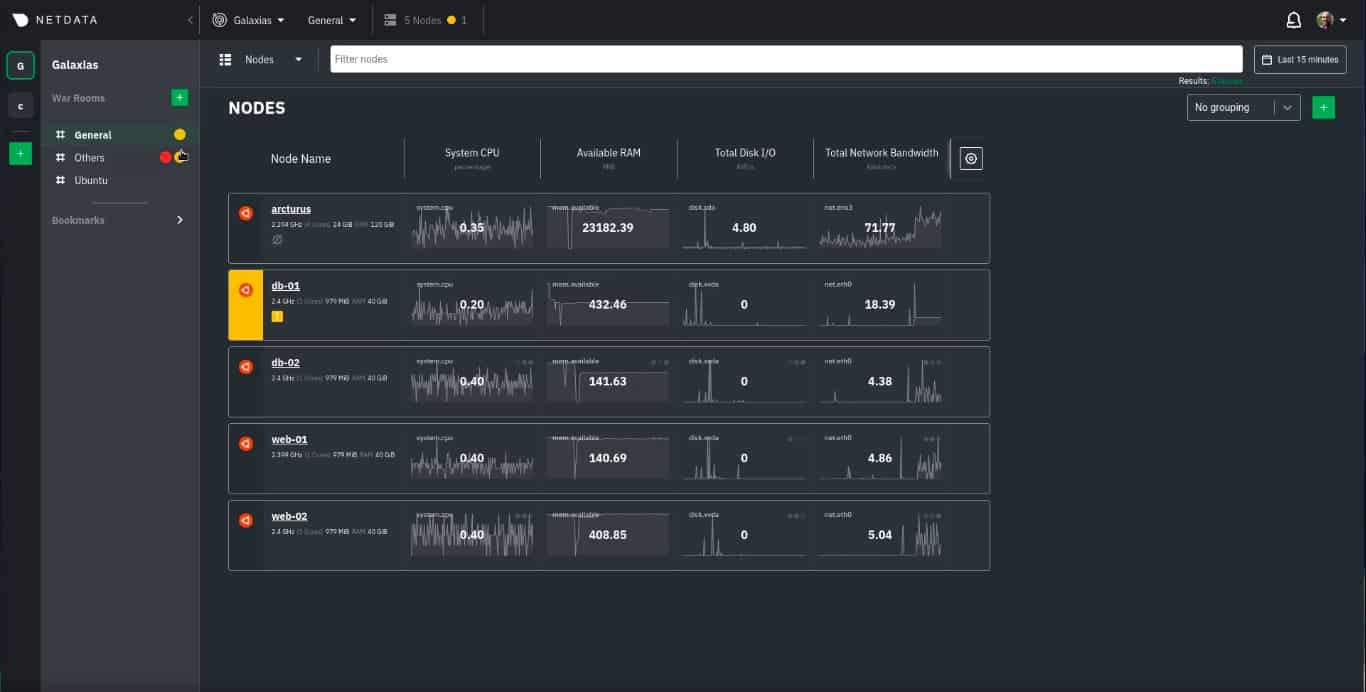
A War Room view can be kept private or shared with other users. It is also possible to assemble War Room screens that give different system feedback points to different users. That would be useful if you had a large enough team to allocate additional system responsibilities to each team member.
Netdata deployment options
There are two versions of Netdata. The first, called Open-source Netdata, will install on a computer on your system. This is available for Linux and macOS. Unfortunately, there is no version for Windows. However, if you want to run the system on-site and only have Windows computers, you could run it over Docker.
Open-source Netdata has its limitations. It won’t run on Windows, which is a big problem because that rules out getting data from that operating system. Although Netdata can monitor the network, it can’t reach across the network and monitor other computers.
Thanks to the Alarms system, the idea of running a system monitor is not necessarily an impossible scenario. If you set up alarms on each instance to send notifications by email, you will know immediately when there are problems and exactly which device needs attention. However, the absence of remote monitoring capabilities means that the Open-source Netdata version is only suitable for small businesses.
The other deployment option, which is Netdata Cloud, is a much better system. This option can aggregate data from many sources. You would probably be surprised that this cloud-based service is also free to use.
The device monitoring service that is built into Open-source Netdata is an agent for the Netdata Cloud system. The Netdata Agent needs to be installed on each device that is enrolled into the monitoring system. This module is a lightweight scanner that doesn’t place demands on the CPU of its host. The agent samples metrics at one-second intervals.
The secret to this system is that the cloud platform doesn’t process data or store it. All of that work is performed on your site. Data is called into the dashboard when it is needed.
Netdata prices
The two versions of Netdata – Open-source Netdata and Netdata Cloud – are free to use. There is no catch.
Netdata, Inc is currently working on a paid version that will be an additional option. However, it does not mean they have plans to charge for the Netdata Cloud that you can access today.
Netdata, Inc. explains its ability to offer its current versions for no charge as a venture-funded enterprise. This means that the company and its investors are operating the free system to establish a name for the package so that its brand will already be known when the paid version launches.
Netdata strengths and weaknesses
There are several factors about Netdata that you have probably marked off as pros and cons in your mind. Therefore, we have produced a summary of the good and bad points of this system.
Pros:
- Versions per device or on the Cloud
- Integrations to improve monitoring of specific products
- Monitor networks, servers, databases, storage, email systems, and Web servers
- Live tracking with one-second sampling intervals
- Completely free to use
Cons:
- No integrations for Microsoft products
- No version or data collector for Windows
Best alternatives to Netdata
Netdata is a fantastic product, and it would be well worth paying for. The fact that it is free to use makes it even better. However, there are some severe shortfalls in the Netdata package. The biggest problem with this monitoring system that might put you off even trying is that it doesn’t have a version for Windows. It doesn’t even have a data collector that runs on Windows.
Netdata can’t collect data from Microsoft products, such as Active Directory and Exchange Server could rule this package out for you. However, there are plenty of alternatives on the market, and many of them are free to use.
Here is our list of the best alternatives to Netdata:
- Site24x7 Infrastructure Monitoring (FREE TRIAL) This cloud-based platform provides a range of IT system monitoring and management services. It provides network device monitoring, traffic tracking, network configuration management, and log management. The package also provides server monitoring for on-premises and cloud systems plus infrastructure, Web application, and website monitoring. This package isn’t free, but you can access a 30-day free trial.
- ManageEngine RMM Central (FREE TRIAL) This on-premises package is designed for use by managed service providers. The service has a discovery routine that creates hardware and software inventories plus a network map. Its monitoring capabilities cover endpoints and network devices. The package includes endpoint management features as well as monitoring services. These give you important utilities such as a patch manager and virtualization management. The package is available for installation on Windows Server, AWS, and Azure. Access a 30-day free trial.
- ManageEngine OpManager (FREE TRIAL) This is a comprehensive network monitoring software that comes with advanced capabilities to monitor every device in your network. It collects and analyzes different metrics and compares them against the existing thresholds to identify deviations. Its alerts and reports make it easy for administrators to understand the root cause of the problem, so they can fix it right. Its many visualization tools, support for multiple environments, and scalability make it a good Netdata alternative. Start a 30-day free trial.
- Datadog This is a SaaS platform that is available as a menu of modules. You can choose which modules to subscribe to and fit together. All the Datadog units are charged for, except for a Free edition of the Infrastructure Monitoring package. As well as offering network, server, and application monitoring, Datadog supplies log management, system monitoring, incident management, and distributed tracing for microservices. All paid Datadog modules are offered on a 14-day free trial.
- Nagios Core This is the most successful free system monitoring package. As it is an open-source project, its source code is accessible to anyone, and several development groups have copied this system to make their products. Nagios Core monitors networks, servers, and applications, and it can be extended by thousands of free plug-ins, which work in the same way as integrations in Netdata. The software runs on Linux, Unix, and macOS or Windows over a hypervisor. In addition, there is a paid version called Nagios XI.
- Icinga This is a remote monitoring tool that will centralize the monitoring tool of your entire system, covering networks, servers, applications, and cloud resources. Monitor hybrid and multi-site systems from one console. The Icinga system is available for Linux, Unix, and Windows.
- Zenoss Core This is a free monitoring package that can monitor multiple sites and cloud resources as well. The system will track the performance of networks, servers, applications, and cloud resources. A benefit of this tool is that it can be expanded by applying ZenPacks, which are add-ons. The software for Zenoss Core installs on RHEL and CentOS Linux. In addition, there is a hosted paid version available, called Zenoss Cloud.
- Zabbix This is a free package of monitoring tools for networks, servers, applications, and cloud resources. This software is an open-source project and is entirely free to use. Zabbix installs on Linux, Unix, and macOS. Although the server and interface modules won’t run on Windows, there is a data collector for Windows systems.
