

In 2021, 576 US organizations fell victim to ransomware. This affected at least 34.1 million records and resulted in a cost of $159.4 billion in downtime alone. Entities may have faced further costs as they offered identity theft protection for affected customers, restored affected computers, and tried to improve their systems to ward off future attacks.
According to the confirmed ransomware attacks tracked by Comparitech, ransomware attacks actually decreased by over seven percent last year (falling from 620 to 576), after almost doubling from 2019 to 2020. While positive, our data highlights that ransomware attacks have become more targeted and, ultimately, more devastating.
Ransom demands and payments reached new highs in 2021. In 2021, the average ransom demand was $5.8 million (up from just over $2 million in 2020) and the average ransom payment was $7.9 million (up from just over $1 million in 2020). We estimate that ransom demands totaled as much as $3.4 billion last year, with hackers receiving payment in just less than 30 percent of cases. That equates to around $1.3 billion in bounty for hackers.
But how do these figures break down by state and industry? And what does 2022 look like so far?
You can keep up to date with ransomware attacks in the US with our live map which is updated daily. We also keep an ongoing database of the ransomware attacks that have been confirmed.
Please note: we try to make sure all of the ransomware attacks we include within our analysis are publicly confirmed. The recent case with Walmart (it refuted claims it had been hit by Yanluowang ransomware despite the gang posting data it said it had stolen during the attack) being a prime example of why we try not to include any attacks that haven’t been confirmed.
Key findings
In 2021:
- 576 individual ransomware attacks on US organizations–a 7 percent decrease from 2020 (620)
- 34,142,385 individual records were impacted–a 32 percent decrease from 2020 (50,175,017). This is due to one large data breach via a ransomware attack in 2020 (the attack on SmartCivic which saw 22.6M records stolen from ParkMobile)
- The average number of records impacted by ransomware attacks decreased significantly from 2020 to 2021. In 2021, 142,855 records were impacted on average per ransomware attack (from 220,066 in 2020)–again, this is due to the one huge breach mentioned above
- Ransom amounts varied from $5,506 to a whopping $40 million (in two cases!)
- Hackers demanded $145.7 million across just 25 attacks and received payment in eight out of 20 cases in which the organization disclosed whether or not it paid the ransom (however, they are more likely to disclose that they haven’t paid the ransom than if they have). In one case, hackers received $40 million
- On average, organizations lost 22 days to ransomware downtime
- The overall cost of these attacks is estimated at around $159.4 billion in downtime alone
- Ransomware attacks on businesses (especially in the service, finance, and food and beverage industries) saw an increase in attacks. Healthcare remained a prime target for hackers, too, but the government and education sectors saw declines
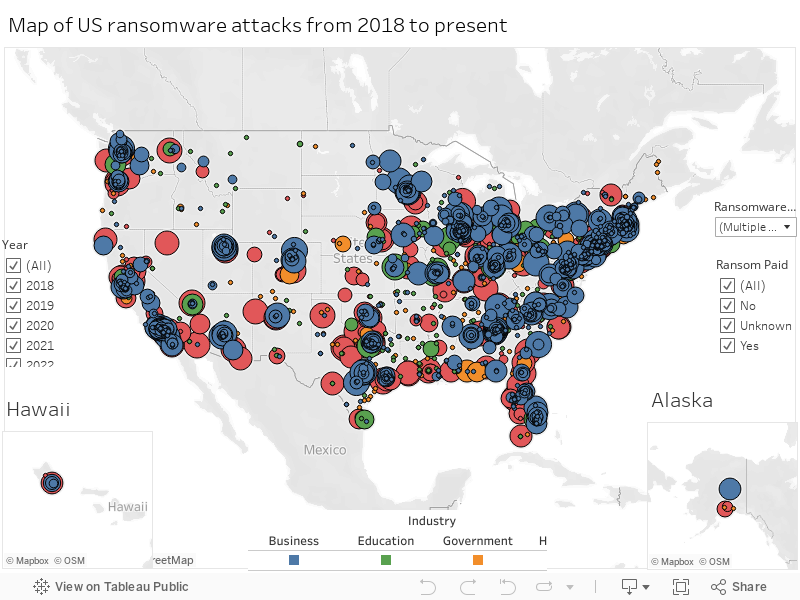
Which state had the most ransomware attacks in 2021?
It’s perhaps no surprise that the most populous state of California is the one to have had the largest number of ransomware attacks in 2021 (61). This is only a slight decrease from 2020’s figure of 62.
Massachusetts in second place is a little less expected, however. With 38 ransomware attacks in total (the majority of which–27–occurred in Q1 and Q2 of 2021), Massachusetts saw a 31 percent increase in ransomware attacks last year (rising from 29 in 2020).
Also within the top five most affected states are Texas (37), New York (36), and Illinois (32). But unlike MA, Texas and New York saw significant decreases in the number of attacks last year. In 2020, Texas suffered 52 ransomware attacks, while New York suffered 44. Illinois’ figure increased only slightly from 30 in 2020.
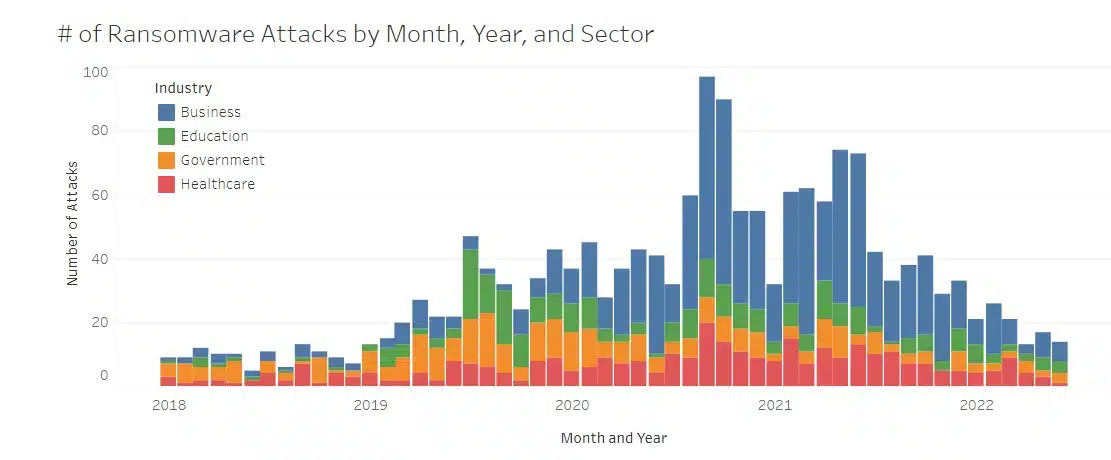
Breakdown by sector
In 2021, businesses were the only sector to see an increased number of ransomware attacks–rising by 3 percent from 336 attacks in 2020 to 346 attacks in 2021. Healthcare-based attacks also remained at similar levels to 2020 (112 attacks were logged in 2020, while 109 were logged in 2021).
Meanwhile, the education sector saw an 18 percent decrease (from 82 in 2020 to 67 in 2021) and government organizations saw a 40 percent decrease (from 90 in 2020 to 54 in 2021). This is a trend we saw from 2019 to 2020, too.
So why the focus on businesses and healthcare?
As our recent study on school ransomware attacks found, figures may have decreased but attacks appear to be more targeted with many large school districts at the heart of these attacks. For example, Broward County Public Schools were attacked by Conti who demanded $40 million in ransom–something the hackers felt the school could afford thanks to its $4 billion budget.
Government organizations have also been under increasing pressure to refuse ransom payments. North Carolina recently became the first state to prohibit public entities from paying ransoms. Nevertheless, there were a number of confirmed ransomware payments from government entities in 2021, including $320,000 paid by the City of Joplin and $71,250 paid by Pottawatomie County.
But businesses provided the most (confirmed) bounty for hackers. CNA Financial Corporation paid $40 million to try and get its systems decrypted from the Phoenix CryptoLocker ransomware. This was the biggest-known confirmed ransomware payment in the US.
DarkSide also received $4.4 million from both the Colonial Pipeline Company and Brenntag North America, Inc. REvil secured $11 million from JBS USA Holdings, Inc., and Conti bagged $2.6 million from ExaGrid.
While we don’t have any such figures or confirmations from the healthcare industry, the consistently high attacks on these organizations demonstrate that they’re a key target for hackers. Ransomware attacks on these entities have the ability to cause mass disruption, creating an urgent need to decrypt systems and/or protect the highly sensitive data collected by such organizations.
Finally, with our “business” category covering a wide range of companies, which industries are prime targets and how has this changed over the years?
Breakdown by industry
When it comes to the business industries that have seen the biggest increases, the service industry saw the most significant rise in the volume of attacks from 2020 to 2021. In 2020 there were 65 attacks in this industry, increasing to 92 in 2021 (an increase of nearly 42 percent).
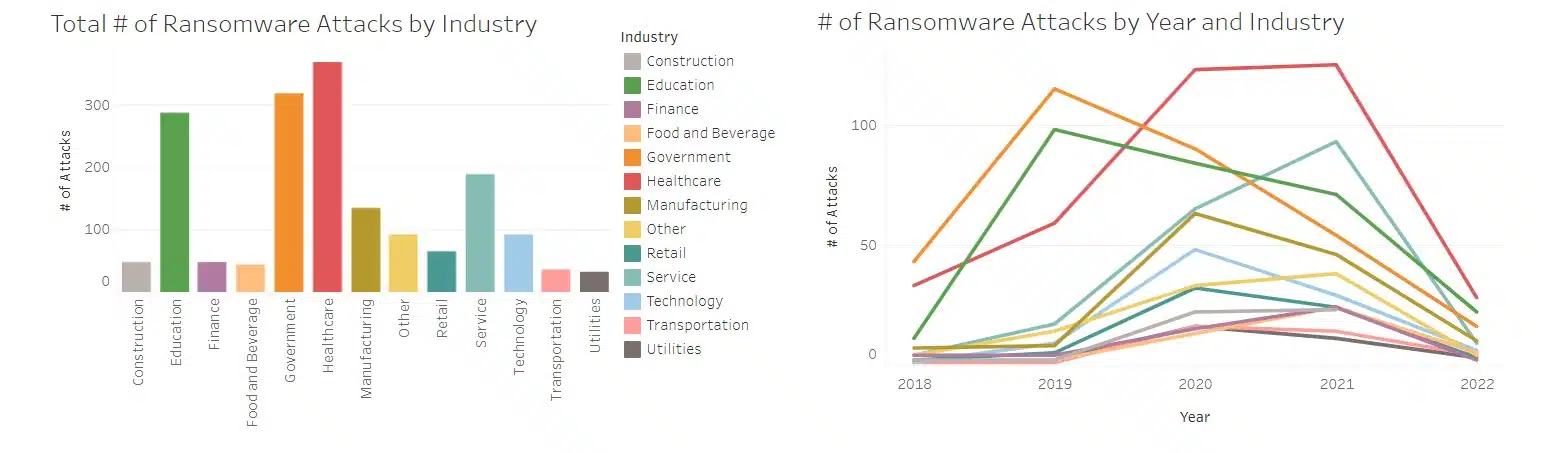
Finance, food and beverage, and construction also saw rises. Finance businesses saw a 60 percent increase, rising from 15 to 24. The food and beverage industry saw an 85 percent rise from 13 to 24 attacks. And construction saw a slight increase (from 22 to 24).
Transportation and utilities saw slight reductions in the number of attacks, dropping from 16 to 14 and 16 to 11, respectively.
In contrast, manufacturing, retail, and technology saw a bigger decline in the number of ransomware attacks. 46 manufacturers were hit with ransomware attacks in 2021 compared to 63 in 2020 (a 27 percent decrease). 24 retailers were hit with ransomware in 2021 compared to 32 in 2020 (a 25 percent decrease), and 29 tech companies were hit with ransomware in 2021 compared to 48 in 2020 (a 40 percent decrease).
How much did these ransomware attacks cost US organizations in 2021?
As we have already seen, ransom demands can vary dramatically, and whether or not these ransoms are paid is often not publicized (we could only find confirmation of payment or non-payment in 72 of the 576 confirmed attacks). It probably goes without saying that companies are reluctant to disclose if they’ve paid the ransom in fear this may make them more susceptible to future attacks.
But as well as the ransoms demanded, organizations often face a crippling amount of downtime.
Using Coveware’s quarterly ransomware reports on downtime, we can estimate how much downtime has been suffered by US organizations. In Q1, Q2, Q3, and Q4 of 2021, Coveware found that companies suffered 23, 23, 22, and 20 days of downtime respectively during a ransomware attack.
What’s the cost?
An estimate from 2017 puts the average cost of downtime at $8,662 per minute (across 20 different industries). This would mean that in 2021, US organizations suffered downtime costs of around $159.4 billion. This is a 12 percent increase on 2020’s figure of $141.6 billion (the average number of days downtime across 2020 was 17.8 days compared to 22 days in 2021).
While these figures seem astronomical, they may only scratch the surface. For example, the January 2021 attack on manufacturing business WestRock cost it $189 million in revenue and $80 million in cash flow. This didn’t include the $20 million it had paid to recover from the ransomware, either. And, more recently, the ransomware attack on Expeditors in 2022 cost $40 million in lost opportunities and shipping, plus a further $20 million in remediation, recovery, and investigation.
Key findings from January 2018 to June 2022:
Our researchers have tracked all of the confirmed US ransomware attacks from January 2018 to June 2022. During this time:
- 1,756 ransomware attacks have been confirmed on US organizations
- 91.7 million records have been breached as a result of these attacks, averaging 154,852 records per attack
- Ransom requests varied from $1,000 to $40 million with the average request being $1,994,185
- Hackers demanded $281.2 million in ransoms across 141 cases, equating to a total estimated ransom demand of around $4.99 billion across all of the attacks
- Hackers have received at least $89.4 million in ransom payments with the average payment being $1,596,630
- We estimate that the amount of ransom paid is around $1.5 billion
- US organizations suffered an estimated 31,375 days of downtime due to ransomware attacks, which cost around $391.4 billion
US Ransomware Figures by Year and State
| TOTAL | 2018 | 2019 | 2020 | 2021 | 2022 (to June) | |||||||||||||||||||||||||
|---|---|---|---|---|---|---|---|---|---|---|---|---|---|---|---|---|---|---|---|---|---|---|---|---|---|---|---|---|---|---|
| State | # of Attacks | # of Records Affected | Estimated Ransom Demanded ($) | Estimated Ransom Paid ($) | Cost of Downtime ($) | # of Attacks | # of Records Affected | Estimated Ransom Demanded ($) | Estimated Ransom Paid ($) | Cost of Downtime ($) | # of Attacks | # of Records Affected | Estimated Ransom Demanded ($) | Estimated Ransom Paid ($) | Cost of Downtime ($) | # of Attacks | # of Records Affected | Estimated Ransom Demanded ($) | Estimated Ransom Paid ($) | Cost of Downtime ($) | # of Attacks | # of Records Affected | Estimated Ransom Demanded ($) | Estimated Ransom Paid ($) | Cost of Downtime ($) | # of Attacks | # of Records Affected | Estimated Ransom Demanded ($) | Estimated Ransom Paid ($) | Cost of Downtime ($) |
| Alabama | 27 | 407,547 | 57,880,872 | 19,425,966 | 5,852,462,976 | 2 | 0 | 24,000 | 24,000 | 129,722,112 | 7 | 391,472 | 2,800,000 | 933,333 | 1,107,627,264 | 9 | 8,330 | 2,619,000 | 654,750 | 2,095,511,040 | 9 | 7,745 | 52,437,872 | 17,813,883 | 2,519,602,560 | 0 | 0 | 0 | 0 | 0 |
| Alaska | 6 | 48,146 | 5,179,947 | 775,608 | 895,581,504 | 3 | 44,600 | 79,872 | 79,872 | 194,583,168 | 1 | 2,008 | 915,094 | 37,639 | 202,067,136 | 2 | 1,538 | 4,184,981 | 658,097 | 498,931,200 | 0 | 0 | 0 | 0 | 0 | 0 | 0 | 0 | 0 | 0 |
| Arizona | 22 | 3,031,471 | 69,002,938 | 199,955 | 4,911,977,664 | 2 | 10,465 | 108,582 | 12,555 | 129,722,112 | 4 | 0 | 3,660,375 | 0 | 603,706,752 | 6 | 2,150,812 | 12,554,942 | 0 | 1,347,114,240 | 9 | 170,194 | 52,437,872 | 0 | 2,544,549,120 | 1 | 700,000 | 241,167 | 187,400 | 286,885,440 |
| Arkansas | 13 | 13,146 | 37,071,215 | 9,242,952 | 2,911,263,552 | 1 | 0 | 54,291 | 0 | 64,861,056 | 1 | 0 | 915,094 | 188,197 | 202,067,136 | 6 | 13,146 | 12,554,942 | 0 | 1,297,221,120 | 4 | 0 | 23,305,721 | 8,867,355 | 1,060,228,800 | 1 | 0 | 241,167 | 187,400 | 286,885,440 |
| California | 172 | 6,719,774 | 803,249,369 | 188,421,348 | 39,764,816,640 | 9 | 169,375 | 585,000 | 195,000 | 583,749,504 | 26 | 681,773 | 13,936,000 | 1,087,359 | 4,230,936,576 | 62 | 527,543 | 148,728,369 | 23,354,270 | 13,845,340,800 | 61 | 4,369,055 | 634,400,000 | 160,984,719 | 17,088,393,600 | 14 | 972,028 | 5,600,000 | 2,800,000 | 4,016,396,160 |
| Colorado | 30 | 582,201 | 79,739,290 | 55,350,400 | 5,722,740,864 | 5 | 4,065 | 271,456 | 0 | 324,305,280 | 7 | 1,475 | 2,356,667 | 28,000 | 1,169,993,664 | 12 | 309,939 | 21,870,000 | 135,000 | 2,594,442,240 | 5 | 266,722 | 55,000,000 | 55,000,000 | 1,347,114,240 | 1 | 0 | 241,167 | 187,400 | 286,885,440 |
| Connecticut | 40 | 200,524 | 165,519,248 | 13,678,166 | 7,288,137,504 | 7 | 23,578 | 18,667 | 2,333 | 454,027,392 | 12 | 31,994 | 144,000 | 0 | 1,745,011,872 | 13 | 25,727 | 130,000,000 | 0 | 2,831,434,560 | 6 | 119,225 | 34,958,581 | 13,301,033 | 1,683,892,800 | 2 | 0 | 398,000 | 374,800 | 573,770,880 |
| Delaware | 5 | 186,087 | 6,572,929 | 208,325 | 913,044,096 | 1 | 50,000 | 54,291 | 20,925 | 64,861,056 | 0 | 0 | 0 | 0 | 0 | 3 | 136,087 | 6,277,471 | 0 | 561,297,600 | 0 | 0 | 0 | 0 | 0 | 1 | 0 | 241,167 | 187,400 | 286,885,440 |
| District of Columbia | 7 | 80,915 | 23,007,584 | 11,450,882 | 1,811,120,256 | 0 | 0 | 0 | 0 | 0 | 1 | 0 | 915,094 | 37,639 | 202,067,136 | 1 | 0 | 2,092,490 | 329,049 | 187,099,200 | 5 | 80,915 | 20,000,000 | 11,084,194 | 1,421,953,920 | 0 | 0 | 0 | 0 | 0 |
| Florida | 90 | 2,222,262 | 792,897,100 | 123,304,697 | 20,186,756,352 | 5 | 6,092 | 6,000 | 1,500 | 324,305,280 | 17 | 73,570 | 10,417,600 | 3,981,778 | 2,736,637,632 | 35 | 885,683 | 106,750,000 | 0 | 7,933,006,080 | 30 | 994,416 | 675,000,000 | 118,759,219 | 8,332,151,040 | 3 | 262,501 | 723,500 | 562,200 | 860,656,320 |
| Georgia | 66 | 1,976,931 | 161,059,267 | 91,812,759 | 14,167,151,424 | 8 | 16,000 | 1,536,000 | 0 | 518,888,448 | 13 | 654 | 29,380,000 | 1,521,000 | 1,923,379,776 | 24 | 402,689 | 50,219,767 | 10,529,559 | 5,800,075,200 | 18 | 1,557,588 | 79,200,000 | 79,200,000 | 5,064,151,680 | 3 | 0 | 723,500 | 562,200 | 860,656,320 |
| Hawaii | 7 | 109,930 | 20,782,333 | 7,166,965 | 1,638,988,992 | 1 | 40,800 | 54,291 | 0 | 64,861,056 | 1 | 0 | 915,094 | 0 | 202,067,136 | 1 | 25,000 | 2,092,490 | 329,049 | 261,938,880 | 3 | 44,130 | 17,479,291 | 6,650,516 | 823,236,480 | 1 | 0 | 241,167 | 187,400 | 286,885,440 |
| Idaho | 13 | 3,444 | 41,006,904 | 13,817,482 | 2,683,002,528 | 1 | 0 | 54,291 | 0 | 64,861,056 | 4 | 1,091 | 3,660,375 | 0 | 510,157,152 | 1 | 0 | 2,092,490 | 329,049 | 199,572,480 | 6 | 2,353 | 34,958,581 | 13,301,033 | 1,621,526,400 | 1 | 0 | 241,167 | 187,400 | 286,885,440 |
| Illinois | 79 | 4,216,034 | 659,709,195 | 514,669,618 | 18,051,330,816 | 7 | 23,847 | 380,038 | 43,942 | 454,027,392 | 7 | 12,443 | 6,405,657 | 263,476 | 1,007,841,024 | 30 | 3,245,041 | 9,000,000 | 1,800,000 | 6,835,357,440 | 32 | 934,703 | 643,200,000 | 512,000,000 | 8,893,448,640 | 3 | 0 | 723,500 | 562,200 | 860,656,320 |
| Indiana | 36 | 1,878,141 | 28,713,255 | 3,461,190 | 7,466,505,408 | 4 | 1,400 | 220,000 | 220,000 | 259,444,224 | 9 | 168,931 | 1,170,000 | 234,000 | 1,307,199,744 | 8 | 59,145 | 16,739,922 | 2,632,390 | 1,721,312,640 | 13 | 1,648,665 | 10,101,000 | 0 | 3,604,777,920 | 2 | 0 | 482,333 | 374,800 | 573,770,880 |
| Iowa | 20 | 726,365 | 62,001,014 | 25,457,514 | 4,391,841,888 | 2 | 40,000 | 108,582 | 0 | 129,722,112 | 3 | 15,278 | 45,000 | 45,000 | 333,036,576 | 7 | 143,424 | 14,647,432 | 7,677,804 | 1,721,312,640 | 8 | 527,663 | 47,200,000 | 17,734,710 | 2,207,770,560 | 0 | 0 | 0 | 0 | 0 |
| Kansas | 14 | 37,312 | 23,242,367 | 40,285,000 | 3,521,206,944 | 0 | 0 | 0 | 0 | 0 | 2 | 17,214 | 1,830,188 | 0 | 352,993,824 | 4 | 0 | 20,294,000 | 40,000,000 | 898,076,160 | 4 | 20,098 | 153,512 | 285,000 | 1,122,595,200 | 4 | 0 | 964,667 | 0 | 1,147,541,760 |
| Kentucky | 15 | 20,530 | 2,394,333 | 534,800 | 3,465,077,184 | 0 | 0 | 0 | 0 | 0 | 3 | 20,000 | 132,000 | 70,000 | 359,230,464 | 6 | 530 | 180,000 | 90,000 | 1,397,007,360 | 4 | 0 | 1,600,000 | 0 | 1,135,068,480 | 2 | 0 | 482,333 | 374,800 | 573,770,880 |
| Louisiana | 32 | 449,421 | 54,946,591 | 7,918,454 | 6,720,603,264 | 0 | 0 | 0 | 0 | 0 | 15 | 127,262 | 13,726,407 | 705,738 | 2,529,581,184 | 11 | 321,030 | 23,017,393 | 0 | 2,469,709,440 | 3 | 0 | 17,479,291 | 6,650,516 | 860,656,320 | 3 | 1,129 | 723,500 | 562,200 | 860,656,320 |
| Maine | 16 | 4,481 | 3,040,657 | 187,400 | 3,722,026,752 | 2 | 0 | 2,000 | 0 | 129,722,112 | 3 | 95 | 300,000 | 0 | 523,877,760 | 1 | 3,000 | 2,092,490 | 0 | 261,938,880 | 9 | 1,276 | 405,000 | 0 | 2,519,602,560 | 1 | 110 | 241,167 | 187,400 | 286,885,440 |
| Maryland | 32 | 238,610 | 95,938,670 | 381,077 | 7,088,565,024 | 1 | 0 | 54,291 | 6,277 | 64,861,056 | 5 | 18,202 | 375,000 | 0 | 512,651,808 | 12 | 162,489 | 25,109,883 | 0 | 2,769,068,160 | 12 | 57,919 | 69,917,163 | 0 | 3,168,213,120 | 2 | 0 | 482,333 | 374,800 | 573,770,880 |
| Massachusetts | 85 | 1,086,063 | 179,462,218 | 35,953,333 | 20,686,934,880 | 3 | 206,695 | 30,000 | 20,000 | 194,583,168 | 9 | 0 | 16,950,000 | 0 | 1,196,187,552 | 29 | 293,348 | 60,682,218 | 0 | 6,935,143,680 | 38 | 583,993 | 98,800,000 | 32,933,333 | 10,639,707,840 | 6 | 2,027 | 3,000,000 | 3,000,000 | 1,721,312,640 |
| Michigan | 45 | 1,445,199 | 71,497,204 | 27,383,052 | 10,345,338,432 | 3 | 600,105 | 162,874 | 31,387 | 194,583,168 | 5 | 0 | 32,500 | 0 | 683,535,744 | 21 | 154,710 | 420,000 | 0 | 5,051,678,400 | 12 | 690,384 | 69,917,163 | 26,602,065 | 3,267,999,360 | 4 | 0 | 964,667 | 749,600 | 1,147,541,760 |
| Minnesota | 27 | 2,354,926 | 90,502,288 | 34,229,250 | 5,736,461,472 | 3 | 6,546 | 162,874 | 41,850 | 194,583,168 | 4 | 186,493 | 3,660,375 | 0 | 452,780,064 | 10 | 1,459,695 | 34,000,000 | 34,000,000 | 2,357,449,920 | 9 | 702,192 | 52,437,872 | 0 | 2,444,762,880 | 1 | 0 | 241,167 | 187,400 | 286,885,440 |
| Mississippi | 19 | 52,593 | 42,547,134 | 2,161,692 | 4,208,484,672 | 3 | 7,690 | 162,874 | 0 | 194,583,168 | 4 | 0 | 456,000 | 0 | 808,268,544 | 6 | 9,664 | 12,554,942 | 1,974,292 | 1,484,320,320 | 5 | 0 | 29,132,151 | 0 | 1,434,427,200 | 1 | 35,239 | 241,167 | 187,400 | 286,885,440 |
| Missouri | 44 | 1,182,036 | 42,263,289 | 3,279,827 | 9,616,898,880 | 2 | 44,979 | 108,582 | 0 | 129,722,112 | 11 | 259,000 | 9,350,000 | 345,027 | 1,629,010,368 | 13 | 781,171 | 27,202,374 | 0 | 2,818,961,280 | 16 | 96,886 | 5,120,000 | 2,560,000 | 4,465,434,240 | 2 | 0 | 482,333 | 374,800 | 573,770,880 |
| Montana | 10 | 7,037 | 27,733,731 | 6,732,072 | 2,189,060,640 | 1 | 1,020 | 54,291 | 6,277 | 64,861,056 | 2 | 120 | 1,830,188 | 75,279 | 352,993,824 | 4 | 1,897 | 8,369,961 | 0 | 947,969,280 | 3 | 4,000 | 17,479,291 | 6,650,516 | 823,236,480 | 0 | 0 | 0 | 0 | 0 |
| Nebraska | 16 | 295,757 | 41,618,956 | 0 | 3,668,391,648 | 0 | 0 | 0 | 0 | 0 | 4 | 48,000 | 3,660,375 | 0 | 674,804,448 | 6 | 219,340 | 3,000,000 | 0 | 1,347,114,240 | 6 | 28,417 | 34,958,581 | 0 | 1,646,472,960 | 0 | 0 | 0 | 0 | 0 |
| Nevada | 17 | 1,516,604 | 50,709,845 | 11,648,784 | 3,793,124,448 | 0 | 0 | 0 | 0 | 0 | 3 | 149 | 2,745,281 | 564,590 | 412,865,568 | 9 | 214,089 | 18,832,413 | 0 | 1,958,304,960 | 5 | 1,302,366 | 29,132,151 | 11,084,194 | 1,421,953,920 | 0 | 0 | 0 | 0 | 0 |
| New Hampshire | 10 | 67,951 | 38,417,206 | 21,109,398 | 2,497,150,656 | 0 | 0 | 0 | 0 | 0 | 1 | 0 | 915,094 | 0 | 202,067,136 | 4 | 59,210 | 8,369,961 | 1,316,195 | 960,442,560 | 5 | 8,741 | 29,132,151 | 19,793,203 | 1,334,640,960 | 0 | 0 | 0 | 0 | 0 |
| New Jersey | 56 | 394,405 | 117,032,494 | 41,725,697 | 12,770,144,064 | 3 | 0 | 162,874 | 18,832 | 194,583,168 | 11 | 24,176 | 9,436,680 | 517,541 | 2,060,585,856 | 23 | 164,865 | 13,486,556 | 5,157,704 | 5,163,937,920 | 16 | 204,706 | 93,222,884 | 35,469,420 | 4,490,380,800 | 3 | 658 | 723,500 | 562,200 | 860,656,320 |
| New Mexico | 19 | 848,444 | 20,248,958 | 9,150,116 | 4,153,602,240 | 1 | 0 | 35,000 | 0 | 64,861,056 | 4 | 0 | 20,000 | 0 | 646,115,904 | 7 | 3,997 | 1,750,000 | 1,750,000 | 1,434,427,200 | 3 | 844,447 | 17,479,291 | 6,650,516 | 860,656,320 | 4 | 0 | 964,667 | 749,600 | 1,147,541,760 |
| New York | 116 | 2,979,664 | 355,784,541 | 18,224,402 | 26,009,283,456 | 3 | 3,465 | 162,874 | 62,775 | 194,583,168 | 27 | 448,312 | 28,188,000 | 950,400 | 4,048,826,688 | 44 | 1,304,528 | 315,186,667 | 16,086,827 | 10,090,883,520 | 36 | 1,205,086 | 10,800,000 | 0 | 9,953,677,440 | 6 | 18,273 | 1,447,000 | 1,124,400 | 1,721,312,640 |
| North Carolina | 55 | 2,410,398 | 47,430,438 | 1,124,400 | 11,928,197,664 | 5 | 816 | 12,500 | 0 | 324,305,280 | 10 | 3,477 | 9,150,938 | 0 | 1,400,749,344 | 21 | 389,429 | 14,070,000 | 0 | 4,839,632,640 | 13 | 2,008,670 | 22,750,000 | 0 | 3,642,197,760 | 6 | 8,006 | 1,447,000 | 1,124,400 | 1,721,312,640 |
| North Dakota | 3 | 0 | 13,745,350 | 4,433,678 | 773,343,360 | 0 | 0 | 0 | 0 | 0 | 0 | 0 | 0 | 0 | 0 | 1 | 0 | 2,092,490 | 0 | 199,572,480 | 2 | 0 | 11,652,860 | 4,433,678 | 573,770,880 | 0 | 0 | 0 | 0 | 0 |
| Ohio | 58 | 1,649,785 | 127,964,608 | 111,941,438 | 12,101,576,256 | 5 | 0 | 271,456 | 0 | 324,305,280 | 13 | 11,135 | 975,000 | 162,500 | 1,648,967,616 | 21 | 154,095 | 43,942,296 | 0 | 4,777,266,240 | 14 | 1,458,710 | 81,570,023 | 110,841,938 | 3,916,609,920 | 5 | 25,845 | 1,205,833 | 937,000 | 1,434,427,200 |
| Oklahoma | 25 | 224,175 | 73,838,705 | 187,400 | 6,025,841,568 | 0 | 0 | 0 | 0 | 0 | 4 | 0 | 3,660,375 | 0 | 512,651,808 | 8 | 59,245 | 20,000 | 0 | 1,870,992,000 | 12 | 164,930 | 69,917,163 | 0 | 3,355,312,320 | 1 | 0 | 241,167 | 187,400 | 286,885,440 |
| Oregon | 20 | 840,099 | 33,794,932 | 12,373,781 | 4,247,151,840 | 3 | 2,000 | 150,000 | 31,387 | 194,583,168 | 3 | 38,387 | 2,745,281 | 0 | 472,737,312 | 6 | 5,000 | 1,044,000 | 696,000 | 1,372,060,800 | 5 | 794,712 | 29,132,151 | 11,084,194 | 1,347,114,240 | 3 | 0 | 723,500 | 562,200 | 860,656,320 |
| Pennsylvania | 68 | 801,363 | 71,870,886 | 54,532,027 | 14,868,149,760 | 6 | 30,051 | 39,000 | 19,500 | 389,166,336 | 12 | 0 | 11,352,000 | 76,000 | 1,768,711,104 | 22 | 425,049 | 5,799,053 | 2,899,527 | 4,976,838,720 | 23 | 344,172 | 53,475,000 | 50,600,000 | 6,299,006,400 | 5 | 2,091 | 1,205,833 | 937,000 | 1,434,427,200 |
| Rhode Island | 7 | 3,285 | 16,544,922 | 4,769,004 | 1,310,941,728 | 1 | 0 | 54,291 | 6,277 | 64,861,056 | 3 | 0 | 2,745,281 | 0 | 472,737,312 | 1 | 142 | 2,092,490 | 329,049 | 199,572,480 | 2 | 3,143 | 11,652,860 | 4,433,678 | 573,770,880 | 0 | 0 | 0 | 0 | 0 |
| South Carolina | 20 | 12,333,309 | 66,904,002 | 6,768,375 | 4,623,844,896 | 2 | 0 | 70,000 | 0 | 129,722,112 | 2 | 0 | 1,830,188 | 0 | 352,993,824 | 6 | 12,331,072 | 12,554,942 | 6,580,975 | 1,284,747,840 | 9 | 2,237 | 52,437,872 | 0 | 2,569,495,680 | 1 | 0 | 11,000 | 187,400 | 286,885,440 |
| South Dakota | 3 | 0 | 3,061,875 | 366,688 | 371,703,744 | 1 | 0 | 54,291 | 0 | 64,861,056 | 1 | 0 | 915,094 | 37,639 | 119,743,488 | 1 | 0 | 2,092,490 | 329,049 | 187,099,200 | 0 | 0 | 0 | 0 | 0 | 0 | 0 | 0 | 0 | 0 |
| Tennessee | 26 | 635,173 | 69,334,733 | 962,200 | 6,286,533,120 | 0 | 0 | 0 | 0 | 0 | 4 | 0 | 1,200,000 | 400,000 | 623,664,000 | 8 | 4,120 | 3,144,000 | 0 | 1,758,732,480 | 11 | 208,522 | 64,090,733 | 0 | 3,043,480,320 | 3 | 422,531 | 900,000 | 562,200 | 860,656,320 |
| Texas | 130 | 4,897,639 | 157,747,185 | 13,262,195 | 29,158,786,656 | 2 | 40,000 | 108,582 | 0 | 129,722,112 | 33 | 16,142 | 1,237,500 | 57,750 | 4,880,794,464 | 52 | 1,462,539 | 135,940,103 | 2,862,945 | 12,124,028,160 | 37 | 3,282,958 | 20,239,000 | 10,119,500 | 10,302,929,280 | 6 | 96,000 | 222,000 | 222,000 | 1,721,312,640 |
| Utah | 14 | 1,106,757 | 39,315,232 | 26,600,934 | 3,472,561,152 | 0 | 0 | 0 | 0 | 0 | 2 | 320,000 | 1,830,188 | 376,394 | 241,981,632 | 5 | 770,225 | 2,285,296 | 2,285,296 | 1,259,801,280 | 6 | 16,532 | 34,958,581 | 23,751,844 | 1,683,892,800 | 1 | 0 | 241,167 | 187,400 | 286,885,440 |
| Vermont | 3 | 0 | 8,834,014 | 2,583,527 | 713,471,616 | 0 | 0 | 0 | 0 | 0 | 1 | 0 | 915,094 | 37,639 | 202,067,136 | 1 | 0 | 2,092,490 | 329,049 | 261,938,880 | 1 | 0 | 5,826,430 | 2,216,839 | 249,465,600 | 0 | 0 | 0 | 0 | 0 |
| Virginia | 32 | 441,939 | 108,753,123 | 7,677,804 | 7,673,561,856 | 1 | 0 | 54,291 | 0 | 64,861,056 | 4 | 10 | 3,660,375 | 0 | 623,664,000 | 14 | 428,737 | 29,294,864 | 7,677,804 | 3,417,678,720 | 13 | 13,192 | 75,743,593 | 0 | 3,567,358,080 | 0 | 0 | 0 | 0 | 0 |
| Washington | 47 | 702,091 | 18,911,714 | 791,828 | 10,821,817,728 | 1 | 0 | 10,000 | 10,000 | 64,861,056 | 11 | 499,878 | 4,087,047 | 32,228 | 1,489,309,632 | 12 | 50,676 | 7,200,000 | 0 | 2,918,747,520 | 19 | 151,095 | 6,650,000 | 0 | 5,201,357,760 | 4 | 442 | 964,667 | 749,600 | 1,147,541,760 |
| West Virginia | 6 | 9,991 | 13,989,517 | 4,953,127 | 1,419,459,264 | 0 | 0 | 0 | 0 | 0 | 2 | 0 | 3,000 | 3,000 | 321,810,624 | 1 | 0 | 2,092,490 | 329,049 | 236,992,320 | 2 | 6,079 | 11,652,860 | 4,433,678 | 573,770,880 | 1 | 3,912 | 241,167 | 187,400 | 286,885,440 |
| Wisconsin | 27 | 23,449,113 | 98,572,004 | 1,327,542 | 6,030,830,880 | 2 | 10,201 | 108,582 | 12,555 | 129,722,112 | 4 | 497 | 56,000,000 | 752,787 | 674,804,448 | 8 | 21,007,021 | 16,739,922 | 0 | 1,646,472,960 | 10 | 2,430,390 | 25,000,000 | 0 | 2,719,175,040 | 3 | 1,004 | 723,500 | 562,200 | 860,656,320 |
| Wyoming | 3 | 0 | 3,248,751 | 187,400 | 674,804,448 | 0 | 0 | 0 | 0 | 0 | 1 | 0 | 915,094 | 0 | 150,926,688 | 1 | 0 | 2,092,490 | 0 | 236,992,320 | 0 | 0 | 0 | 0 | 0 | 1 | 0 | 241,167 | 187,400 | 286,885,440 |
How does 2022 look so far?
When we compare all of the figures from previous years, 2022 is looking very quiet (so far). However, as some attacks are late to be confirmed, we do expect these figures to grow in the coming months. And, as we have seen, hackers do appear to be more targeted in their approach, suggesting a reduction in the volume of attacks but an increase in the success and impact of each individual attack.
Outside of the US, we can see the targeted nature of hackers with recent ransom requests of $75 million to Oil India Limited, $15 million to Delta Electronics of Taiwan and TransUnion South Africa, and $10 million (raised to $20 million) to the Costa Rican government.
| Year | # of Attacks | # of Records Affected | # of Reports Where Records Affected Indicated | Average # of Records Affected | Total Ransom Demanded (Known Cases) | # of Known Ransom Demands | Average Ransom Demand ($) | # of Confirmed Ransom Payments | # of Known Ransom Payment Amounts | Total Ransom Paid | Average Ransom Payment | # of Confirmed Non-Payments | % of Known Payments That Are Paid | Estimated Ransom Demanded ($) | Estimated Ransom Paid ($) | Estimated Downtime (Days) | Estimated Downtime Cost ($) |
|---|---|---|---|---|---|---|---|---|---|---|---|---|---|---|---|---|---|
| 2018 | 112 | 1,383,790 | 34 | 40,700 | 1,085,824 | 20 | 54,291 | 16 | 9 | 188,324 | 20,925 | 38 | 0.30 | 6,080,614 | 694,396 | 582 | 7,264,438,272 |
| 2019 | 336 | 3,419,238 | 66 | 51,807 | 43,009,409 | 47 | 915,094 | 31 | 16 | 3,011,149 | 188,197 | 124 | 0.20 | 307,471,520 | 12,646,826 | 4,080 | 50,888,487,744 |
| 2020 | 620 | 50,175,017 | 228 | 220,066 | 89,977,082 | 43 | 2,092,490 | 34 | 20 | 21,936,582 | 1,096,829 | 78 | 0.30 | 1,297,343,976 | 206,438,908 | 11,356 | 141,646,567,680 |
| 2021 | 576 | 34,142,385 | 239 | 142,855 | 145,660,756 | 25 | 5,826,430 | 20 | 8 | 63,338,250 | 7,917,281 | 52 | 0.28 | 3,356,023,818 | 1,266,765,000 | 12,781 | 159,420,991,680 |
| 2022 | 112 | 2,551,796 | 25 | 102,072 | 1,447,000 | 6 | 241,167 | 3 | 3 | 937,000 | 312,333 | 2 | 0.60 | 27,010,667 | 20,988,800 | 2,576 | 32,131,169,280 |
| TOTALS | 1,756 | 91,672,226 | 592 | 154,852 | 281,180,071 | 141 | 1,994,185 | 104 | 56 | 89,411,305 | 1,596,630 | 294 | 0.26 | 4,993,930,596 | 1,507,533,930 | 31,375 | 391,351,654,656 |
So while things are on the low and quiet side so far in 2022, with the likely confirmation of more ransom payments in the coming months, we expect these figures to rise.
Methodology
Using state data breach reports, company and industry news, and cybersecurity databases, our researchers have collated a list of ransomware attacks on US organizations. From these, we are sometimes able to find out the ransom amounts demanded, the ransoms paid, and whether or not the ransom was paid. From these figures, we were able to create averages for ransom amounts demanded and paid.
Using Coveware’s quarterly reports for downtime figures, we created estimated downtimes caused by each quarter of the year. Then, using an average cost per minute of downtime ($8,662) from a recent report, we were then able to create estimates as to how much this may have cost US organizations. This only took into consideration the amount of downtime schools suffered due to ransomware attacks–it does not cover the recovery period and expenses that follow.
While Coveware releases quarterly reports for ransomware downtime figures, these only started in Q3 2018, so for 2018, we used the average of Q3 (4.2) and Q4 (6.2) reports for the full year (5.2).
Furthermore, for one case in 2018 and two cases in 2019, we have been unable to determine the month of the ransomware attack. In these cases the yearly average for downtime has been applied. For example, in 2019, each was assigned the average downtime of 11.3 (based on Q1 = 7.3, Q2 = 9.6, Q3 = 12.1, Q4 = 16.2).
Where possible, we have assigned the attack to the month in which it happened. However, in some cases, the attack may have been assigned to the month in which it was reported due to a lack of data.
Texarkana Water Utility was omitted from state-specific figures in 2020 due to it affecting two states–Texas and Arkansas.
For a full list of sources, please request access here.
Data researcher: Rebecca Moody