
Data usage is a vital metric that needs to be tracked in order to watch over a network effectively.
This activity is important, whether you are managing a home network, overseeing enterprise bandwidth, or ensuring compliance with data limits set by your internet service provider (ISP).
Here’s a list of the best network data usage meters & related tools:
- Paessler PRTG Network Monitor EDITOR’S CHOICE Our top pick out of current data usage meters. Network management software with bandwidth monitoring, threshold-based alerts, reporting, out-of-the-box monitoring templates, and more. Start a 30-day free trial.
- ManageEngine NetFlow Analyzer Bandwidth monitoring tool with traffic shaping policies, reporting, threshold-based alerts, and more.
- WhatsUp Gold Network monitoring tool with network traffic monitoring with alerts, reports, and more.
- Wireshark Open-source network analyzer with deep packet inspection for monitoring network traffic.
- SolarWinds Network Bandwidth Analyzer Pack One of the best bandwidth monitoring software with a performance analysis dashboard, alerts, reports, and more.
- Colasoft Capsa Network analyzer with traffic monitoring that supports over 1800 different protocols, alerts, graphs, and more.
- NetWorx Network bandwidth monitoring utility with a speed meter, alerts system, usage reports, and more.
With increasing reliance on cloud services, streaming platforms, and remote work solutions, staying within data caps while maintaining network performance is more important than ever. This is where data usage meters come into play, offering tools to track, analyze, and manage network bandwidth effectively.
Live Traffic Monitoring
Data usage meters help identify heavy data-consuming devices, applications, and users on your network, enabling you to optimize bandwidth allocation and avoid unnecessary costs. They are also instrumental in detecting unusual traffic patterns that may signal security threats, such as malware or unauthorized access.
Whether you need a lightweight solution for monitoring your home internet usage or an enterprise tool for managing a large-scale corporate network, the right data usage meter can make all the difference. Many tools offer real-time data tracking and customizable alerts to ensure you stay informed and in control. Advanced features like traffic shaping, usage forecasting, and integration with network management platforms further enhance their utility.
Capacity Planning
For businesses, these tools provide insights into network performance, supporting informed decision-making for capacity planning and upgrades. Past data usage records build up over time to show clear capacity requirement trends. Segmenting those records by application, source, and destination provides more fine-grained requirements when planning an extension of services or an addition to the office network.
Track Data Usage
In this guide, we’ll explore the best data usage meters available today, highlighting their features, pros, and cons to help you find the perfect solution for your needs. From free tools to enterprise-grade software, we’ll cover a range of options tailored to different environments and requirements. By the end, you’ll have a clear understanding of the top choices and how they can help you monitor and manage your network effectively.
The Best Data Usage Meters for Monitoring Network Bandwidth
Let’s take a look at seven of the best data usage meters and how to get the best out of these network tools.
Our methodology for selecting data usage metering tools
We reviewed the market for data usage meters and analyzed the options based on the following criteria:
- The ability to communicate with switches and routers using data flow protocols, such as NetFlow, sFlow, and J-Flow
- Options for implementing traffic shaping measures
- Protocol analysis to identify traffic volumes per application
- Quality of Service measured
- Routines for examining VLAN traffic, particularly for voice circuits
- A free trial for a risk-free assessment period or a money-back guarantee
- A price that is reflected in the number of functions present to offer value for money
As part of our comparison, we’ve looked out for software with NetFlow Top Talkers features. This helps you find which users/network devices are consuming the most bandwidth so you can eliminate bandwidth hogging and optimize your bandwidth usage. We’ve also included tools with features that make usage monitoring easier, such as graphs, alerts, and reports.
1. Paessler PRTG Network Monitor (FREE TRIAL)

Paessler PRTG Network Monitor is a network management tool that allows you to monitor network bandwidth usage. Paessler PRTG Network Monitor lets you monitor upload/download speeds, and SNMP/NetFlow/WMI bandwidth usage in real-time. Features like reports allow you to schedule traffic reports daily, weekly, or monthly and export them in a range of formats including PDF, HTML, XMP, and CSV.
Key features:
- Flexible package: Buy an allowance of sensors and decide which to activate
- Traffic flow analysis: Extracts traffic data from switches with flow protocols
- VoIP quality statistics: MOS and IP-SLA
- Segment traffic statistics: Examine data throughput per protocol or source and destination
Why do we recommend it?
Paessler PRTG Network Monitor provides a bundle of tools and you choose which to activate. The system includes a number of data throughput sensors that can tell you which protocols and endpoints are generating the most traffic. These sensors use NetFlow, IPFIX, and other traffic sampling protocols.
The software comes with a range of bandwidth monitoring sensors configured out of the box including the Packet Sniffer Sensor, SNMP Library Sensor, NetFlow V9 Sensor, IPFIX Sensor, jFlow v5 Sensor, sFlow sensor, and more. Each of these sensors displays different performance metrics. For example, the network packet capture sensor can show you a range of traffic types including Chat, Citrix, FTP, SNMP, ICMP, DHCP, DNS, HTTP, HTTPS, RDP, SSH, and more.
You can also view a breakdown of the Top Talkers, Top Connections, and Top Protocols with pie charts within the sensor. You can use a threshold-based alerts system to set trigger conditions so that the program will send you notifications by email, SMS, push messages, Slack messages, and more. More general monitoring takes place through the dashboard, which is completely customizable.
Who is it recommended for?
The PRTG package runs on Windows Server, but it is also available as a SaaS package. You only pay for the number of sensors that you want to activate and if you only use 100 the system is free of charge. This makes PRTG suitable for businesses of all sizes.
Pros:
- Free option: No charge for up to 100 sensors
- Deployment choices: Sign up for a SaaS package or pay for the software to run on Windows Server
- Historical analysis: Store statistics for trend analysis
- Measure throughput: Ensure that devices are not overloaded
Cons:
- A large number of monitoring tools in one bundle: No one will ever need all of the sensors in the PRTG pack
The platform comes free for less than 100 sensors. Prices start at $1,750 (£1,410) for 500 sensors. You can download a free 30-day trial.
EDITOR'S CHOICE
Paessler PRTG Network Monitor is our top pick for a data usage meter because it offers a comprehensive and highly customizable solution for monitoring network performance. The package includes detailed insights into data consumption across an organization’s infrastructure. PRTG’s powerful monitoring capabilities extend beyond simple data usage tracking. The system provides real-time visibility into network traffic, bandwidth usage, and system performance, making it ideal for ensuring efficient data management. PRTG supports multiple monitoring protocols such as SNMP, WMI, and NetFlow. These features allow you to track data usage across a wide variety of devices, including routers, switches, and servers. Its flexibility enables you to monitor not just data consumption but also network health, helping to identify potential issues before they impact operations. Customizable alerts allow network administrators to set thresholds for data usage, ensuring they are notified of any abnormal traffic patterns or potential overages, which is essential for proactive management. With detailed reports and data visualization features, PRTG provides clear, actionable insights into how data is being used, helping organizations make informed decisions about their network infrastructure. The platform also supports long-term data retention, allowing businesses to analyze historical data trends and optimize their network for future growth. setting up and configuring data usage meters is a straightforward task that doesn’t require deep technical expertise. PRTG’s scalability ensures it can accommodate both small and large networks, providing a reliable solution for organizations of any size. For those seeking a reliable, flexible, and efficient data usage meter, Paessler PRTG Network Monitor is the ideal choice.
Download: Get a 30-day free trial
Official Site: https://www.paessler.com/download/prtg-download?download=1
OS: Windows Server and SaaS
2. ManageEngine NetFlow Analyzer

ManageEngine NetFlow Analyzer is a real-time bandwidth monitoring tool that supports NetFlow, sFlow, IPFIX, Netstream, J-Flow, AppFlow, and more. With ManageEngine NetFlow Analyzer you can analyze router traffic and see what interfaces are contributing. Threshold-based alerting allows you to set network bandwidth utilization limits for groups of network devices.
Key features:
- Flow protocols: NetFlow, IPFIX, sFlow, J-Flow, NetStream, and AppFlow
- VoIP quality assessments: IP-SLA and MOS
- Segment traffic data: See traffic volumes per protocol
Why do we recommend it?
ManageEngine NetFlow Analyzer is a major trivial to the SolarWinds NetFlow Traffic Analyzer, which is part of the Network Bandwidth Analyzer Pack. You can extract traffic statistics from network devices with this tool and identify traffic per endpoint. You can also get QoS statistics for VoIP traffic.
Traffic shaping policies enable you to filter router traffic from Layer 4 applications based on source, destination address, port, and protocol. You can use the policies to decide what packets are permitted and block those from non-essential applications. Implementing QoS controls ensures that your network resources are optimized.
The reporting feature provides you with additional bandwidth analysis capabilities. For example, you can create bandwidth capacity planning reports that allow you to forecast future traffic usage so that you can take steps to prepare your bandwidth to cope when the time comes.
Who is it recommended for?
This tool is suitable for all types of businesses that run a network. The system can be used to identify priority traffic and introduce traffic shaping. It is also a useful system for checking on unusual patterns of behavior, which could indicate an account takeover or an insider threat.
Pros:
- Examine external traffic: Measure traffic volumes in and out of the network
- Historical analysis: Store metrics for trend analysis
- Deployment options: Download onto Windows Serer or Linux or get it as a service on AWS
Cons:
- No SaaS option: The AWS cloud option isn’t a SaaS package
ManageEngine NetFlow Analyzer is an excellent network analyzer for enterprises of all sizes. Prices start at $595 (£479) with support for up to 50,000 flows. The program is available for Windows and Linux. You can download the 30-day free trial version from this link here.
3. WhatsUp Gold
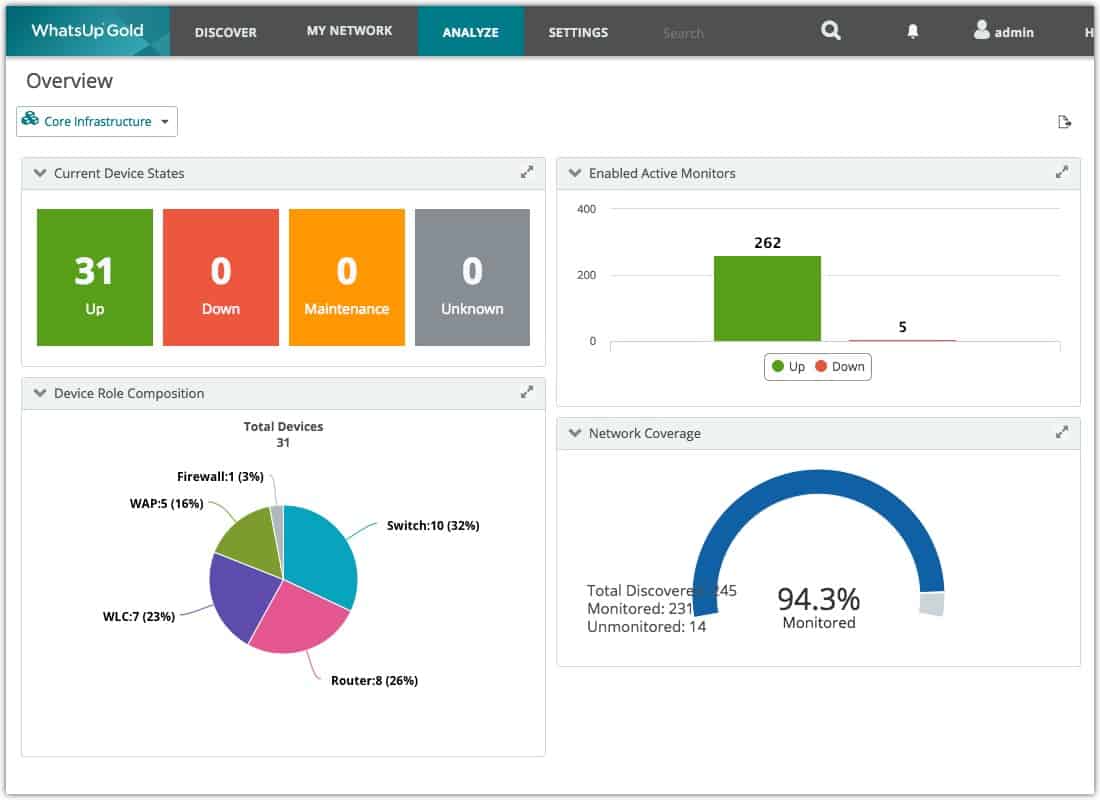
WhatsUp Gold is a network monitoring tool that can monitor network traffic. WhatsUp Gold enables you to breakdown traffic into users, applications, and protocols, to see through the drag-and-drop dashboard who is consuming the most bandwidth. With the Traffic Analysis dashboard, you can view displays on the Top Interfaces By Traffic and Top Conversations to see where most of your network activity is coming from.
Key features:
- Checks traffic volumes: Garthers data per interface
- Traffic data segmentation: See traffic per protocol
- Historical analysis: Identify throughput trends
Why do we recommend it?
WhatsUp Gold has a base package that provides network device management. You can get data usage statistics from this but the is greater detail available on network activity if you also buy the Bandwidth Monitoring add-on. This provides statistics protocols, such as NetFlow and IPFIX, and includes QoS metrics.
A real-time bandwidth monitor with a threshold-based alerts system notifies you the moment there is a problem with network traffic. You can set the program to send you an alert whenever a user exceeds a bandwidth threshold. Alerts are available by email, SMS message, Slack message, and more. You can even configure automated responses such as restarting applications with PowerShell scripts.
Out-of-the-box reports allow you to take a closer look at long-term traffic trends. Reports can be added to the dashboard to provide you with real-time information on performance metrics of your choice.
Who is it recommended for?
This package is suitable for mid-sized and large businesses. There is no free edition or scaled-down package for small businesses. The core package suits single site businesses but a series of add on services enables multi-site WANs to be monitored from one location. This software package runs on Windows Server.
Pros:
- Traffic shaping analysis: Identify scheduled, non-urgent traffic that can be rescheduled for off-peak times
- Quality of Service measurements: Cisco CBQoS
- Protocol analysis: Uses Cisco NBAR
Cons:
- No SaaS option: Only available for Windows Server
WhatsUp Gold is one of the top network monitoring solutions and data usage meters for SMEs. It’s easy to use and highly configurable, and the platform is available for Windows. For pricing information, you need to request a quote from the company directly. You can download the free trial version from this link here.
4. Wireshark
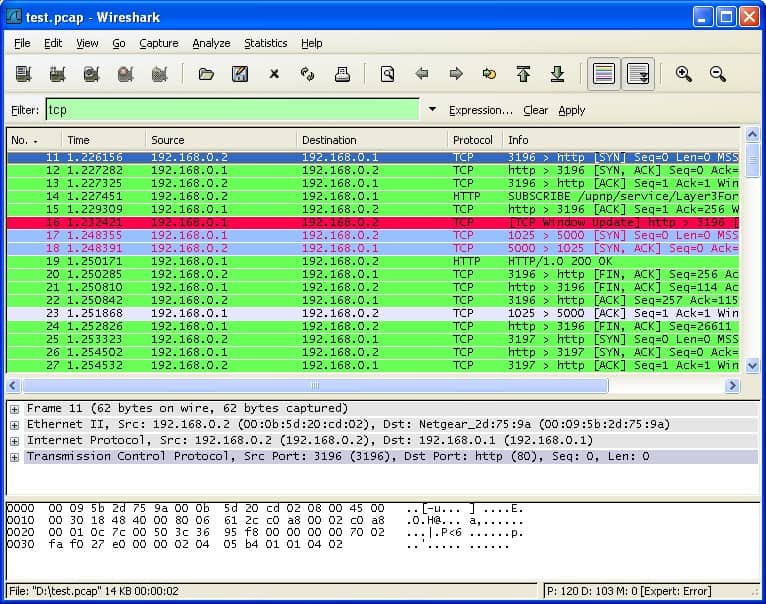
Wireshark is an open-source network analyzer that can be used for deep packet inspection to detect the top talkers in a network. With Wireshark, you can view captured packets, the Source IP, Destination, Protocol, and Information through a GUI or a command-line interface.
Key features:
- Free tool: Long-standing and highly respected but costs nothing
- Packet capture: Filterable packet capture service
- Packet viewer: Color-coded packet display
Why do we recommend it?
Wireshark is great for seeing packets. You can capture and store packets and search through them. However, getting meaningful statistics out of it, such as data usage per endpoint, can be difficult. The Wireshark system has its own searching and filtering language, which can reduce the volume of captured packets.
The tool supports hundreds of protocols including TCP, SNMP, HTTP, DNS, IGMP, and NDNS. Different protocols are color-coded so you can easily see the type of traffic. The colors used can be customized according to your preferences.
When navigating captured data you can use filters. There are two types of filters included with Wireshark: capture filters and display filters. Capture filters allow you to filter the traffic that you capture, and display filters let you filter data you’ve already captured.
Once you’ve finished scanning your traffic, you can export the output in XML, CSV, PostScript, or plain text. Exporting the output enables you to analyze traffic patterns in greater detail externally.
Who is it recommended for?
This system is ideal for gaining insights into traffic patterns but it isn’t a good idea to use Wireshark for ongoing monitoring because the packet capture function generates very large files. The system is free and runs on all the major operating systems, so anyone can access it.
Pros:
- Filtering language: A proprietary query language
- Trace conversations: Follow the exchange of packets between two endpoints
- Multiple platforms: Available for Windows, macOS, Linux, and Unix
Cons:
- No traffic statistics: Shows packets but doesn’t count them
Wireshark is an excellent free alternative and one of the top network bandwidth monitor Tools on the market. It’s easy to use and provides you with extra visibility into the type of traffic traversing your network. The platform is available on Windows, Mac OS, Linux, Solaris, FreeBSD, NetBSD, and more. You can download it for free from this link here.
5. SolarWinds Network Bandwidth Analyzer Pack

SolarWinds Network Bandwidth Analyzer Pack is a set of network bandwidth monitoring tools that lets you monitor traffic patterns throughout your network with a web-based user interface. With SolarWinds Network Bandwidth Analyzer you can identify how much data is being used by what applications. Through the dashboard, you can view graphs and charts on the Top Applications and Endpoints being used within your network.
Key features:
- Data throughput measurements: Records traffic through each interface
- Metrics storage: Save throughput data for historical analysis
- Aggregate data: Calculate throughput per device
- Examine external traffic: Segment traffic data to identify traffic in and out of the network
- Spot traffic surges: Note traffic that exceeds device capacity
Why do we recommend it?
This SolarWinds Network Bandwidth Analyzer Pack provides both network performance monitoring and traffic analysis for networks. The combination provides you with a system inventory and a network topology map and then also a record of all traffic. That traffic log can be segmented by protocol, by source, or by destination.
The software comes with an alerts system that lets you set trigger conditions for when you receive notifications. For example, you can configure the tool to notify you if application traffic increases unexpectedly. Alerts help you to notice traffic surges when they occur.
The reporting feature allows you to create and schedule bandwidth reports. The reports allow you to take a retrospective look at network performance and come packed with visualizations so you can easily see which applications contributed to that traffic.
Who is it recommended for?
This package involves buying two extensive monitoring systems. That provides you with a great deal of functionality and it will take a team to manage the system. So, this solution is probably too big for SMBs and best suited to large organizations. The software runs on Windows Server.
Pros:
- Examine device load: Identify underutilized links
- Alerts for traffic problems: Get notifications by email or SMS
- Root cause analysis: Identify the reasons for jitter or lost packets
- VoIP call quality: Gather MOS or IP-SLA statistics
- Implement traffic shaping: Derive solutions for traffic overloads
Cons:
- No SaaS option: Only available to run on Windows Server
SolarWinds offers a 30-day free trial.
6. Colasoft Capsa
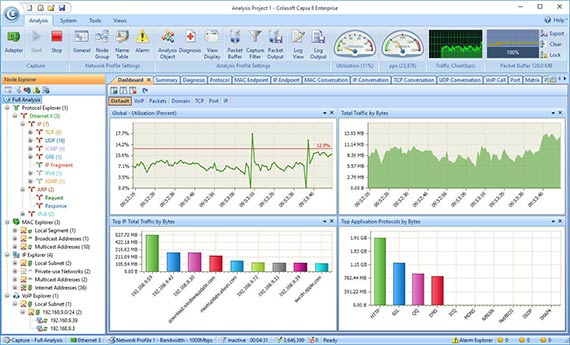
Colasoft Capsa is a network analyzer with traffic monitoring. Colasoft Capsa provides network protocol analysis for over 1800 different protocols so you can take a microscope to your traffic. Visualization options like graphs and charts allow you to view traffic patterns in greater detail.
Key features:
- Packet capture tool: View packets on the network
- Generates traffic throughput graphs: See traffic levels over time
- VoIP analysis: Isolate voice traffic and gather performance statistics
Why do we recommend it?
Colasoft Capsa is a protocol analyzer, which means that it reads passing packets and records information for their headers. Specifically, the tool identifies the port numbers, which identify the protocol of each packet. The tool can also be used to record the traffic volume to and from each endpoint.
You can also see a list of hosts alongside information like traffic, IP address, MAC address, to find out where your traffic is coming from. Endpoints detected by Colasoft Capsa will be displayed alongside real-time traffic and aggregated traffic readings.
The Task Scheduler allows you to schedule packet capture so that you don’t have to be at your desk to record traffic data. You also have notifications that can tell you about any performance issues that emerge. Notifications come in the form of emails and audio sounds.
Who is it recommended for?
The paid version of Colasoft Capsa, called Capsa Enterprise, is a little pricey. This tool gives you wireless packet sniffing and other features, such as port scanning and DDoS detection. However, if you can do without the extras, you should look at Capsa Free. Both versions run on Windows.
Pros:
- User tracking: See traffic from and to a specific endpoint
- Scheduled packet capture: Sample traffic at different times of the day
- Set up alerts: Set thresholds on traffic metrics to trigger alerts
Cons:
- Only available for Windows: No option for Linux
Colasoft Capsa is recommended for enterprises in search of an affordable but effective traffic monitoring solution. Prices start at $995 (£802) for a single perpetual license and the software is available for Windows. You can download the 30-day free trial from this link here.
7. NetWorx
NetWorx is a cross-platform bandwidth monitoring tool that allows you to monitor bandwidth network usage. With NetWorx you can monitor how your bandwidth is consumed. You can also use a speed meter to measure download times to make sure your network is performing as it should.
Key features:
- Multiple platforms: Runs on Windows, macOS, and Linux
- Speed monitor: Live checks on internet speeds
- Traffic totals: See inbound and outbound traffic volumes per day, week, and month
Why do we recommend it?
NetWorx is a good choice for those who want to analyze traffic per protocol or per endpoint. However, it doesn’t do much more than the free Colasoft Capsa and this tool doesn’t have a free version. Evaluate both of these tools side by side to see which is best for you.
To help resolve performance issues, NetWorx has an alerts system. The alerts system uses visual and audio alerts to notify you when a service goes down or the network has an unusual amount of traffic. It can respond by automatically disconnecting from the internet if there’s too much network activity.
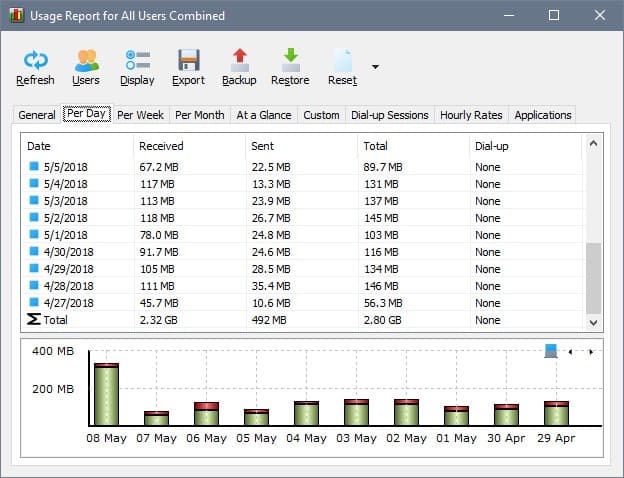
Usage reports allow you to view a table breakdown of traffic usage. The table shows you the amount of data Received, Sent, and Total over a period of time of your choosing. There are also bar charts to show you how much data has been used over time. All of this information can be exported in Word, Excel, or HTML and analyzed elsewhere.
NetWorx is a solution for enterprises that are looking for a low-cost bandwidth monitoring solution. It’s easy to use and it doesn’t cost as much as many other alternative data usage meters on the market. Prices start at $49 (£39) for business users with up to five devices. The software is available for Windows, macOS, and Linux. You can download the free trial version here.
Who is it recommended for?
NetWorx doesn’t have a free edition, so it struggles to compete with Colasoft Capsa. However, this system has the advantage of being available to run on macOS, and Linux as well as Windows. A single license is reasonably priced but a site license is quite expensive.
Pros:
- Alerts for performance problems: Identifies slowing traffic or device shutdown
- Segment data per user: See traffic statistics for a specific workstation
- Protocol analysis: Examine traffic per type
Cons:
- Only available for on-premises installation: No cloud version
Choosing the right data usage meter
With ISP-imposed data usage caps and more bandwidth-hungry apps around than ever before, it’s important to monitor network resources to make sure that your service stays available to employees that need it. The best network usage meters will help you to optimize your network bandwidth usage and monitor what employees are doing.
Our top data usage meters from this article are Paessler PRTG Network Monitor and ManageEngine NetFlow Analyzer. These tools offer enterprises the core capabilities needed to measure traffic usage and find the top talkers in a network – try one today.
Data Usage Meters FAQs
How can I monitor bandwidth usage per device for free?
All network devices have memory and gather statistics on performance. This is how network bandwidth monitors get their source data. So, it is possible to log into the management console on each device and access that information yourself. However, that strategy would be time consuming. A short-term strategy for getting bandwidth monitoring for free is to access one of the tools in our list that offers a free trial.
How do I monitor network bandwidth usage?
The best way to monitor bandwidth usage is to get a specialist monitoring tool, such as those reviewed in this guide. When you check on the suitability of your bandwidth provision, you need to sample data throughput capacity over time. You will particularly be looking for the peaks in demand, when they occur, and how long they last. This information will help you to decide whether to buy extra infrastructure, introduce traffic shaping, or reschedule tasks that are not time sensitive.
How do I find our which users on my LAN are hogging the bandwidth?
The task of tracing activity to specific users is a cross-modular activity that will involve different software packages and lots of note taking and cross-referencing. This is because you will have to use one tool to identify traffic per IP address, another to query the DHCP or ARP server to find out which endpoint is using that address at any one time and then check in your access rights management system to see who is using that device. These three elements need to be recorded over time. It is easier to find an integrated tool or bundle that will do all of that for you.

