The router is the central hub of your network, acting as a highway for all data traveling between your devices and the internet. Every device on your network, whether it’s a computer, smartphone, smart TV, or IoT gadget, relies on the router to communicate with other devices and access online services.
The traffic flowing through your router provides a wealth of information about your network’s activity. By monitoring this traffic, you can gain valuable insights into how your network is being used, spot inefficiencies, and even detect potential security threats.
Monitoring router traffic isn’t just about keeping tabs on who’s consuming the most bandwidth; it’s a vital tool for ensuring the health and security of your network. It can help you identify unusual patterns that may indicate a cyber-attack, such as unauthorized access attempts or data exfiltration. It also allows you to troubleshoot performance issues by pinpointing bottlenecks or identifying devices that may be causing network instability.
Specifically, monitoring router traffic can address the following pain points for your organization.
- No real-time insights into what applications or devices are consuming the most bandwidth.
- Delayed troubleshooting, leading to slowdowns or outages.
- Non-availability of historical data for capacity planning decisions.
- Poor implementation and visibility over the outcomes of QoS policies.
- Possible security blind spots, like imminent DDoS attacks.
- Inability to meet compliance requirements.
You can address the above pain points with the right router traffic monitoring tool.
In this guide, we’ll explore how to monitor router traffic effectively. From understanding the types of data you can collect to using tools that help visualize and analyze network activity, we’ll cover everything you need to know to keep your network running smoothly and securely.
Here’s our list of the best tools for monitoring router traffic:
- ManageEngine NetFlow Analyzer EDITOR’S CHOICE Real-time network monitoring that uses flow data. Able to detect environmental changes and set alerts. Start a 30-day free trial.
- Site24x7 (FREE TRIAL) A full-stack observability service with traffic analysis tools that pull throughput data from switches and routers, while also supporting traffic shaping. Get a 30-day free trial.
- Paessler PRTG Network Monitor Auto-detects and begins monitoring all connected network routers, and offers useful performance data for identifying faults and traffic bottlenecks.
- SolarWinds NetFlow Traffic Analyzer Performs real-time traffic and network bandwidth monitoring and analysis using flow data that is built into most routers.
Key points to consider before choosing tools for monitoring router traffic
Selecting the right router traffic monitoring tool is necessary to address the above-mentioned pain points and to gain the visibility and control required to manage your bandwidth usage and device health. While selecting this tool, here are some factors to consider.
- Compatibility with protocols: Ideally, you’d want a tool that’s compatible with multiple protocols. It will also help if the tool can collate data from SNMP to provide comprehensive insights.
- Granular analysis: The tool must provide granular traffic analysis, like traffic by application, port, IP address, and more. It must also provide the option to drill down into individual data.
- Real-time alerts: Your tool must send alerts in real time, so you can take the required action quickly. This is critical in environments where latency can be costly.
- Reports: it helps to have a tool that can generate extensive reports, making it easy for the concerned stakeholders to understand the current status and take action accordingly.
- QoS and policy validation: If your network uses QoS or traffic shaping, make sure the tool you pick can capture and report the effectiveness of your policies. Analyzing the differences between pre- and post-policy implementation can help you make informed decisions.
- Remote support: If you manage remote devices, check if the tool can support distributed probes and browser-based agents to centrally monitor all locations.
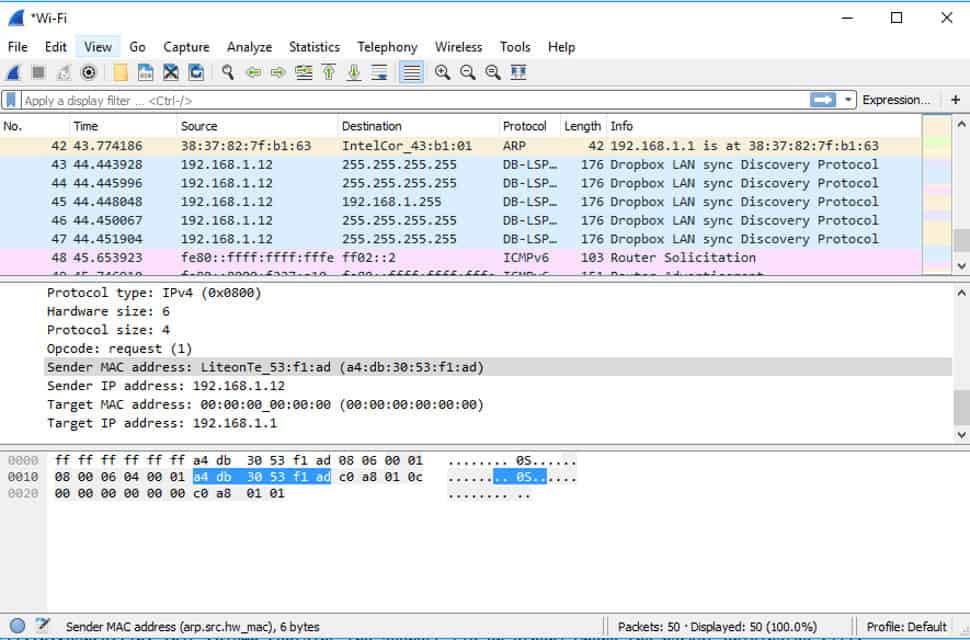
- Alt-text for Wireshark image: A dashboard displaying information about captured packets, including their timestamp, source, destination, length, protocol, and info.
To dive deeper into how we incorporate these into our research and review methodology, skip to our detailed methodology section.
Why do I need to monitor router traffic?
Everyday devices and applications use network traffic to operate and it is important to make sure that network resources are distributed evenly to support all these services.
For example, if you have an application that is eating up a disproportionate amount of available bandwidth, other services will suffer from latency and interruptions. By monitoring router traffic you can identify which application is causing the problem and take steps to return the connection back to normal.
If allowed to go unchecked, bandwidth hogs can take network resources away from other critical network hardware. In other words, regularly monitoring traffic is vital for making sure that network performance stays up to speed.
How to monitor network traffic on your router
When monitoring network traffic you have the choice of monitoring directly through the router or using third-party network monitoring software. In this section, we will look at how you can use a router to monitor your network traffic. Before we begin, it’s important to note that the process will depend on the brand and model of your router. However, there are standard procedures for examining a router regardless of vendor and whether it is a router for a wired or a wireless network:
- If you want to use your router to monitor network traffic then you first need to find your router’s local IP address. If you haven’t changed the IP address then it’s likely to be 192.168.1.1.
- On Windows if you don’t know the IP address then open a command prompt and enter the following command:
C:\Users\Comparitech>ipconfig
You will find your IP address listed next to Default Gateway, which will look something like this:
Default Gateway . . . . . . . . . . . . . . . . : 192.168.1.6
- Now that you have the IP address, open up your web browser and type the IP address into the search bar. Now press Enter.
- A page will display that asks you to enter your router’s admin username and password. If you haven’t configured a unique username and password you should check the router’s documentation to find the default login credentials. (You can also search online for information on a vendor’s factory settings).
- Once logged in you will be able to interact with the router’s interface. What performance data you can view at this stage depends on the vendor who produced it. Try to look for a list of devices or a status section (some modern routers have bandwidth monitoring sections).
- Once you find a section that displays network traffic you can start to look for which devices use the most bandwidth. If you don’t find this information or there isn’t enough detail then you’ll need to use a network monitoring tool instead.
Related post: Wireshark & other top packet sniffers
Capacity planning
Although the quality and bandwidth of the cable in your network is an important factor when examining capacity, traffic monitoring can’t occur directly on the wire. In order to see how much traffic passes down each link, you have to examine the throughput of the routers and switches at each end of the connection.
Information extracted from routers about traffic flows will highlight which links are overloaded and which cables have less traffic. By tracking traffic flows on your network over time, it is possible to see which links are overloaded. This information will enable you to re-organize the network topology to get better value out of your infrastructure.
Capacity planning tools need historical traffic data as input and the best source of this information comes from querying the routers on the network. Many network traffic monitoring tools also include capacity planning utilities so they can collect source information, store, and analyze it in one closed loop.
Wireless networks and wireless routers
The managers of networks that include wireless routers cannot overlook the traffic flow data from those devices. Hybrid networks usually use wireless for the last hop to selected endpoints, so ignoring traffic data from wireless routers would result in an incomplete record of network performance.
Although wireless networks have different operating methods and transmission protocols, the functions of wireless routers are fundamentally the same as those for wired networks. The router has to get a packet of data to the endpoint named as the destination in the packet header.
Just like routers on wired networks, wireless routers measure passing traffic and record metrics about traffic throughput. Network monitoring systems can query wireless routers just as well as standard routers. The premium network monitoring tools include wireless footprint visualizations, which substitute for the network topology maps that they compile for wired networks.
How to monitor network traffic with a packet sniffer (Wireshark)
Monitoring router traffic with a network monitoring tool is the best way to go due to the range of monitoring options you have at your disposal. Wireshark is one of the most popular wifi analyzers or packet sniffers in the world. Many enterprises use this tool to monitor their network traffic.
Wireshark is widely used because it’s free and can reliably monitor network performance. In this section, we’re going to look at how you can use Wireshark to monitor your network.
Before we begin you will need to download and install the program from this link here. During the installation process make sure that you install WinPcap when prompted so you can capture live network traffic.
Now that the program is installed it’s time to start configuring your monitoring settings.
Once you launch Wireshark, under Capture you’ll be shown various types of connections: Bluetooth Network Connection, Ethernet, VirtualBox Host-Only Network, and Wi-Fi.
- The first thing you need to do is choose which type of network you want to monitor – Wi-Fi is used in this example (use the Shift or Ctrl keys to select multiple networks).
- Click the Capture button at the top of the screen.
- Once the drop-down menu displays press Start to start packet capture (or double-click on the network you want to capture data from).
- To stop capturing click on the red Stop button next to the shark fin in the toolbar.
Reading packet data in Wireshark
Now that you’ve captured packets in Wireshark it is time to inspect them. In Wireshark, the data from captured packets is broken down into three different sections. Each of these sections provides you with different information. These sections are:
- Packet List – Located under the search bar. Shows the Number, Time, Source Destination, Protocol, and Info of captured protocols. The packet list section will provide you with the main details you need during monitoring.
- Packet Details – Located under the Packet list pane. Shows the protocols within the selected packet. You can click on the arrow next to packet data to view more information.
- Packet Bytes – Located at the bottom of the screen below the Packet Details pane. Shows the internal data of the packet in hexadecimal format.
These are the three areas where you need to look when monitoring packet captures. It is important to note that Wireshark uses color-coding to help the user distinguish between captured packet types. To find out what each color denotes which packet click on View > Coloring Rules. You can create new rules by pressing the + button or delete rules with the – button.
Using filters in Wireshark
When capturing data in Wireshark you will need to configure a capture filter to limit the information that you collect. To filter packets on Wireshark click the Filter box beneath the toolbar and enter TCP (or another protocol you want to filter for). The TCP search criteria will ensure that only packets using the TCP protocol are captured. You can also use the Bookmark icon on the left of the entry field to activate other popular filters.
In addition, you can apply filters to filter data that has already been recorded. These are called Display filters.
Related: How to conduct a network stability test.
The best router traffic monitoring tools and software
While Wireshark is a good tool it doesn’t offer the variety of features or refined user experience that many other proprietary tools do.
Let’s look at the top alternative tools for monitoring network traffic:
1. ManageEngine NetFlow Analyzer (FREE TRIAL)
Best for: Real-time flow analysis.
Relevant for: Network admins and IT teams managing complex branch and WAN routers.
Price: There are three editions under the annual subscription plan. They are: Standard – Starts at $3,438 for 500 interfaces with two users. Professional – Starts at $245 for 10 interfaces with two users. Enterprise – Starts at $445 for 10 interfaces with two users.
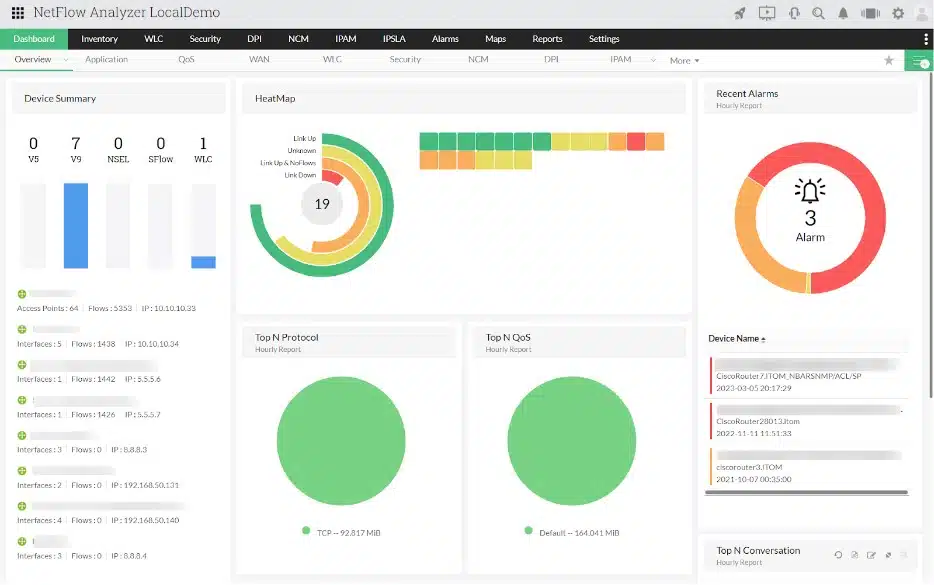
ManageEngine NetFlow Analyzer is a bandwidth usage monitor that analyses network traffic in real-time. The software supports flow data in the form of NetFlow, sFlow, IPFIX, Netstream, jFlow, and AppFlow. All of this information can be viewed from the centralized overview which provides you with a complete view of network usage and performance. For instance, you can view pie charts on the top applications and top protocols within the network.
Key Features:
- Network traffic analysis and bandwidth usage monitoring
- Supports NetFlow, sFlow, IPFIX, Netstream, jFlow, AppFlow, and multi-vendor devices
- Traffic shaping, forecasting, and capacity planning
- Threshold-based alerts to detect performance issues
- Forensics and security analytics
Unique Business Proposition
NetFlow Analyzer supports multiple protocols, including NetFlow, IPFIX, jFlow, and sFlow, through a single console. It offers visibility in real time to enable you to make informed decisions. It comes with an intuitive user interface as well.
Feature in Focus: Real-time Traffic Graphs
A highlight of this tool is its ability to display live graphs of incoming and outgoing traffic, as it happens. You can drill down these graphs to get detailed information, like traffic volume, speed, packet counts, and even the all-important 95th percentile usage. Using this information, you can make informed decisions related to capacity planning, handling traffic spikes, optimizing bandwidth usage, and more.
Why do we recommend it?
ManageEngine NetFlow Analyzer is a very similar product to the SolarWinds NetFlow Traffic Analyzer. In fact, the two are almost identical. ManageEngine has created a very pleasing design for its dashboard screens, crowding in a lot of information by mixing tables of data with charts and dials. This tool is able to sample traffic data and thus analyze router activity.
To monitor changes in your environment, ManageEngine NetFlow Analyzer has threshold-based alerting. You can configure your own threshold values to decide what activity will trigger an alert. For example, you can set a threshold for bandwidth utilization and stipulate the number of times that utilization can be exceeded before an alert is sent onward.
Who is it recommended for?
ManageEngine NetFlow Analyzer is competitively priced and it provides an attractive service that all types of companies with a network can use. Very small businesses that have only two network devices can use the package for free.
Pros:
- Supports both real-time and historical traffic analysis, great for correlating network usage to specific events
- Alerting is intuitive and can be configured to trigger based on condition or threshold
- Available for both Windows and Linux
- Integrates well into the ManageEngine ecosystem
Cons:
- ManageEngine was built for enterprise IT usage and is not ideal for non-technical users or home networks
- Reporting features could be made easier to use
ManageEngine NetFlow Analyzer is available for Windows and Linux in four editions: Free, Standard, Professional, and Enterprise. The Free package is limited to monitoring two network interfaces. Standard and Professional editions are suitable for monitoring a single network and the Enterprise version will cover distributed networks with multiple sites. The Professional edition costs $595 (£467) with 10 licenses for interfaces and support for up to 50k flows. The Enterprise version costs $1,045 (£821) with licenses for 10 interfaces and support for up to 100k flows per collector.
There is also a 30-day free trial version available for download.
EDITOR'S CHOICE
ManageEngine NetFlow Analyzer is our top pick for a router traffic monitor because this tool is able to track traffic all around the network across routers and switches to endpoints and the network gateway. This system provides operational statistics with live displays in the dashboard. The screens for the console provide graphs and charts for network traffic and list the devices. Click on a device to get a details screen and see all of the traffic that goes in and out of each interface with the correspondent’s address on each record. This tool is an on-premises package but it will also run on your AWS or Azure account. Another ManageEngine unit, called OpManager provides network device and server monitoring; if you buy both packages, you will be able to use both of them in a single console. The traffic monitor has a series of performance thresholds and will raise an alert if traffic volumes spike or if throughput speeds drop. These alerts mean that technicians know they will be drawn to the console if needed and can assume that all of the rest of the time, the network is running well.
Download: Get a 30-day free trial
Official Site: https://www.manageengine.com/products/netflow/download.html
2. Site24x7 (FREE TRIAL)
Best for: Comprehensive flow analytics
Relevant for: MSPs and IT teams handling routers across hybrid environments.
Price: The All-In-One Monitoring plan has two editions: Professional, priced at $42, and Enterprise, priced at $625. Both prices are billed annually, per month.
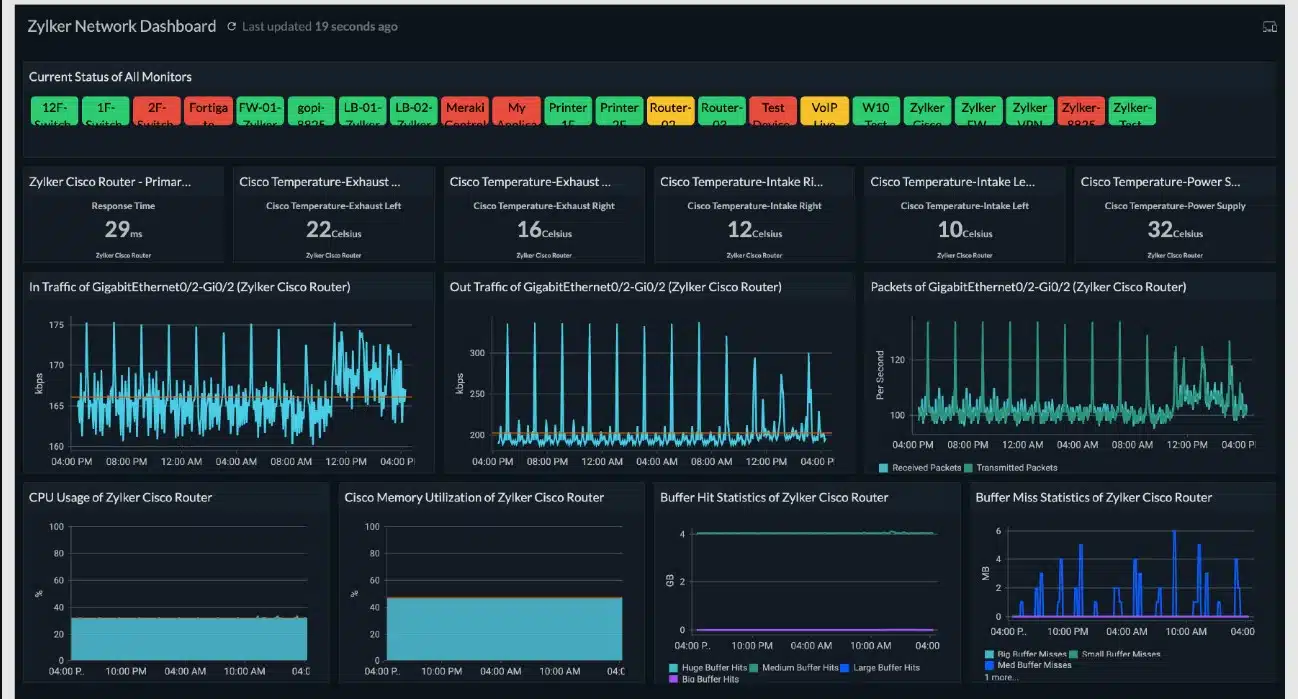
Site24x7 combines several network monitoring functions in one service, including network discovery, device inventory creation, topology mapping, and traffic analysis. For router traffic monitoring specifically, the platform collects throughput information from routers and switches. It communicates through NetFlow, IPFIX, sFlow, J-Flow, and other flow-based reporting technologies. Because it supports multiple standards, Site24x7 can monitor hardware from different vendors within the same environment.
Key Features:
- Automatically discovers devices and records network details
- Works across hardware from multiple vendors
- Helps with forecasting network capacity requirements
- Builds visual topology maps of the network
Unique Business Proposition
Site24x7 combines flow monitoring with metrics from SNMP traps to provide comprehensive visibility into your infrastructure. Its unified dashboard provides real-time insights and historical trends for making informed decisions. Other features like customizable dashboards, customizable alerts, mobile app access, and integrations with popular platforms make it a convenient choice for monitoring router traffic.
Feature in Focus: Customizable Dashboard
A standout feature of this tool is its customizable dashboard that provides a bird’s-eye view of how devices and interfaces use your bandwidth. Specifically, it filters traffic by usage, volume, protocols, IP conversations, and bandwidth consumption. When you combine this information with threshold-based alerts, you can detect network slowdowns, traffic spikes, and other data on each router interface.
Why do we recommend it?
We recommend Site24x7 for router traffic monitoring because it brings together live traffic visibility, proactive alerting, and clear dashboard views. Its support for multiple flow protocols, along with its integration with the rest of the platform, makes it useful for performance optimization and fault investigation.
The platform gives administrators a single view across network activity, which makes it easier to monitor performance consistently and respond to issues without delay. By combining real-time traffic data, alerts, and detailed analytics, Site24x7 provides the tools needed to keep network operations stable and identify developing problems before they spread.
Who is it recommended for?
Site24x7 is a good fit for organizations that need broad network monitoring, continuous traffic analysis, and advance warning of performance issues. It can serve small and mid-sized businesses, large enterprises, and networks with mixed or complex infrastructure, offering a scalable way to maintain visibility and speed up troubleshooting.
Pros:
- Provides immediate visibility into router traffic and wider network performance
- Issues alerts on potential problems so teams can act quickly
- Stores historical data for trend review and performance comparison
- Allows network monitoring and management from mobile devices
Cons:
- Pricing can be misleading because only the smallest businesses pay the advertised rate
Site24x7 structures and prices its plans around very small business usage levels. For example, the Infrastructure Monitoring package is priced at $9 per month. Larger organizations are accommodated through higher-priced tiers. You can evaluate the full system monitoring and management platform with a 30-day free trial.
3. Paessler PRTG Network Monitor
Best for: Flow-based bandwidth monitoring.
Relevant for: Network teams and MSPs managing routers through flow protocols.
Price: The cost depends on the number of aspects used, where each aspect is a specific metric monitored on a device. The starting plan supports 500 aspects and costs $179 per month, paid yearly.
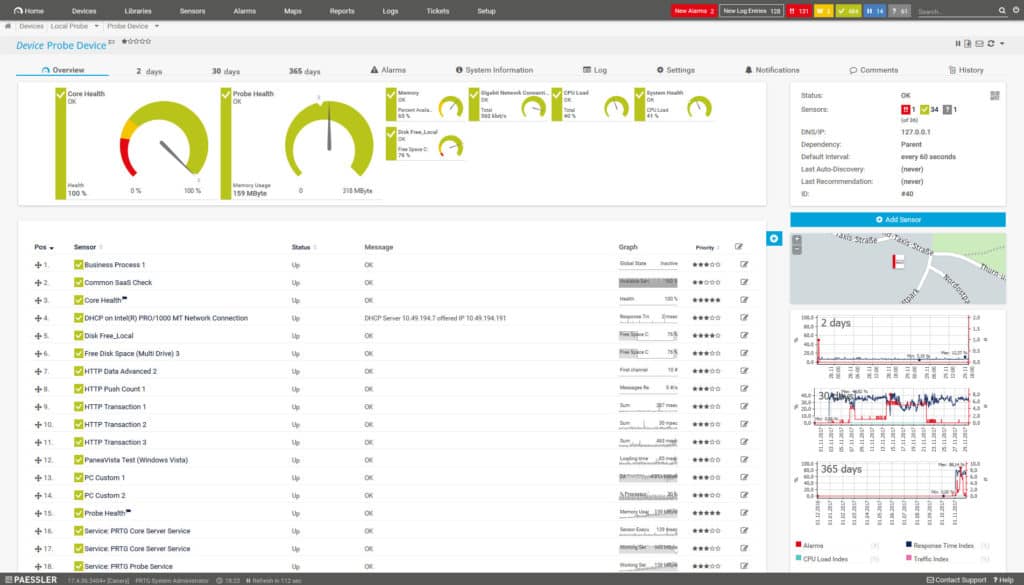
Paessler PRTG Network Monitor is another network usage monitoring tool that can be used to monitor traffic. PRTG Network Monitor uses SNMP, NetFlow, sFlow, and jFlow to monitor network usage and performance. The tool enables the user to measure the bandwidth consumption of devices in the network to make sure no device is using too many resources.
Key Features
- Uses NetFlow, sFlow, J-Flow, and IPFIX
- Live traffic data
- Analytical tools
- Protocol analysis
Unique Business Proposition
PRTG uses built-in NetFlow, IPFIX, sFlow, and jFlow sensors to track router traffic in real time. It provides information about bandwidth used per IP, protocol, and user, using which you can implement appropriate policies to optimize bandwidth usage. It also combines this data with information from SNMP and packet sniffers into a single dashboard.
Feature in Focus: NetFlow Sensors
A highlight of PRTG is its sensors that support modular and customized flow monitoring. In particular, its NetFlow v9 sensor allows you to define specific channels, so you can split the data into meaningful categories. With such filters, you can also monitor only what you need to reduce CPU load.
Why do we recommend it?
Paessler PRTG Network Monitor is a strong rival to the entire Orion platform of SolarWinds products. Rather than offering individual modules for sale, Paessler puts all of its monitoring tools into one bundle. The user buys an allowance of sensors and then decides which of them to turn on. There are many traffic monitoring sensors within the PRTG package.
The SNMP Traffic Sensor comes preconfigured to show traffic data on Traffic in, Traffic out, and Traffic total. These can be expanded to include Errors in and out, Discards in and out, Unicast packets in and out, Non-unicast packets in and out, Multicast packets in and out, Broadcast packets in and out, and Unknown Protocols. You can select between Live Data or Historic Data over a time period of your choice.
Who is it recommended for?
Paessler PRTG is a very flexible package While the SolarWinds system is actually a bundle of monitors, such as a NetFlow monitor and a MOS tracker. The PRTG lets the user choose each element rather than an entire category of tools. Any business would benefit from the use of PRTG. Small businesses that only turn on 100 sensors get the package free forever.
During our testing, we identified the following pros and cons related to PRTG Network Monitor.
Pros:
- Utilizes SNMP, NetFlow, and offers a variety of other protocols to create the most accurate picture of network traffic
- All sensors can be customized, even the preconfigured sensors
- The dashboard is customizable through a series of widgets and feels intuitive out of the box
- Supports a completely free version for up to 100 sensors, making this a good choice for both small and large networks
- Pricing is based on sensor utilization, making this a flexible and scalable solution for larger networks as well as budget-conscious organizations
Cons:
- PRTG is a feature-rich platform that requires time to fully learn all of the features and option available
Paid versions of PRTG Network Monitor start at $1,750 (£1,321) for 500 sensors and one server installation up to $15,500 (£11,701) for 10,000 sensors. There is a 30-day free trial.
4. SolarWinds NetFlow Traffic Analyzer
Best for: Hybrid flow traffic visibility
Relevant for: IT teams of large enterprises and MSPs managing multi-vendor flow environments.
Price: Negotiated pricing.

SolarWinds NetFlow Traffic Analyzer is infrastructure monitoring software that monitors router traffic for a variety of software vendors. The program offers bandwidth and network performance monitoring which can be managed via the performance analysis dashboard. The performance analysis dashboard enables the user to drag and drop performance metrics onto a timeline which shows the general network data trends on the network. When we tested NetFlow Traffic Analyzer we found the following key features.
Key Features
- Link load measurements
- Traffic shaping options
- Graphical data visualizations
- Analytical tools
- WAN management possible
Unique Business Proposition
SolarWinds NTA offers deep router traffic and flow monitoring. It integrates with the SolarWinds Orion platform and supports routers from multiple vendors like Cisco, Juniper, Huawei, NetStream, and more. It gathers and analyzes data from IPv4 and IPv6 routers and displays the results on a unified console.
Feature in Focus: Implementing QoS Policies
A highlight of this tool is its ability to display class-based QoS maps for Cisco routers to better understand how traffic is shaped through your QoS policies. Armed with this data, you can adjust your policies to meet your objectives.
Why do we recommend it?
The SolarWinds NetFlow Traffic Analyzer is able to identify all traffic by source, destination, conversation, and protocol/port number. With these categorizations of traffic, an administrator is able to see where traffic congestion is occurring. Usually, the traffic analyzer queries switches. However, as it labels traffic by IP address, the throughput of the router is also tracked.
SolarWinds NetFlow Traffic Analyzer uses NetFlow, J-Flow, sFlow, NetStream, IPFIX, and SNMP to monitor your network. For bandwidth usage, the platform can identify bandwidth-hogging applications or devices. All of this information can be viewed through the dashboard. You can view pie charts of Top 10 Applications and NetFlow Sources.
Who is it recommended for?
All businesses with a wired network would benefit from using the NetFlow Traffic Analyzer. However, very small businesses with few nodes would probably be better of with a less expensive package – there are even some free rivals on the market.
Pros:
- Built for enterprises and large networks, NTA can support massive streams of data across multiple VLAN, subnets, and WANs
- Intuitive reporting allows for both technical and business-oriented reports to be generated with ease
- Uses drag and drop functionality to customize the look and feel of the product
- Supports a wide range of protocols to discover devices and measure traffic patterns
- Simple bandwidth controls and identity bandwidth hogs and restrict the traffic quickly
Cons:
- This is a highly detailed enterprise tool, and not designed for home users or small LANs
The software starts at a price of $1,072 (£809). There is also a 30-day free trial version you can download.
You can expand your supervision of a network by using the Network Performance Monitor, which is also from SolarWinds. In fact, that package is a prerequisite for installing the NetFlow Traffic Analyzer, so as you progress toward buying that tool, you will realize that you have to buy both. SolarWinds offers these two modules together in a bundle, called the Network Bandwidth Analyzer Pack. The tools slot together in a single dashboard.
Monitoring router traffic with a network monitoring tool
Though there are countless ways to monitor router traffic we recommend that you download a network monitoring tool for the best results. Even the best routers can only show you so much information. Using a specialized network usage monitoring solution will provide you with much better visibility.
Tools like ManageEngine NetFlow Analyzer, Site24x7, Wireshark, PRTG Network Monitor, and SolarWinds NetFlow Traffic Analyzer, are all ideal for monitoring network traffic in modern enterprises.
Our Methodology for Choosing Tools for Monitoring Router Traffic
At Comparitech, we take an unbiased approach and evaluate tools based on their features and relevance to organizations. As a part of our transparency promise, here are the features that were uniformly applied to evaluate all the tools.
1. Coverage
We prioritized tools that collect traffic data from routers through widely supported methods. Beyond collection, we also looked for tools that analyzed the data to provide continuous visibility into network activity across interfaces and connections.
2. Device Discovery and Mapping
We looked for tools that can automatically discover the devices in your network and create a map of their dependencies, so the networking data can have an added context for easy understanding.
3. Usage Breakdown
While it is good to know the flow of traffic in your network, it is even more useful when the top users of this traffic are identified, so you can take the necessary actions and policy implementations. This is why we wanted to present tools that attribute traffic to specific devices, applications, services, interfaces, or user groups, so you can identify sources of congestion and unusual activity.
Threshold-Based Monitoring
We included tools that support automated alerts, threshold policies, and event notifications to help respond quickly to unexpected spikes or abnormal network behavior. Historical Data and Trend Monitoring To get a better understanding of traffic patterns, you need tools that monitor short-term trends as well as long-term historical analysis. The tools on our list were picked to retain and monitor
Broader B2B software selection methodology
The above factors fall in line with our broader B2B software evaluation methodology, where we do detailed research into the features of every tool, followed by hands-on testing where possible. We also consider user reviews, applicability across multiple real-world scenarios, and the reliability of vendors before presenting our list.
Check out our detailed B2B software methodology page to learn more.
Why Trust Us?
We are a leading source of B2B software reviews because our research team spends hours poring through each tool and its performance and user experiences. We are honest and transparent about the process we follow, as we clearly describe the factors that led us to select some tools over others. Such an open approach has made us the preferred source for key decision makers today.
Alt-text for Wireshark image – A dashboard displaying information about captured packets, including their timestamp, source, destination, length, protocol, and info.
Monitor router traffic FAQs
Can router monitoring help prevent network failures?
It is easier to ensure constant network uptime if you have continuous network monitoring. Conditions on routers can deteriorate very quickly and a daily check on network devices isn’t enough to get sufficient warnings about potential points of failure. Network monitoring tools that use performance thresholds will alert technicians when statuses indicate that a problem is evolving, giving time to head off network failure.
How can I monitor network speed?
There are many different measures of network speed. You can monitor speed on a link or speed on a route from one point of a network to another node (end-to-end). NetFlow monitoring systems cover transfer speeds as one of the metrics that they report on. Automated monitoring tools can give constant and comprehensive information about data rates all across the network. However, Ping is a useful tool for monitoring the roundtrip time from one point on a network to another if you want to perform your speed tests manually.
How can I stop connectivity drop-offs in my network?
Dropped connections are much more likely with wifi networks than with wired networks. With wired networks ensure that all routers and switches are functioning correctly and not overloaded. With wireless networks:
- Keep router firmware up-to-date
- Refer to a wireless heatmap to ensure complete signal coverage on the premises
- Add repeaters or extra APs in areas that have no signal
- Inform mobile users of areas of the premises where there is no wifi service
- Ensure wireless routers have sufficient capacity to meet demand
Related post: The Best NetFlow Analyzers & Collectors
