
Cisco Systems produces switches and routers and many other types of network devices. The company has a large catalog of entire network hardware including gateways, firewall, and wireless access points.
Whether you chose Cisco for all of your network equipment or you have the company’s product providing some of your network services, you will need to monitor and manage them.
In this guide, we will explain the options available to you when you search for network monitoring software.
Here is our list of the best Cisco network monitoring tools:
- ManageEngine OpManager EDITOR’S CHOICE This network monitoring software helps IT teams monitor, diagnose, and troubleshoot network performance issues, ensuring optimal uptime, security, and efficiency across IT infrastructure, including devices provided by Cisco Systems by Cisco Systems. Runs on Windows Server, Linux, AWS, and Azure. Download a 30-day free trial.
- Site24x7 Cisco Network Monitoring (FREE TRIAL) Cloud-based all-in-one monitoring system for IT infrastructure, applications, and end users that offers remote monitoring of any network anywhere. Get a 30-day free trial.
- Paessler PRTG Network Monitor (FREE TRIAL) A package of network, server, and application monitors that includes SNMP-based device health monitoring. Download a 30-day free trial.
- Nagios XI This on-premises package provides network, server, and application monitoring with switch status tracking through SNMP and extensions for Cisco monitoring. Runs on Linux.
- N-able N-sight A remote monitoring and management tool that includes monitoring a range of network devices including those produced by Cisco Systems.
- SolarWinds Network Performance Monitor The industry-leading network monitor, which focuses on tracking the health of network devices.
- Datadog Cisco Monitoring A network device monitor that is able to extract information from Cisco Meraki routers and switches using SNMP and by examining the event logs produced by the equipment.
- LogicMonitor A cloud-based network monitoring service that includes device health monitoring and network traffic metrics.
- Zabbix A free network monitor with a good front end that features great live network device status graphs.
The best Cisco network monitoring tools
Our methodology for selecting a Cisco network monitoring tool
We reviewed the Cisco network monitoring software market and analyzed tools based on the following criteria:
- The ability to monitor the statuses of Cisco network devices
- The capability to communicate with the Cisco-friendly traffic sampling protocols NetFlow and IPFIX
- Monitoring other supplier devices as well for multi-vendor environments
- Performance metric logging for historical analysis
- Alerts for performance issues
- An interface that includes data visualizations, such as graphs. As well as lists of statistics
- A free trial period, demo, or money-back guarantee for no-risk assessment
- A good value out of the package of services
You can learn more about each of these tools in the following sections.
1. ManageEngine OpManager (FREE TRIAL)
ManageEngine OpManager is a network and server monitoring package. It is able to manage Cisco ASR series, Catalyst series, Nexus, and UCS devices. This is a general network monitoring tool that can communicate with the devices produced by all suppliers, not just Cisco Systems. It is able to track wireless networks as well as regular LANs by deploying the Cisco WLC system of the company’s wireless access points.
Key Features:
- Virtualization Performance Tracking: Tracks performance metrics of virtualized environments, providing insights into virtualization performance.
- Automated Network Discovery: Automatic identification and mapping of network devices for easier management.
- Alert Management: Customizable alerts for various network events, allowing for proactive problem identification and troubleshooting.
- Performance Management: Monitors network bandwidth usage, CPU utilization, and memory usage to identify potential bottlenecks.
- Tracks All Types of Network Devices: Includes the monitoring of wireless APs.
Why do we recommend it?
ManageEngine OpManager is a package that rivals the SolarWinds Network Performance Manager. This system provides server monitoring as well as network monitoring. The tool includes a discovery cycle that documents each network device and produces a topology map. OpManager is able to present a variety of network plans at different levels and perspectives.
The network monitor can communicate in the Cisco-created protocols NetFlow, IP SLA, CBQoS, and NBAR. The NBAR system is Network Based Application Recognition. This identifies applications in passing traffic running through routers. This system allows you to perform traffic-shaping measures by application, block certain applications, or reroute traffic according to its application.

OpManager enables you to see all of these switch and router settings for all of your devices from one console. The main protocol used by OpManager for network monitoring is SNMP, which means it continues to check constantly on the status of all devices, including those provided by Cisco Systems. As with most SNMP implementations, OpManager compiles a device inventory when it starts in operation. The tool also draws up a network topology map and keeps both the map and the inventory updated though its regular SNMP status enquiries.
Who is it recommended for?
ManageEngine OpManager is a good choice for businesses of any size. The base price for the package provides monitoring for 10 devices, which is a fairly small network. Larger businesses pay more for a higher capacity. There is a Free edition but that will only monitor three devices.
Pros:
- User-Friendly Interface: Intuitive web-based interface for monitoring and managing IT infrastructure, making it accessible to users of all levels of expertise.
- Automation: Provides automation capabilities for routine tasks such as device discovery, configuration management, and alerting, reducing manual effort and errors.
- Integration: Integrates seamlessly with other ManageEngine products and third-party solutions, allowing for enhanced functionality and interoperability.
- Simple Network Management Protocol: Uses the most widely-respected network monitoring system.
- Monitoring for Servers: Activate SNMP in your server’s operating system to get it included in the monitoring service.
Cons:
- No SaaS Package: Lacks a Software-as-a-Service (SaaS) package, which may limit deployment options for users preferring cloud-based solutions.
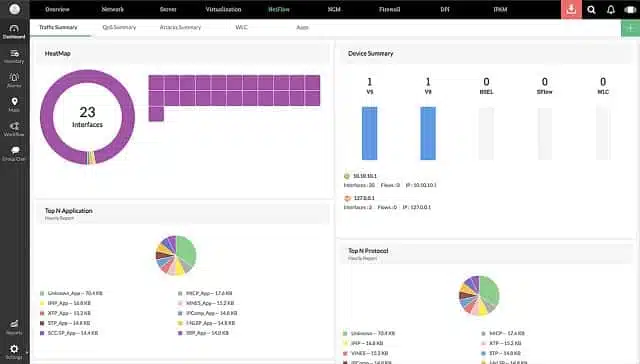
The dashboard of the tool is very well planned and manages to display a lot of information in each screen. It includes eye-catching charts and graphs and shows the alerts sent out by device agents that detect status problems. You can create your own alert rules and even customize the dashboard. ManageEngine offers OpManager on a 30-day free trial. The software runs on Windows Server and Linux.
EDITOR'S CHOICE
ManageEngine OpManager is our top pick for a Cisco network monitoring tool because this package is specifically designed to support a wide range of network hardware. OpManager provides comprehensive monitoring for Cisco routers, switches, firewalls, and wireless access points, making it ideal for managing complex Cisco networks. One of the most attractive features of OpManager is its well-planned dashboard that includes charts and dials to illuminate current network statuses. This simplifies network monitoring tasks, even for less experienced administrators. You don’t even need to set up the system inventory because OpManager automatically scans your network and logs all of the devices included in it. The package also draws up a network topology map. Both the inventory and map are constantly updated by repeated scans of the network. The software provides real-time performance tracking, fault management, and automated alerts, ensuring that any issues within the Cisco network are immediately detected and addressed. The ability to view network health metrics, such as bandwidth utilization, packet loss, and device status, helps teams quickly identify and resolve performance bottlenecks. OpManager’s detailed reports and customizable dashboards allow administrators to gain insights into Cisco network performance and usage patterns, improving overall decision-making. With its combination of ease of use, powerful monitoring capabilities, and seamless Cisco device integration, ManageEngine OpManager provides a reliable and efficient solution for managing and optimizing Cisco networks.
Download: Get a 30-day FREE Trial
Official Site: https://www.manageengine.com/network-monitoring/download.html
OS: Windows Server, Linux, AWS, and Azure
2. Site24x7 Cisco Network Monitoring (FREE TRIAL)
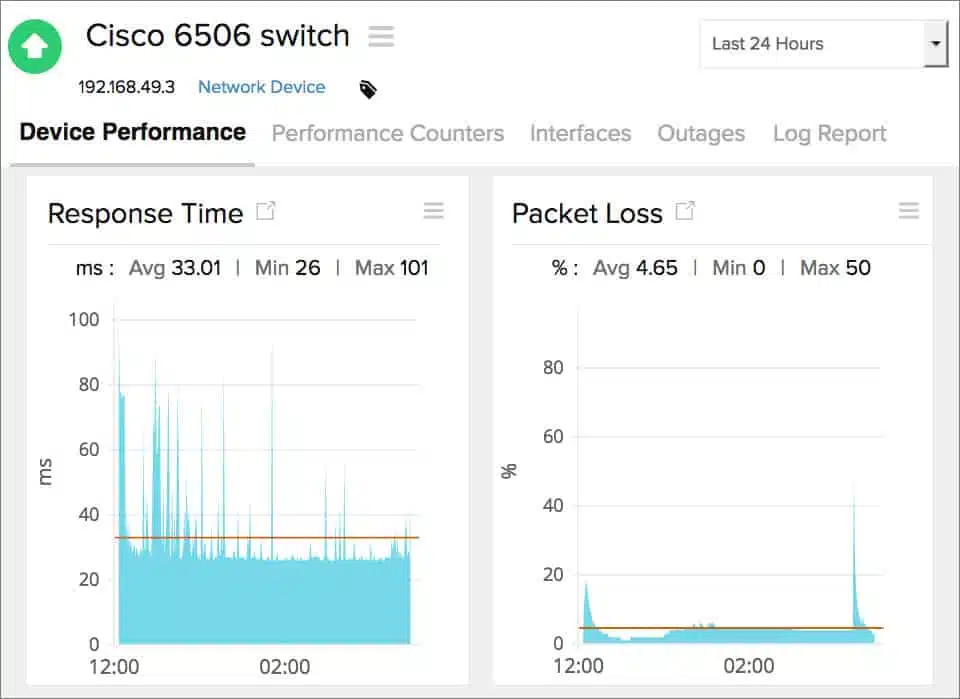
The Site24x7 Cisco Network Monitoring module relies on the SNMP system to track the statuses of network devices. The Simple Network Management Protocol includes an agent program that reports back to a controller on demand. All Cisco switches and routers include an SNMP agent and Site24x7 acts as an SNMP manager, collecting status reports from those Cisco devices. Site24x7 is also able to monitor Cisco firewalls and other appliances connected to the network.
Key Features:
- Remote Network Monitoring: Allows monitoring of network devices from remote locations, enhancing flexibility.
- SNMP Traps Processing: Processes SNMP traps into alerts, enabling proactive identification of network issues.
- Monitors All Network Devices: Provides monitoring capabilities for all network devices within the infrastructure.
Why do we recommend it?
Site24x7 is a SaaS package that is hosted in the cloud. This system provides modules for monitoring networks, servers, and applications. The network monitoring system is divided into two units: one for device monitoring and one for traffic analysis. Both of these units can interface with Cisco network devices.

Site24x7 is a cloud-based service, so you don’t need to maintain software on your own site to use it. It is able to communicate with a long list of Cisco devices. The SNMP system enables Site24x7 to automatically detect all network devices on the monitored network and it creates a live topology map and a device inventory from that network. Both the map and the network inventory both get updated automatically, should any device get moved, added, or removed.
The device agents don’t have to wait for an information request if they detect problems with the equipment that they are monitoring. In this instance, the agent sends a “trap” message to the Site24x7 system, which interprets that message into an alarm or a warning in the system dashboard.
Who is it recommended for?
Site24x7 is able to monitor any network from its cloud location. It can gather a long list of metrics from any Cisaco device and you will probably narrow down the display in the console to just those conditions that particularly interest you – the monitoring screens are customizable.
Pros:
- Comprehensive Monitoring: Integrates network, server, and application monitoring, providing a holistic view of IT infrastructure performance.
- Alert Notifications: Forwards alerts as notifications via SMS and email, ensuring timely awareness of critical events.
- Cloud Service: Hosted as a cloud-based service, offering accessibility and scalability.
Cons:
- No Patching or Configuration Management: Lacks features for patching or configuration management, which are essential for comprehensive network maintenance and security.
Site24x7 is available in both free and paid versions. The free version is limited to monitoring just five websites or servers. So, that service is suitable for very small businesses. There are four paid editions called Starter, Pro, Classic, and Enterprise. Each of these is available for a 30-day free trial.
3. Paessler PRTG Network Monitor (FREE TRIAL)
Paessler PRTG Network Monitor is a collection of monitors, which are called “sensors”. The tool is able to monitor networks, servers, and applications. The main system used by the monitoring suite to watch over network devices is SNMP. This gives PRTG an autodiscovery function on installation and a continuously-updated device inventory. The tool will also automatically draw network topology maps from the inventory data.
Key Features:
- Network Discovery and Asset Inventory: Automatically discovers network devices and creates an inventory, simplifying network management.
- Topology Mapping: Creates visual representations of network topology for better understanding and management.
- Live Performance Graphs: Provides real-time visualizations of network performance metrics through graphs.
- SNMP Methodology: Utilizes SNMP (Simple Network Management Protocol) for network monitoring and management.
- Wireless Footprint Mapping: Maps wireless network coverage and performance for better optimization and troubleshooting.
Why do we recommend it?
Paessler PRTG Network Monitor is a bundle of monitoring systems that includes Cisco monitoring that offers both device status checks through SNMP and traffic monitoring with NetFlow and IPFIX. The package provides a network discovery service that creates an asset inventory and a network topology map.
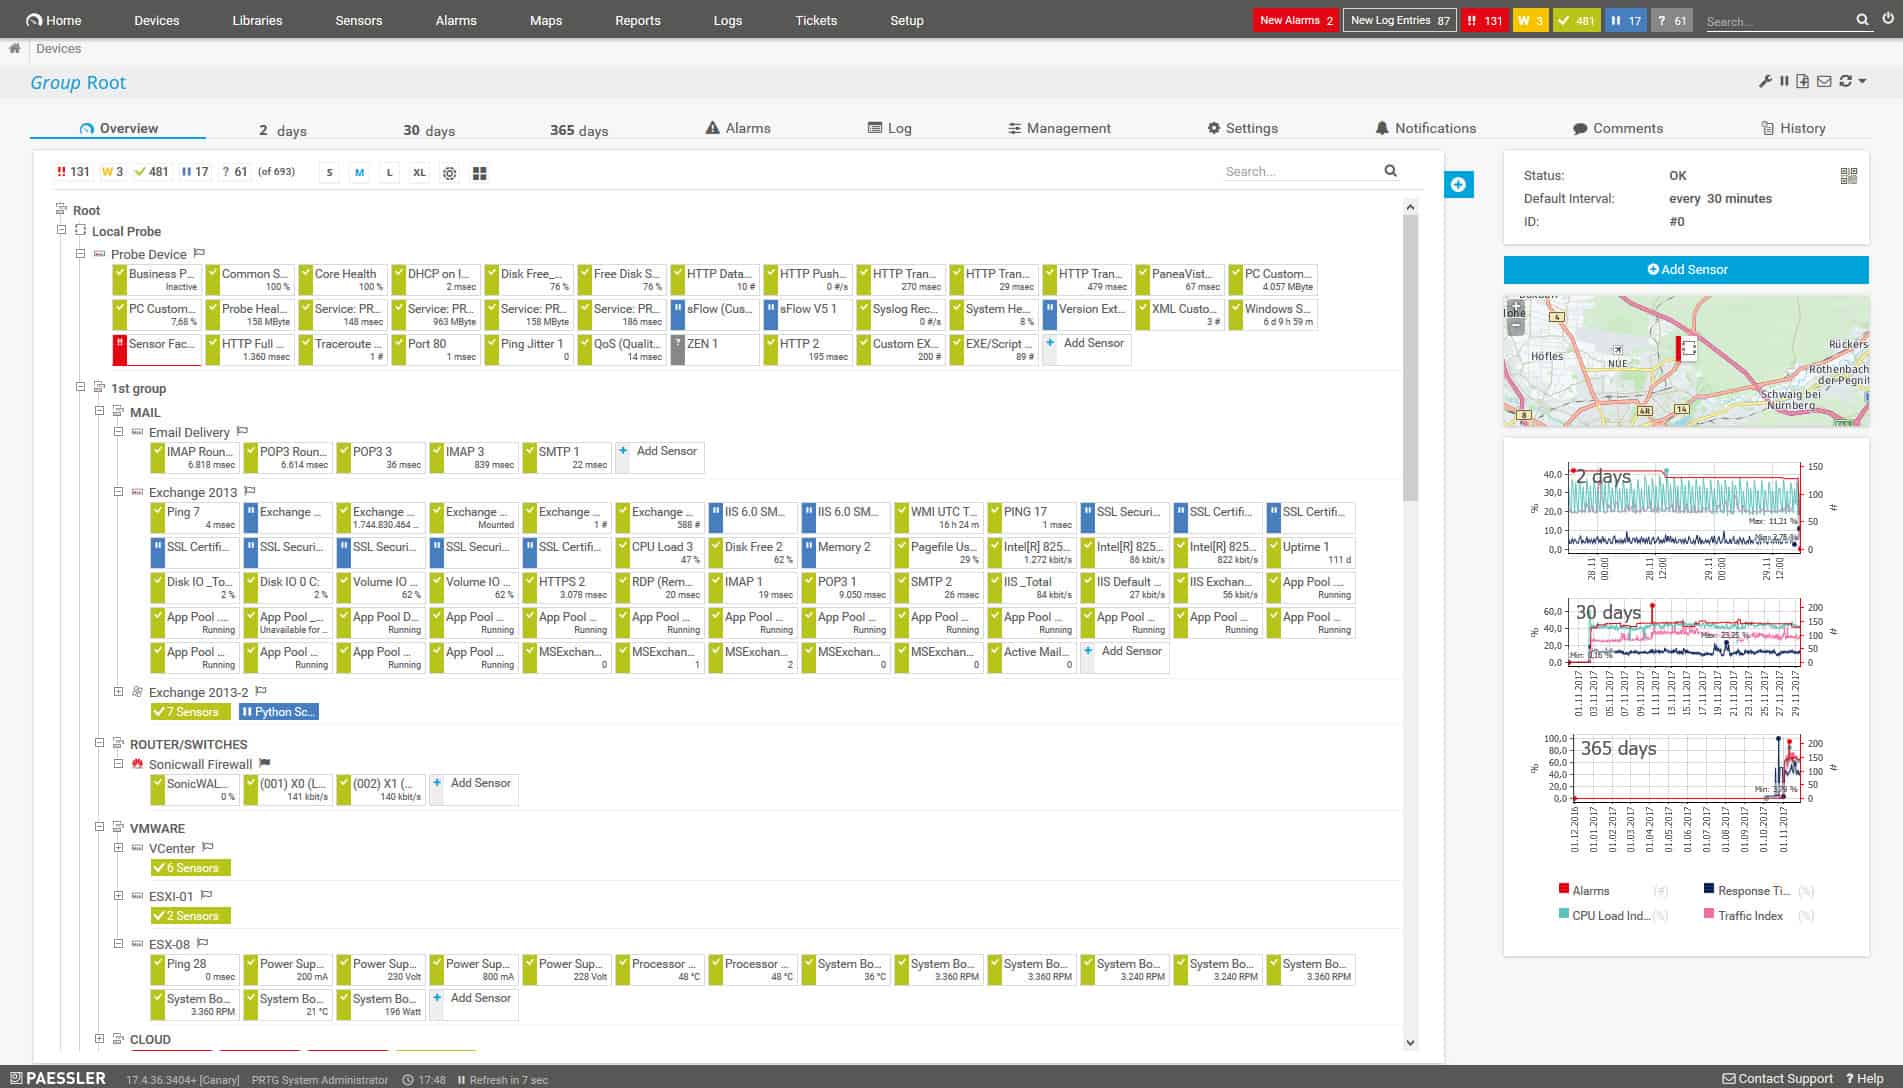
The statuses of all network devices are shown in the dashboard. Comprehension is made easier by data visualizations, such as charts, meters, and graphs, which are color-coded. PRTG can monitor the statuses of all network devices, not just those produced by Cisco Systems.
When you buy PRTG, you pay for an allowance of sensors. Paessler ships the entire package of all possible sensors to all customers. However, you customize your implementation by deciding which sensors to activate. The Cisco System Health sensor specifically checks on the hardware statuses of your Cisco devices.

Among other monitors in the pack is a NetFlow sensor – there are also sensors for sFlow and J-Flow. Another Cisco-specific monitor in the package is the IP SLA sensor. This accesses “service level agreement” data collected on Cisco switches to check on the qualities of VoIP transmissions. The Cisco ADSL sensor is able to get link throughput and capacity data from Cisco routers.
Traffic shaping measures can be tracked through PRTG with the Cisco CBQoS sensor. This gathers queue information from Cisco switches. The Cisco Adaptive Security Appliance (ASA) firewall can be queried using PRTG’s SNMP Cisco ASA VPN Traffic sensor and the Cisco ASA VPN Users sensor.
Who is it recommended for?
This package is suitable for all businesses because it is highly customizable. It is able to monitor the network devices produced by other manufacturers, not just Cisco. You can combine the network monitoring with server and application supervision and there are also internet and Web tests in the bundle.
Pros:
- Scalability: It supports distributed monitoring, allowing users to monitor multiple networks and locations from a centralized console.
- Multi-Vendor Support: PRTG supports a wide range of vendors, devices, and technologies, including network equipment, servers, virtual machines, cloud services, and applications.
- Real-time Monitoring: PRTG provides real-time monitoring and alerting capabilities, allowing users to receive instant notifications of network issues or performance degradation.
Cons:
- No Patch Manager or Configuration Manager: Lacks features for patch management and configuration management, which are essential for comprehensive network maintenance and security.
You can get a 30-day free trial of PRTG with unlimited sensors. If you only ever activate up to 100 sensors, the software is free to use forever. The package runs on Windows Server.
4. Nagios XI

Nagios XI is a package of monitoring services that watch over networks, servers, and applications. The network monitoring system provides switch performance tracking through SNMP. The Nagios service can be extended by plug-ins that add on extra screens and probes and there is a library of Cisco-specific plug-ins available.
Key Features:
- Centralized Dashboard: Nagios XI provides a centralized web-based dashboard for monitoring and managing IT infrastructure.
- Alerting and Notification: Nagios XI features robust alerting and notification capabilities, allowing users to define thresholds and receive alerts via email, SMS.
- Performance Graphs and Reporting: Nagios XI generates performance graphs and reports based on historical data, allowing users to analyze trends, identify patterns, and troubleshoot.
- Configuration Management: Nagios XI includes configuration wizards and templates to simplify the setup and management of monitoring configurations.
Why do we recommend it?
Nagios XI is a highly respected system monitoring package that has gathered much of its kudos from its open source free counterpart, Nagios Core. Both packages can monitor the health of Cisco network devices with SNMP. To get traffic analysis data, you need to add on the Nagios Network Analyzer.
The Nagios system includes an autodiscovery service. This scans the network and identifies all of the switches and routers running the system. Nagios uses the information it gains from this search to compile a network inventory. Details of the devices connected to each port enable Nagios to link together all of the equipment on the network and draw up a topology map. The autodiscovery process repeats continuously, keeping the inventory and topology map up to date.

The SNMP processes in the package poll device agents for MIB reports and compile these into live activity feedback in the dashboard of the monitor. The system is also able to process SNMP Trap messages into alerts. It is possible to set up performance thresholds on any gathered metric to create custom alert conditions.
The data available about switch activity extends to the capacity and utilization of the device’s components, such as memory and CPU. It is also possible to see the throughput activity on each port. All of this information can tell you if a switch is becoming overloaded.
Who is it recommended for?
Nagios XI is not cheap and small businesses will probably find that this system is beyond their budget – they should read below about Zabbix. The Nagios gives you full-stack monitoring, not just for networks. The system provides a network inventory and topology map based on data gathered from its SNMP sweeps.
Pros:
- Extensive Monitoring Capabilities: Nagios XI offers comprehensive monitoring for diverse IT infrastructure components, providing visibility into system health and performance.
- Centralized Management: Nagios XI provides a centralized management interface for monitoring and managing IT infrastructure, simplifying administration and troubleshooting.
- Community Support: Nagios XI has a large and active community of users, forums, and resources for support, knowledge sharing, and collaboration.
- Enterprise Features: Nagios XI includes enterprise-grade features such as distributed monitoring, high availability, and role-based access control, making it suitable for large-scale deployments.
Cons:
- Not Available for Windows: Nagios XI is not available for the Windows operating system, which may limit deployment options for some users.
- Cost: Nagios XI is a commercial product, and the licensing costs may be prohibitive for some organizations.
You have to pay for Nagios XI. There is a free version, called Nagios Core but that doesn’t have a very good user interface. The software for Nagios installs on Linux. If you only have Windows systems, you can run Nagios on top of a hypervisor. The Nagios XI system is available for a 30-day free trial.
5. N-able N-sight

N-able N-sight is a remote network monitoring and management software bundle that is suitable for an IT department that wants to administer the IT infrastructure on several sites from a central location. This is a SaaS system, so it includes the server to run the software and all necessary storage space.
Key Features:
- SNMP Reporting: Utilizes SNMP for reporting on device performance and health metrics.
- Records Physical Conditions: Keeps records of physical conditions of network devices, aiding in maintenance and troubleshooting.
- Multi-Tenant Architecture: Supports a multi-tenant architecture to keep MSP client data separate, ensuring data privacy and security.
- Performance Alerts: Generates alerts for performance issues, enabling proactive problem resolution.
- Firmware and Configuration Management: Facilitates management of device firmware and configurations, ensuring consistency and security.
Why do we recommend it?
N-able N-sight is a remote monitoring and management (RMM) platform that is designed for use by managed service providers. The networks that this package monitors don’t belong to the companies that use the tool but are the systems of the clients that the MSP supports.
Part of the job of this RMM is to monitor network devices, including switches, routers, and firewalls. It can also monitor UPSs, printers, desktops, laptops, mobile devices, and servers. Among the device brands that the RMM can communicate with is Cisco Systems.
Device attributes that the service monitors include:
- CPU capacity and usage
- Temperature levels
- Fan status
- Memory capacity and utilization
- Power supply statuses
- Drive status
- RAID status
- Disk status
- Page count for printers
- Toner/ink level for printers
- Printer jams
- Battery levels

Other network services that the system can check while querying switches and routers include VPNs, VoIP traffic, and VM mappings.
The main method that N-able N-sight uses to communicate with devices is the Simple Network Management Protocol (SNMP). All Cisco devices are shipped with an SNMP device agent already installed on them. In some cases, that function is turned off by default and will need to be activated to get the device monitor functioning properly.
The N-able N-sight acts as the SNMP manager and requests status reports from all device agents periodically. The responses from agents enable N-able N-sight to compile a device inventory. This is updated with every network query cycle.
The status details returned by device agents are interpreted into data tables and graphs in the system dashboards. Device agents are also able to send out an urgent message without waiting for a status request. This is called a trap and N-able N-sight displays these reports as alerts. Alerts can be sent out to key staff as emails or SMS messages.
Who is it recommended for?
This package is designed for managed service providers. It has a multi-tenant architecture, which enables the operator of an account on the platform to create sub-accounts – one for each client. This keeps the data of each client completely separate and enables the MSP to block access to specific accounts by specific technicians.
Pros:
- Designed for MSPs: Tailored for Managed Service Providers (MSPs) to efficiently manage multiple client networks.
- Live Statuses: Provides real-time status updates for network devices, enabling immediate visibility into network performance.
- Tailored for MSPs: Designed specifically for Managed Service Providers, offering features and functionality tailored to their needs.
Cons:
- Backup Management Costs Extra: The management of backups may require additional costs, which could impact overall budget considerations for MSPs.
The system dashboard is held on N-able servers and can be accessed by IT professionals through any standard browser or a special app for mobile devices. N-able offers a 30-day free trial of N-able N-sight.
6. SolarWinds Network Performance Monitor

The SolarWinds Network Performance Monitor (NPM) is the leading network monitoring package available today. Like many of its rivals, the software deploys the Simple Network Management Protocol (SNMP) to get constant feedback on network device statuses, including those produced by Cisco Systems.
Key Features:
- Network Autodiscovery: Automatically discovers devices on your network, reducing manual configuration effort.
- SNMP-Based Monitoring: Utilizes SNMP for continuous monitoring of network devices.
- Automatic Network Topology Mapping: Creates visual representations of your network infrastructure, helping you understand device relationships and connectivity.
Why do we recommend it?
SolarWinds Network Performance Monitor is able to monitor network devices provided by many manufacturers, not just Cisco Systems. This makes the package ideal for monitoring any network and isn’t limited to those that are only built with Cisco equipment. The package can monitor wireless networks as well as LANs.
All Cisco network devices have an SNMP agent pre-loaded onto them. The network engineer just has to ensure that this function is turned on when adding a new device to the network. The Network Performance Monitor is then able to communicate with that new device.
The NPM automatically polls all devices on the network when it first goes into service. With the responses it gets from its SNMP requests, it creates a device inventory for the network and automatically draws up a network topology map. That map is instantly updated when any new device is added to the network or removed. Location changes of devices are also automatically reflected in the network map.
The Network Performance Monitor also can also check on the statuses of wireless APs and draws up a wireless heat map, showing the signal footprint of each on an office plan.

All devices, including those by Cisco, send regular reports to the NPM, which shows those live statuses in the system console. Any device agent that detects a sudden problem with the device that it is monitoring will send an SNMP Trap message to the NPM, which interprets that into an alert. Alerts are shown on the screen but can also be sent out automatically to key personnel via email, SMS, or Slack message
The SolarWinds Network Performance Monitor is built on a proprietary platform, called Orion, enabling the service to integrate seamlessly with other infrastructure monitoring modules produced by SolarWinds.
Some cross-modular utilities in the Orion platform include PerfStack, which shows the full stack of all supporting service layers for running software, identifying the element that is causing trouble. Another utility is NetPath which shows a visual path across the network from one given device to another, displaying link capacity and device performance for each hop.
Who is it recommended for?
As this package is able to monitor the network devices supplied by all manufacturers, it is suitable for monitoring all networks. The system automatically discovers all network devices and creates a network inventory. Each entry in that list showed the make, model, and firmware version of the device.
Pros:
- Comprehensive Device Tracking: Tracks switches, routers, firewalls, and devices from various vendors, including Cisco.
- Autodiscovery and Inventory Management: Simplifies network management by automatically discovering devices and creating an inventory.
- Alerting System: Generates alerts for performance problems, enabling prompt response to network issues.
Cons:
- No SaaS Version: Lacks a Software-as-a-Service (SaaS) version, which may limit deployment options for some users who prefer cloud-based solutions.
The software can be installed on Windows Server and SolarWinds offers a free trial of the Network Performance Monitor.
7. Datadog Cisco Monitoring

The Datadog network monitoring system can be enhanced with more than 500 integrations. These integrations are product-specific procedures and screens that focus on the top-selling infrastructure products and applications currently in use. One of these is the Cisco Meraki range of equipment.
Key Features:
- Agent-Based Monitoring: Utilizes lightweight agents to collect metrics, logs, and traces from hosts and applications, allowing for detailed performance monitoring and analysis.
- Real-Time Visualization: Provides real-time visualization of metrics and logs through customizable dashboards, enabling users to monitor system health and performance at a glance.
- APM (Application Performance Monitoring): Offers application performance monitoring capabilities, including distributed tracing, code-level insights, and application dependency mapping.
- Log Management: Includes log management features for collecting, aggregating, and analyzing log data from various sources, allowing for centralized log monitoring and analysis.
- Infrastructure Monitoring: Monitors cloud infrastructure components such as servers, containers, databases, and networks, providing insights into resource utilization, performance, and availability.
- Integration and Extensibility: Integrates with various cloud providers, DevOps tools, and third-party services through APIs and plugins, enabling customization and integration with existing workflows.
Why do we recommend it?
Datadog Cisco Monitoring is part of a SaaS platform of system monitoring and management tools. You can monitor Cisco network devices in the Network Device Monitoring module and access traffic data from Cisco devices in the Network Performance Monitoring unit. If you get the Infrastructure module, you can add on an integration for Cisco Meraki devices.
Datadog Network Device Monitoring specializes in monitoring the equipment used for IT. The switches, routers, wireless access points, and firewalls in the Cisco Meraki range are in this category. The module uses the Simple Network Management Protocol (SNMP) to communicate with device agents and get regular status reports. SNMP agents are pre-loaded onto all Cisco Meraki products. The Datadog system performs all of its processing on the Datadog servers. This is also the home of the customer’s system dashboard. However, there is a part of this monitoring system that needs to be installed. This is an agent program and it can be installed on Windows, Linux, or Mac OS.

The special Cisco Meraki integration extends the monitoring capabilities of Datadog Network Device Monitoring because it can access and analyze the event logs produced by these devices for extra information about network activities.
Another module available from Datadog, the Network Performance Monitor, will enhance your traffic flow monitoring on networks run by Cisco devices. This tool is able to communicate with switches and routers to extract samples of network traffic and get traffic flow data from the network devices. This is done by utilizing a communication protocol, invented by Cisco, called NetFlow.
Who is it recommended for?
The Datadog platform offers its services module by module. Although this cloud system is very similar to the Site24x7 platform, the pricing structure of the two is different – Site24x7 offers combinations of modules in plans. The Datadog system lets you select modules for your account.
Pros:
- User-Friendly Interface: Provides an intuitive and user-friendly interface that simplifies setup, configuration, and management tasks, reducing the learning curve for users.
- Scalability: Scalable solution capable of handling large-scale deployments with high volumes of data, providing flexibility to adapt to the needs of growing organizations.
- Real-Time Insights: Delivers real-time insights into system health and performance, enabling quick response to incidents and proactive performance management.
Cons:
- Cost: Datadog is a subscription-based service, and the licensing costs may be higher compared to some other monitoring solutions, especially for small or budget-constrained organizations.
- Patch Management: Lacks features for patch management and configuration management, which are important for comprehensive network maintenance and security.
The Datadog Network Device Monitoring is are charged for by subscription per host with an option of a monthly or a yearly payment cycle. The Network Performance Monitor is also charged for per host per month or per year. Both of these modules are available on a free trial.
8. LogicMonitor
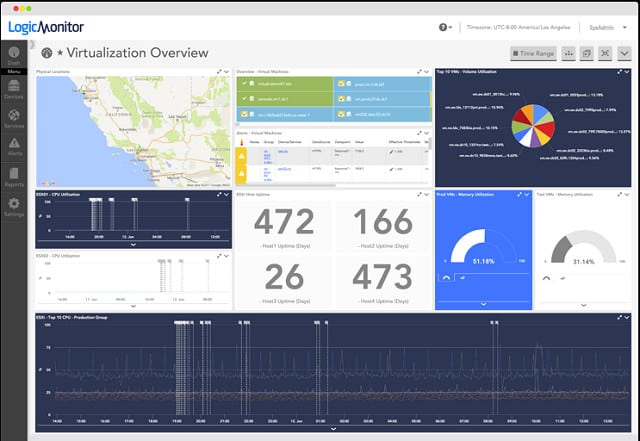
LogicMonitor is an online service, so you don’t need to worry about installing or maintaining its software. You do need to install a data collector agent on your system. Communications between the collector and the remote management tool are all encrypted.
Key Features:
- Unified Monitoring: Monitors a wide range of IT resources, including servers, networks, applications, cloud infrastructure, and more, all from a single platform.
- Real-time Monitoring: Provides real-time data and alerts on the health and performance of IT infrastructure.
- Data Collection Methods: Offers both agent-based and agentless monitoring methods for flexibility.
- Customizable Dashboards: Allows users to create custom dashboards to visualize key performance indicators (KPIs).
- Alert Management: Provides robust alert management features with customizable thresholds and notification preferences.
Why do we recommend it?
LogicMonitor is a SaaS platform that can monitor your local network through the assistance of an agent program. This service provides both network device monitoring and traffic analysis. The service communicates with Cisco devices and the switches and routers produced by other manufacturers. The package uses NetFlow to extract traffic data.
This monitor will discover all of your devices automatically, log them into a register, and create a network topology map. The inventory includes the make and model of each device, so you will be able to quickly identify your Cisco equipment.

The LogicMonitor network monitor uses SNMP to log device statuses and it will also process SNMP traps into alerts in the dashboard. The tool uses the Cisco NetFlow system to monitor traffic levels and bandwidth utilization.
The LogicMonitor agent will communicate with your Cisco routers, switches and wireless access points (APs). It will track the statuses of device module and card CPU availability, memory pool, and temperature. It can gather traffic statistics and settings related to VoIP Quality of Service, IP SLA, and traffic shaping measures. The tool has extra functionality when dealing with Cisco Nexus switches.
With Nexus switches, LogicMonitor can perform device configuration management as well as monitoring. In addition to monitoring CPU and memory statuses, the monitor can track supervisor card status and redundancy states, ejector and line card statuses, FRUN status and power draw, VDC status, fan performance, and temperature.
Who is it recommended for?
The LogicMonitor network monitoring package is particularly useful if you muse Cisco Nexus switches on your network. This is because this platform is able to manage these devices as well as monitor them. It can update the configuration of Nexus devices, which have a very large command set.
Pros:
- Cloud Monitoring: Provides built-in support for monitoring cloud services and infrastructure, allowing organizations to monitor hybrid and multi-cloud environments from a single platform.
- Ease of Use: Features an intuitive and user-friendly interface that simplifies setup, configuration, and management tasks, reducing the learning curve for users.
- Real-time Insights: Delivers real-time insights into IT infrastructure performance and health, enabling quick response to incidents and proactive performance management.
Cons:
- No Free Version: Lacks a free version or trial, which may require upfront investment for evaluation and adoption.
- Vendor Lock-in: Organizations may become dependent on LogicMonitor’s platform and ecosystem, which could present challenges if they decide to migrate to another platform.
LogicMonitor is available in three service levels: Starter, Pro, and Enterprise – none of which are free. However, you can get a 14-day free trial of LogicMonitor.
9. Zabbix
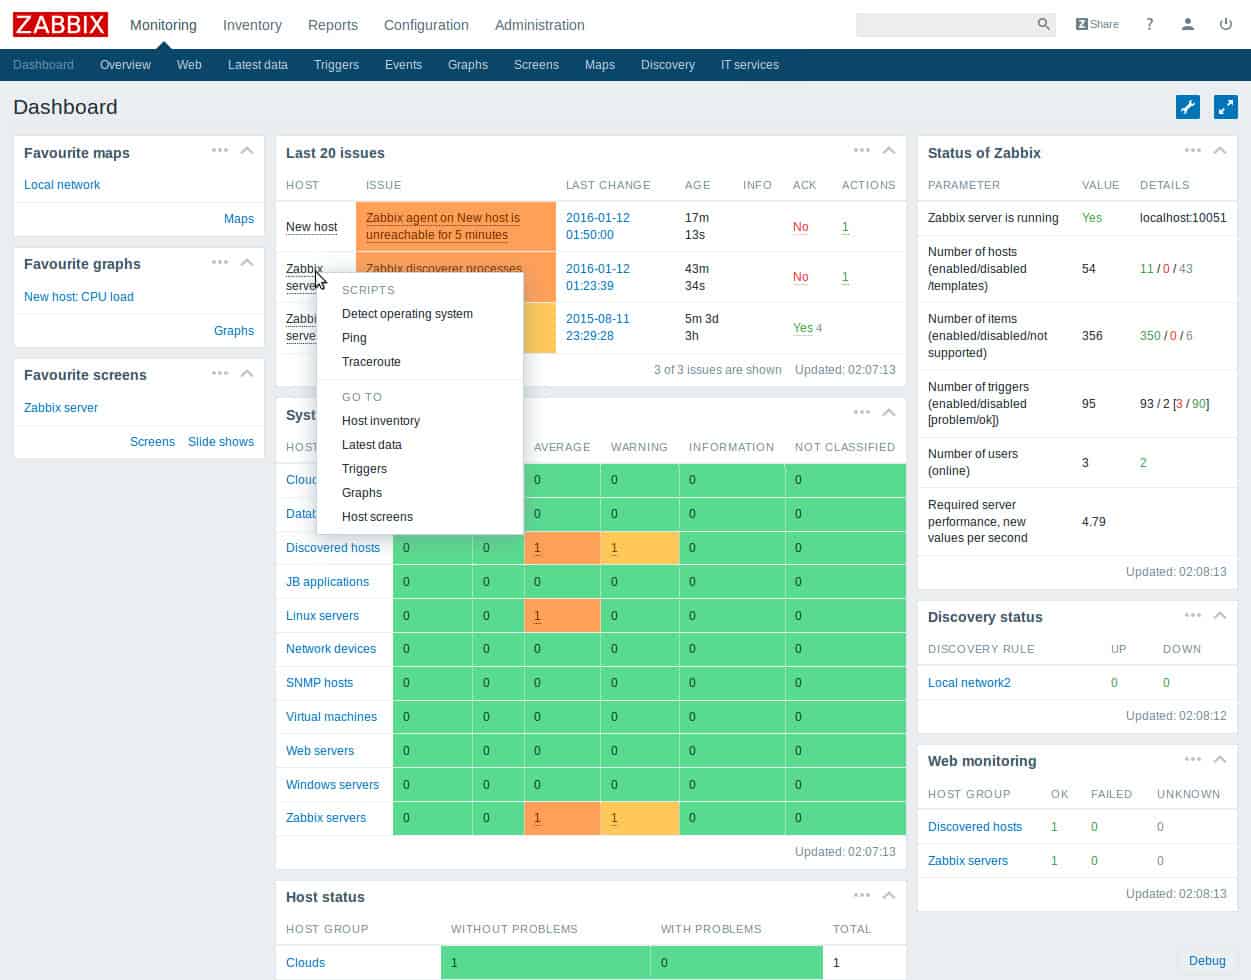
Zabbix is a great free network monitor that can be extended to have specific functionality. The mechanism for add-ons is called “templates” in Zabbix. The standard monitoring system uses SNMP, so you get device discovery, status polling, and alerts with this monitor.
Key Features:
- Auto-Discovery: Features automatic discovery of devices and services on the network, simplifying the setup and configuration process.
- Flexible Monitoring Options: Supports various monitoring methods, including agent-based, agentless, SNMP, IPMI, and JMX, providing flexibility in monitoring diverse environments.
- Performance Monitoring: Monitors performance metrics such as CPU usage, memory utilization, network traffic, and disk space, enabling proactive performance management and troubleshooting.
- Alerting and Notification: Offers customizable alerting and notification mechanisms to notify users of critical issues via email, SMS, or other communication channels.
- Dashboards and Reporting: Provides customizable dashboards and reporting capabilities to visualize performance data, trends, and insights for informed decision-making.

Why do we recommend it?
Zabbix monitors networks, servers, and applications and it is free of charge. The Cisco monitoring services in this package are fulfilled y the general SNMP-based device monitoring and traffic analysis services, which apply to all makes of network devices. However, Zabbix also offers templates that offer specific access to Cisco devices.
The templates available for Cisco equipment give you channels to connect directly to Cisco devices, query them, and update their settings. There are templates for all types of Cisco equipment, including firewalls. These templates are available for free from the user community.
The dashboard for the service is very attractive and it is also customizable. You get a network map page, which is updated automatically from regular SNMP status reviews. You also get a device inventory in the dashboard. Equipment statuses and events are displayed on the screen in text and also in color-coded charts and graphs. The monitor ships with several standard reports, but you can also write your own, or get them from the user community.
Unlike other free network monitors, there is no limit to the number of devices that you can monitor with Zabbix. Large organizations might shy away from the standard Zabbix system because it doesn’t include a professional support service. However, you can pay for support, which is available in five service level packages: Bronze, Silver, Gold, Platinum, and Enterprise. The company runs support centers in the USA, Ireland, Japan, and Russia.
Who is it recommended for?
Zabbix, being free, is probably going to be the first choice of small businesses. However, plenty of large businesses are on the Zabbix client list as well. This is an on-premises package that installs on Linux, cloud platforms, Docker, and hypervisors.
Pros:
- Cost-Effective: Being open source, Zabbix is cost-effective compared to some commercial monitoring solutions, making it an attractive option for organizations with budget constraints.
- Active Community: Benefits from a large and active community of users, forums, and resources for support, knowledge sharing, and collaboration.
- Agent-Based and Agentless Monitoring: Supports both agent-based and agentless monitoring, allowing users to choose the most suitable method for their environment.
- Extensive Monitoring Capabilities: Offers comprehensive monitoring for diverse IT infrastructure components, providing visibility into system health and performance.
Cons:
- No SaaS Version: Lacks a Software-as-a-Service (SaaS) version, which may limit deployment options for users preferring cloud-based solutions.
- Complexity: Setting up and configuring Zabbix can be complex, particularly for large-scale deployments with a high volume of monitored devices and services, requiring adequate planning and expertise.
Zabbix includes some extra functions that aren’t usually included in standard network monitors. These include network traffic analysis, forecasting features, and anomaly detection for intrusion prevention.
How to choose a Cisco monitoring tool
Our list includes tools that are suitable for small networks and others that would be good for large systems. Some would work well for companies of any size. Your next stage in narrowing down your options is to eliminate those tools that aren’t appropriate for your network size and number of devices. You also need to pay attention to the providers of your network equipment. If all of your network equipment comes from Cisco Systems, then you could use any of the monitors in this list. If you have devices from other manufacturers, you would probably be better off avoiding the Cisco Network Assistant.
Your other considerations when selecting a monitoring tool should be budget and number of sites and servers. Most of the software in this list can monitor WANs and include Cloud-based services. However, some, such as PRTG charge for their software per site and per server.
You will discover that SolarWinds and ManageEngine produce other infrastructure management tools that integrate with the utilities explained in this guide. That expandable operability could be an advantage for you if you need to monitor mobile devices, add on help desk functions, or add specialist monitoring tools for virtualization or security devices.
Enjoy your search for a new monitor for your Cisco devices. Now you know the best tools to focus on, the time pressure is off and you can make the most of the free offers of these recommended tools to really put them through their paces.
Cisco Network Monitoring FAQs
What are five critical aspects of a network management tool?
According to the International Organization for Standardization (ISO), the five important aspects of network management systems are:
- Fault management
- Configuration management
- Accounting management
- Performance management
- Security management.
Can I use Cisco Active Advisor for network monitoring?
Cisco Active Advisor performs an on-demand network sweep to compile an asset inventory. It is free and very comprehensive but it doesn’t implement live monitoring.
Does Cisco provide a network monitoring mobile app?
Try the Cisco Business Mobile App. This provides management and monitoring tools for wireless networks.

