

Networks evolve and scale over time and any changes, additions, or disruptions to a network or its operating conditions can have long-lasting effects. In a previous post, we discussed network capacity planning in depth, and look at the best practices for getting it right.
In this post, we focus on network management tools that can double up as network capacity planning tools.
Here’s our list of the best network capacity planning tools:
- ManageEngine OpManager Plus EDITOR’S CHOICE Network device monitoring and traffic analysis in one bundle. Runs on Windows Server and Linux. Download a 30-day free trial.
- Site24x7 Network Monitoring (FREE TRIAL) This cloud-based system provides both network device monitoring and traffic analysis to enable network managers to calculate capacity requirements. Start a 30-day free trial.
- Paessler PRTG Network Monitor All-in-one monitoring package that covers network servers, devices, and applications. Installs on Windows Server.
- Nagios XI Extendible network monitoring tool with a large and active user community. Runs on Linux.
- SolarWinds Flow Tool Bundle Free gift of the network tools from SolarWinds. These interact with Cisco routers.
- WhatsUp Gold with Network Traffic Analysis Add-on Network performance monitor that runs on Windows Server. Extend it with the Network Traffic Analysis add-on for capacity planning.
The Best Network Capacity Planning Tools
You need a proficient capacity planning tool in order to support the decision makers in your business when a new project is proposed.
That tool needs the following attributes:
- Integration with network monitoring software
- QoS capabilities
- Time-based analysis
- Link visibility and end-to-end connection analysis
- Traffic replays
- Storage of historical data
- Reporting capabilities
- Data visualizations
Our methodology for selecting network capacity planning tools
We’ve broken down our analysis for you based on these key criteria:
- Comprehensive Monitoring Capabilities: Tools must offer a wide range of monitoring features, including device health, traffic analysis, and performance metrics.
- Support for Standard Protocols: The ability to work with common network protocols such as SNMP, NetFlow, sFlow, IPFIX, and others is essential for compatibility across various network devices.
- Detailed Traffic Analysis: In-depth analysis capabilities for understanding traffic flows, usage patterns, and potential bottlenecks within the network.
- Scalability and Flexibility: The tool should be able to scale with the network, supporting both small and large environments, and be flexible enough to adapt to changing network configurations.
- User-Friendly Interface: A well-designed interface that allows for easy navigation, customization, and visualization of data to aid in quick decision-making.
1. ManageEngine OpManager Plus (FREE TRIAL)

ManageEngine OpManager Plus combines a network device monitor and a bandwidth analyzer with a server and application monitor, an IP address management system, a switch port manager, and a configuration manager. This is a very comprehensive infrastructure administration tool, but the device monitor and the bandwidth analyzer modules will assist you with your network capacity planning activities.
Key Features:
- Integrated Network Performance Monitoring: Keeps tabs on network device statuses and health using SNMP for comprehensive visibility.
- Advanced Traffic Analysis: Employs various flow protocols like NetFlow, IPFIX, jFlow, and others for detailed traffic insights.
- Dynamic Network Mapping: Automatically creates and updates network maps, aiding in network management and capacity planning.
Why do we recommend it?
ManageEngine OpManager Plus is a very large package of ManageEngine tools. The core modules are OpManager which is a network device and server monitoring package and the NetFlow Analyzer, which is a traffic monitor. These two units provide network mapping and traffic activity records for capacity planning.
The network monitor module is available to buy as a separate module, called OpManager and you can also buy the NetFlow Analyzer separately. If you buy these two modules, they will integrate together as they were built on a common platform that facilitates data interchange. All ManageEngine products run on Windows or Linux.
The network device monitor module includes a discovery function that will map your entire network, recording the statuses of each device. This utility is able to reach over the internet to log cloud-based servers and the remote sites of a WAN. The discovery process also covers wireless network equipment and the connections between hardware and services that form virtualizations.
The discovery process keeps running throughout the service life of OpManager Plus, giving live updates on statuses. The monitor uses the SNMP protocol, which allows device agents to send alerts to the central controller. Alert conditions include warnings when a piece of network equipment is approaching its bandwidth capacity, so you can avert device overloading, or implement queuing. All data gathered by the network device monitor and the bandwidth analyzer can be stored for use in analysis and capacity planning.

The device inventory forms the basis of a network mapping module, which plots all of your switches, routers and wireless APs automatically, showing the links between them. You can filter the map to show just switches, or just routers and you can also get your WAN devices plotted on a world map. That map includes a zoom option so you can examine all of the devices on an individual site. You can choose to have each device label show the hostname, MAC address, or network IP address. Other mapping options include a server cabinet view and a server room layout plan.
SNMP gives device bandwidth utilization data and the bandwidth analyzing module of OpManager Plus gives greater detail on traffic flows across each link on your network. The analyzer can collect network traffic statistics reported by the NetFlow, IPFIX, jFlow, NetStream, sFlow, cFlow, AppFlow, and FNF device messaging systems. The metrics that arise from these messages are shown live on screen and can also be stored for analysis and capacity planning. The bandwidth utilization data can also be used to support alerts that look for capacity exhaustion.
Data is shown in the dashboard both as lists and as graphical elements, such as dials, graphs, and charts. The title band of the dashboard screen can be used as a summary strip, showing small icons of color-coded graphs that show live data. Each icon acts as a link to a detail screen for the metric that it represents. The dashboard can be customized and you can set up user roles and accounts, giving limited controls and data views to different team members. The dashboard can also be accessed remotely from mobile devices.
Both the charts and maps as well as data lists can be printed out as reports. The live data and stored historical records can be filtered and sorted to help your management and capacity planning activities. A Ping function will track the packet loss rate on each link of your network to help you adjust capacity data. You can also implement IP SLA in the monitor to measure performance metrics such as jitter, latency, Mean Opinion Score, and packet loss. The bandwidth analyzer will also report on round-trip time on connections to remote facilities. Data and map displays can be filtered by application or port number/protocol activity.
The analyzer integrates the Cisco Network Based Application Recognition (NBAR) methodology to segment traffic data. It is also capable of implementing and monitoring traffic shaping and VLAN tagging methods, including Access Control Lists (ACL) and Quality of Service (QoS). OpManager Plus is able to use Class-Based QoS to help you prioritize traffic through queuing policies.
A special Capacity Planning section in the dashboard gives you time-based bandwidth utilization graphs and supports your planning for natural traffic growth through predictive functions. Capacity figures get collected around the clock and seven days a week, so you can examine out-of-hours activity to find periods suitable for processor-intensive batch jobs. These planning services include some great graphics to ease the capacity planning process.
Who is it recommended for?
This package includes a lot of monitoring systems plus address and configuration management systems. It also gives you server and application monitoring, so it provides all of the services that an IT operations center needs to run a business’s IT system. The bundle would be too much for a small business.
Pros:
- Comprehensive Monitoring Capabilities: Monitors not just bandwidth but also configuration changes affecting network performance.
- Application-Level Insight: Offers detailed monitoring of bandwidth and resource consumption by applications, including user-level analysis.
Cons:
- Complex Interface: Due to its extensive functionality, the software suite can be complex and time-consuming to fully master.
ManageEngine offers all of its products on a 30-day free trial. You can use the standalone network device monitor, which is called OpManager, for free to monitor up to 10 devices.
2. Site24x7 Network Monitoring (FREE TRIAL)
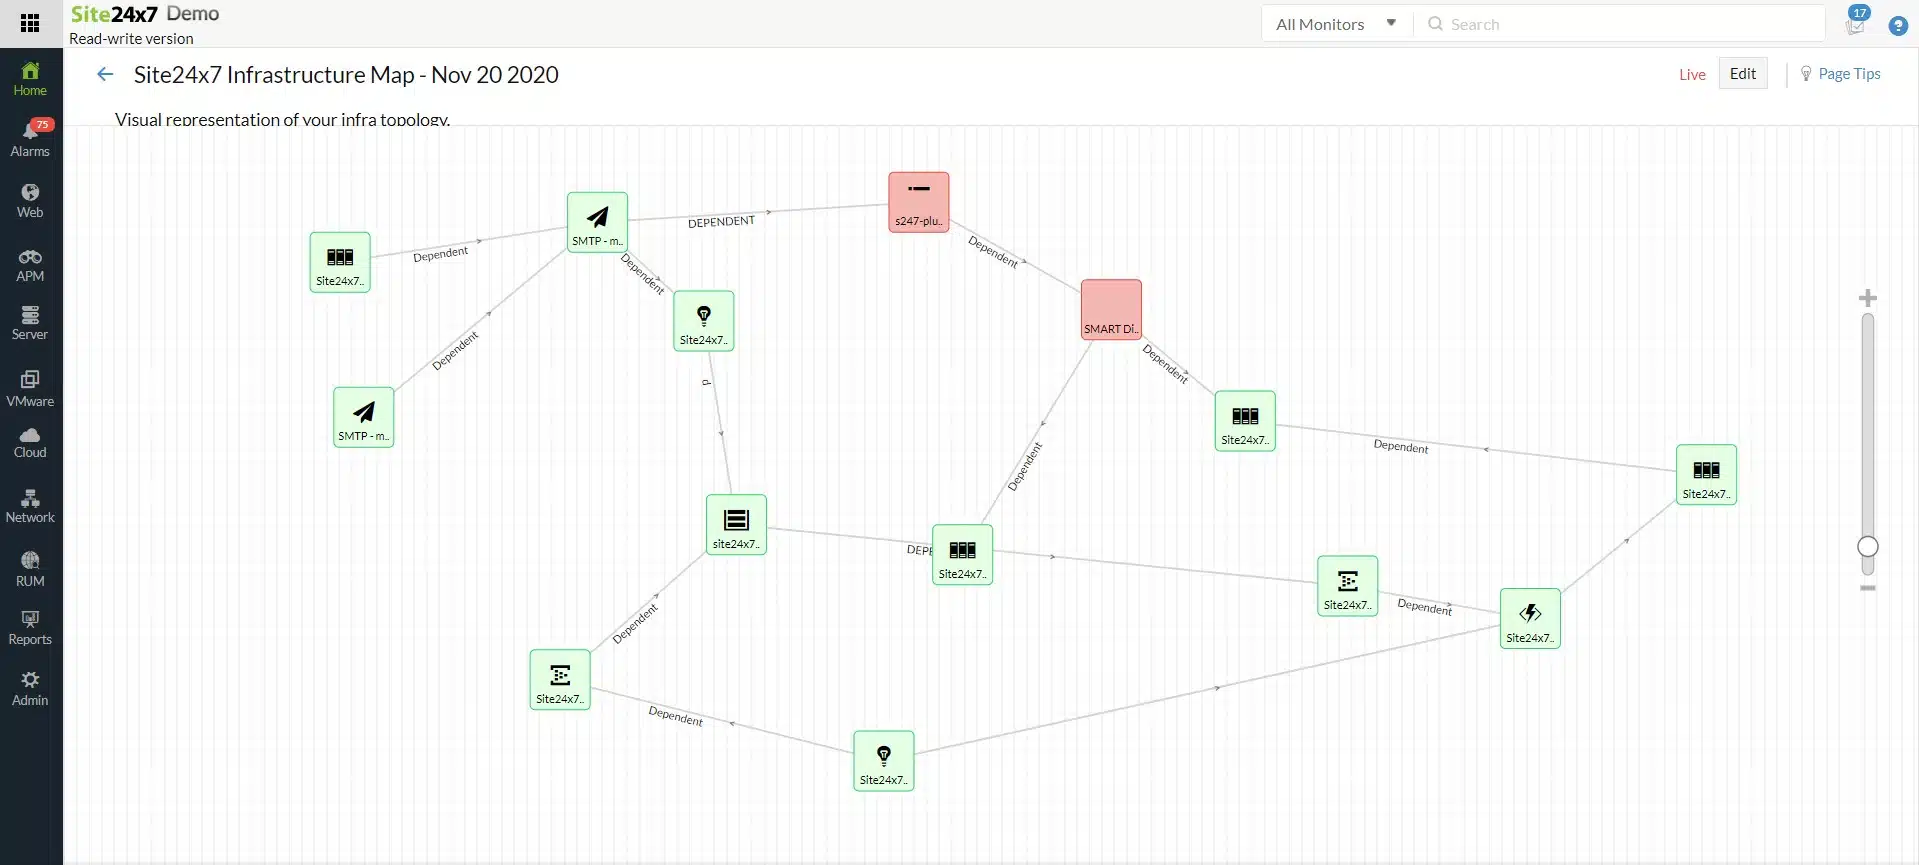
Site24x7 Network Monitoring is a cloud-based system that implements both network device status monitoring and traffic analysis. The device tracking system uses SNMP, which gives the tool the ability to discover all devices on a network and create a hardware inventory. The records in the inventory include the capacity of each interface and this helps with capacity planning. The package also generates a network topology map.
Key Features:
- Automated Network Discovery: Identifies and documents all network devices automatically.
- Dynamic Network Mapping: Creates and updates network topology maps based on current configurations.
- In-Depth Traffic Analysis: Monitors and analyzes network traffic to aid in capacity planning and optimization.
Why do we recommend it?
Site24x7 Network Monitoring is an easy system to set up and use because the tool discovers all devices on the network and documents them automatically. The package will immediately know if the network has been changed and update the network inventory and map accordingly.
The network map provided by the monitoring system is an important aid for network managers when planning capacity. The system illuminates capacity requirements further by recording traffic volumes at all times of the day. The network manager can see if traffic is building up on one link and plan to expand capacity in areas that develop bottlenecks. It is also possible to see whether parts of the network are underutilized.
With the information gleaned from the network monitoring service, network managers can decide whether to increase capacity by installing more equipment, reconfigure the network to make better use of underutilized links, or implement traffic shaping to prioritize interactive connections.
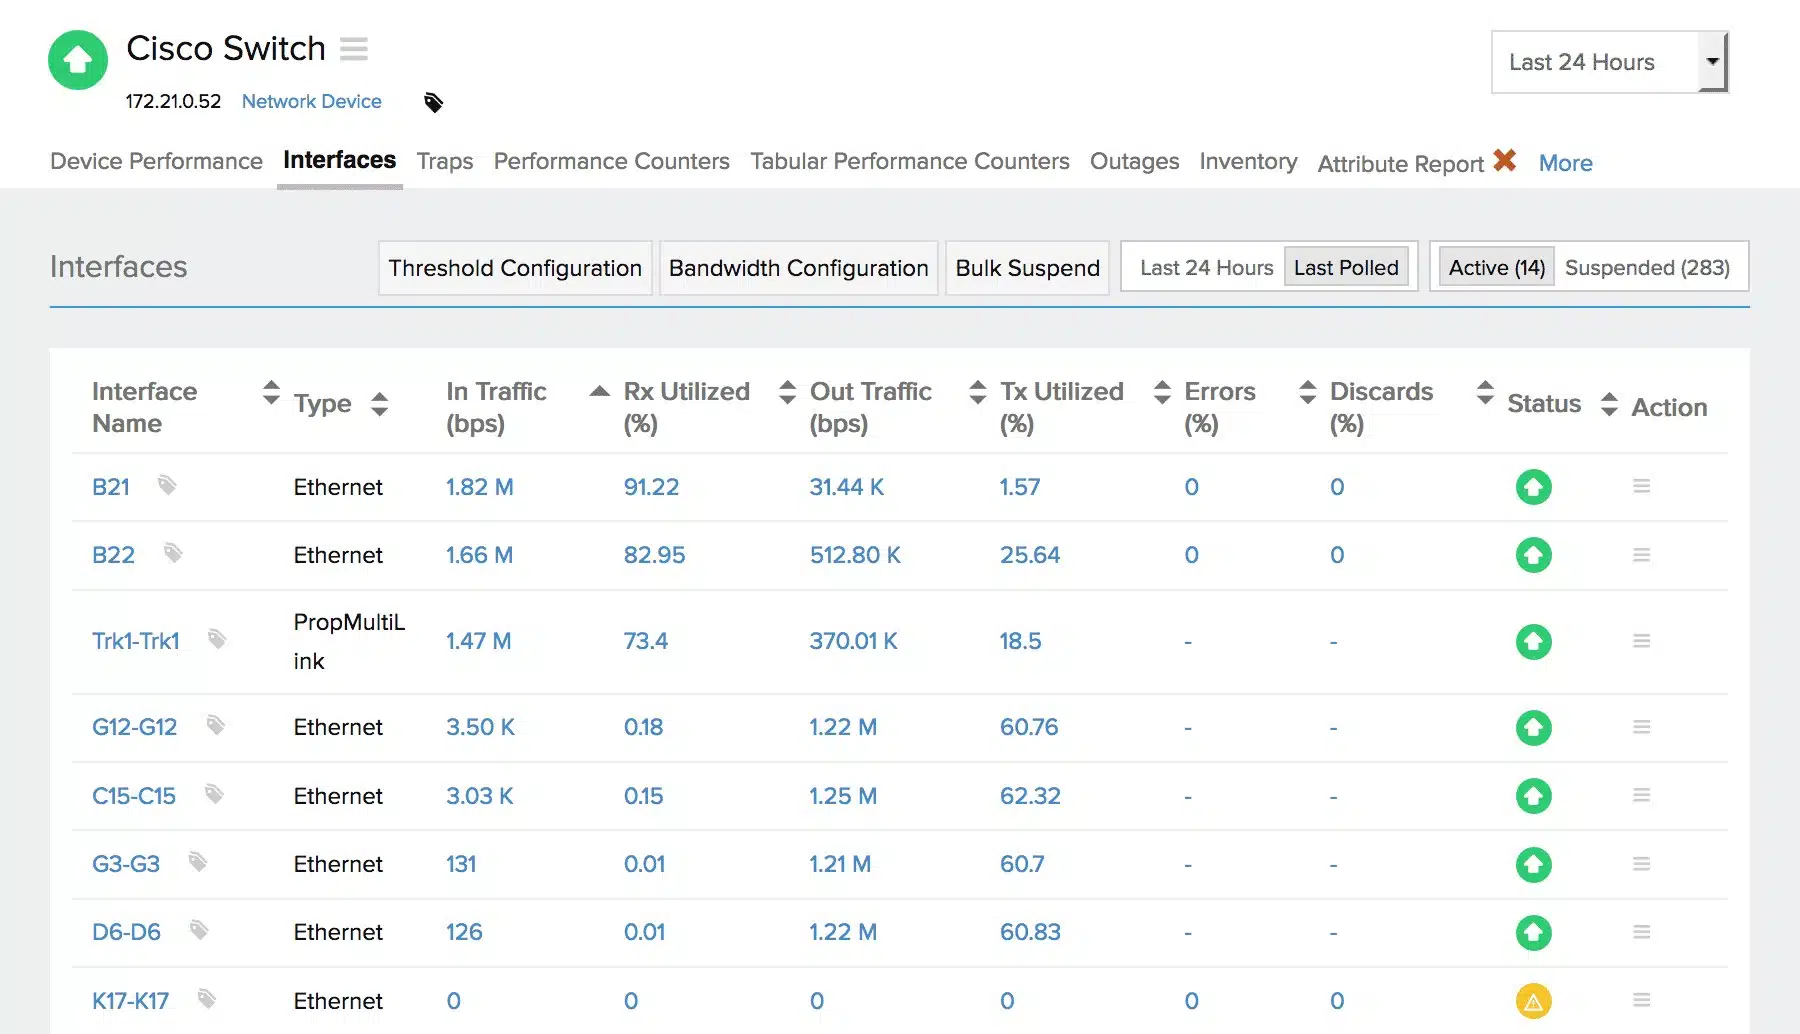
The network device monitor polls the network with the Simple Network Monitoring Protocol, this receives responses from all devices on the network. In this case, everything is okay. However, the information returned by device agents provides all of the data needed to maintain the hardware inventory and network topology map. The reports also include traffic throughput information.
If a device agent detects a problem with a component, it sends out a Trap message, which gets interpreted into an alert. Alerts are shown in the Site24x7 dashboard but you can set up the system to forward these warnings as notifications to technicians via voice message, SMS, email, or Slack message.
The alerting mechanism also operates on the traffic monitoring part of the network monitor. This system works off traffic level thresholds and an alert will be generated if a threshold is crossed. Thresholds represent acceptable traffic volumes and have both high and low boundaries. Thus, if traffic drops to an unusually low level or gets so high that full capacity will be hit, the system sends out an alert.
The traffic measuring system uses flow protocols. As different device providers use different protocols, the Site24x7 system is loaded with all of them. It can communicate with switches and routers with NetFlow, IPFIX, sFlow, J-Flow, cFlow, AppFlow, and NetStream. The data collector can receive traffic data with multiple protocols simultaneously. Thus, it can monitor sites that have equipment from multiple providers.
The flow data is uploaded to the Site24x7 server where it is converted into live traffic graphs in the system console. The traffic statistics are also stored for analysis. This allows a network manager to identify time-based peaks and troughs in traffic volumes per link and work out whether performance can be improved by moving batch jobs to periods with low traffic.
Recalling statistics enables a network manager to look for patterns over time, for example, whether traffic peaks occur at the same time every day. It is also possible to segment data by protocol, source, and destination, which gives the network manager options over how to cut traffic rather than expand capacity.
Per-link traffic patterns can identify underutilized equipment. This provides the option of redesigning the layout of the network to spread traffic more evenly. Another result of traffic insights could be the expansion of capacity by installing more equipment, or the alteration of demand by implementing traffic shaping measures.
Who is it recommended for?
The Site24x7 package is a sophisticated system. However, it is priced to be accessible to small businesses. The base plans don’t cover very large networks, so bigger companies have to pay extra to get more capacity. Plans are charged for by subscription and they include server and application monitoring as well as network monitoring services.
Pros:
- Self-Updating Inventory and Mapping: Automatically discovers and documents network changes, ensuring up-to-date network visibility.
- Capacity Insight: Provides traffic volume tracking for each link, highlighting potential bottlenecks and underutilization.
- Comprehensive Troubleshooting Tools: Offers tools for analyzing packet transmission patterns, facilitating effective troubleshooting.
Cons:
- Cloud-Only Service: Lacks an on-premises deployment option, which may be a drawback for some organizations seeking in-house control.
Site24x7 is a SaaS package with plans to suit any type of business, including managed service providers. You can investigate the platform by requesting a 30-day free trial.
3. Paessler PRTG Network Monitor (FREE TRIAL)

Paessler produces an all-in-one solution to infrastructure monitoring and called it PRTG. This tool includes both network device monitors and traffic analysis as well as server monitoring.
Key Features:
- Automated Network Topology Mapping: Automatically maps network topology for clear visibility of network architecture.
- Support for Major Protocols: Utilizes NetFlow, IPFIX, jFlow, and sFlow for comprehensive traffic analysis.
- Advanced Packet Sniffing: Includes packet sniffer for detailed data traffic insights.
Why do we recommend it?
Paessler PRTG Network Monitor is a package of system monitoring tools that includes network traffic analysis protocol capabilities. The traffic data extraction protocols that this system can use are NetFlow, IPFIX, sFlow, and J-Flow. These capabilities enable the tool to communicate with network devices from different providers.
You can choose to install PRTG on-premises or use it as a cloud service. Even if you go for the online version, you will have to install some software on one of your servers. This is a data collection agent and it runs on Windows Server, as does the full package if you opt for the on-site version.
The first task of PRTG after you activate it is to scan your network and create a device inventory. It will also create a network map from the information it gathers on switches and routers. The maps that PRTG generates are impressive. You will get a straightforward view of devices and the connections between them and PRTG offers some more sophisticated mapping options as well. If you have a WAN you can get your devices and links plotted on a map of the world that has a zoom option. PRTG includes a distinctive sunburst map format, which shows each hardware element, service, and application that support each other. A design tool lets you create your own custom maps.
The network traffic analysis section of PRTG uses Ping to detect the packet loss rate on each of the links on your network. The data flows detected by PRTG can be filtered by application, endpoint addresses, or protocol/port number. This tracking extends out over the internet to cover links to remote sites and cloud services. The network-tracking also covers any wifi systems that you operate in your offices.
Traffic flows are registered through the use of NetFlow, IPFIX, jFlow, and sFlow. PRTG also includes a packet sniffer to gather sample data for analysis. The SNMP capabilities of the monitor gets bandwidth capacity feedback from each network device and you can set alerts that will notify you when each piece of equipment is approaching full capacity.
PRTG is capable of monitoring VLAN traffic, particularly VoIP traffic passing over the data network. The monitor can log your traffic flows that are tagged for the QoS, CBQoS, and IP SLA standards.

The dashboard of PRTG includes charts and dials to help you see statuses quickly. Alert conditions show up in red, which makes them easy to spot. Alerts can be sent to you by email notification or SMS message. You can also decide which team member receives alerts for specific data sources or alert types. It is also possible to customize the dashboard to give different team members access to different functions. The reporting tool provides a good source of presentation material when you are called upon to explain the capacity of the system and its ability to take on new requirements.
Who is it recommended for?
This package is a good deal for businesses that want ongoing automated network monitoring plus tools for capacity planning. You can gather traffic data over time and also use a protocol analyzer in the package to identify the systems that use up most of your network bandwidth.
Pros:
- Integrated Monitoring Solution: Offers a unified platform for monitoring networks, applications, and servers.
- Highly Customizable Monitoring: Allows for the creation of custom sensors to meet specific monitoring needs.
- Extensive Sensor Templates: Features a wide range of templates for popular applications and devices, simplifying setup.
- Network Autodiscovery: Quickly maps the network and begins collecting performance metrics automatically.
Cons:
- Complexity: While feature-rich, PRTG’s depth and breadth require a significant investment of time to master all functionalities.
The PRTG system ships with a large number of ‘sensors’. Each condition on a network is monitored by one of these sensors. For example, the package includes a Ping sensor, a packet sniffing sensor and a NetFlow sensor. You don’t have to turn all of the sensors on, so the PRTG system can be tailored to cover just one aspect of your infrastructure. The service is charged according to the number of sensors that you activate. PRTG is free if you only need to monitor up to 100 sensors. You can get a 30-day free trial of PRTG with unlimited sensors.
4. Nagios XI

Nagios XI is an infrastructure management package that covers networks and servers. The processing engine of Nagios is an open-source project. You can use it for free in the guise of Nagios Core. This free tool doesn’t have a very good interface, however, and you won’t find much support for analysis and capacity planning in it. In order to get a better dashboard, you would either have to research other analysis tools that are compatible with Nagios or upgrade to the paid Nagios product, which is Nagios XI.
Key Features:
- SNMP-Based Monitoring: Utilizes SNMP for comprehensive device monitoring and management.
- Automated Discovery and Inventory: Automatically discovers network devices, creating a detailed inventory for easier management.
- Dynamic Network Mapping: Generates network topology maps, offering valuable insights for network planning and optimization.
Why do we recommend it?
Nagios XI is a well-established system monitoring package. The company split out its network traffic analysis functions years ago and those utilities are now in a package called the Nagios Network Analyzer. However, you can gather traffic data with SNMP, which is still included in the package.
Nagios XI runs on RHEL and CentOS Linux. It isn’t available for Windows, but you could get it on a Windows environment by running it through a virtual machine (VM). The command center can communicate with devices running non-Linux operating systems and firmware and it can also monitor virtual environments. The monitor extends to remote locations, cloud servers, and wifi systems.
Unlike the other network tools on this list, Nagios doesn’t use SNMP to monitor network devices. It has its own proprietary method built into the Nagios Core engine, which communicates with devices to gather status reports. The metrics that are gathered regularly by the monitor appear as live data in the dashboard and you can also opt to store data for analysis later. The Nagios community is a forum where you can pose questions and get tips from other Nagios users. Many users produce their own modules for Nagios because the system can be extended by plug-ins. There is an SNMP plug-in available from the community if you want to stick to this industry-standard monitoring method rather than the default Nagios monitoring routines.
The types of data that you can monitor with Nagios include device capacity, bandwidth usage over time, and packet loss on each link. The interface includes a capacity trend graph that shows you how data throughputs and system usage has expanded over time, continuing on to predictions of future capacity needs.
Nagios XI maintains a device inventory and presents you with a network map, which is drawn automatically. The map and all data can be set to replay traffic data during your capacity planning exercise. This enables you to see the network’s capacity performance over several days at one time.
The dashboard is completely customizable. When you buy Nagios XI you get a package of widgets. You pick a widget and place it on the dashboard canvas, thus producing your own layout that features the metrics that are important to you. You can create several versions of the dashboard and allocate them to user roles. You are also able to set up user accounts for access to the Nagios system and you allocate a role to each account. This enables you to create different views and controls for the network and allocate those dashboards to different team members.
Nagios XI includes some pre-written report formats, but you can also create your own layouts in a reporting tool that is included in the package. The graphs and other data visualizations, such as the network plan, can all be printed out to provide you with presentation material to support collaborative decision-making.
Who is it recommended for?
Nagios XI is not cheap. Small businesses should consider Nagios Core, which is the free version of Nagios XI. There isn’t a free edition of the Nagios Network Analyzer. Although both Nagios XI and Nagios Core can be expanded by free plug-ins, there aren’t any traffic analysis utilities in the Nagios Exchange library.
Pros:
- Open-Source Flexibility: Offers the core functionality for free, with additional features available through the paid version.
- Automatic Device Detection: Simplifies device management with its effective autodiscovery feature.
- Agent-Based Monitoring Option: Provides the flexibility to monitor devices using an additional agent, enhancing data collection.
Cons:
- Interface Usability: The user interface could be more intuitive and offer better customization options.
- Network Mapping Enhancements Needed: The visualizations and details provided in network maps could be more informative and user-friendly.
- Additional Costs for Support: Access to professional support services requires a separate, paid agreement.
You can try out Nagios XI before you invest any of your company’s money in the system by taking up a 60-day free trial. Nagios XI is available in two levels of service. The pre-written capacity planning capabilities are only included with the higher service level. However, you could create your own capacity planning reports or look for free planning add-ons from the community if you opt for the cheaper version of the tool.
5. SolarWinds Flow Tool Bundle

The SolarWinds Flow Tool Bundle is a free set of tools for testing network traffic volumes. The tool works with NetFlow v5 messaging through Cisco routers. NetFlow was invented by Cisco Systems to aid in the analysis of traffic patterns on networks. It can capture IP headers and send them to a collector for viewing and storage and it can also produce packet summary data on aggregated packet traffic.
Key Features:
- NetFlow Emulation: Simulates NetFlow traffic for testing purposes.
- Comprehensive Traffic Generation: Creates network traffic to assess performance and capacity.
- Router NetFlow Configuration Management: Streamlines the management of router NetFlow settings.
- Network Traffic Replay: Offers the capability to replay network traffic for troubleshooting and analysis.
Why do we recommend it?
The SolarWinds Flow Tools Bundle is a free package that helps you communicate with Cisco network devices and ensure that its NetFlow recording module is active and contactable. The system also lets you store or generate network traffic that you can run over the network for capacity testing.
The great advantage of the NetFlow system is that it doesn’t dump out all of the contents of the packets traveling around the system, so there is no danger that network admin staff will break the confidentiality of the company’s data while analyzing traffic flows. One downside of leaving NetFlow on all the time is that it will create extra traffic on the network and also generate large volumes of data that will need to be stored.
One of the elements of the Flow Tool Bundle helps you manage the activation of NetFlow on your routers. The other two tools in the pack aid with network testing. These three utilities are:
- NetFlow Configurator
- NetFlow Replicator
- NetFlow Generator
The NetFlow Configurator acts as an interface to your Cisco routers so that you can turn NetFlow on and off easily and tell the routers where to send the Netflow data. This saves you from having to visit each router, log in to it and click down through the menu to find the NetFlow function. So, the NetFlow Configurator is a very simple tool, but it will save you a lot of time.
The NetFlow Replicator lets you replay traffic data through your network. This will help you to see what happened on the network while you were occupied with other tasks. This is a great way to see errors, bottlenecks, and traffic slowdowns. If the problem was caused by a temporary fault on a network device, those traffic challenges won’t arise during the rerun. If the problems were caused by a traffic surge. You will be able to see it and take action accordingly.
The NetFlow Generator will create fake traffic for you so that you can see how your current network infrastructure will cope with increased load. Although you should be able to calculate this on paper by adding expected increases in volume to your current throughput, actually seeing those traffic patterns live will make sure that you haven’t overlooked any part of the system. This is also a good exercise to test the capacity and efficiency of your load balancers, firewall, and network monitoring software to make sure that they can all cope with planned expansions in demand.
Who is it recommended for?
This free package is useful for network capacity testing. You can stress test your network and ensure that you really have the capacity that your plans say you have. The software for this package installs on Windows Server and it only deals with the Netflow service of Cisco devices.
Pros:
- Cost-Free Tools: Offers a set of tools at no cost, providing value for network testing and analysis.
- Ideal for Cisco Devices: Specifically designed to work well with Cisco equipment, ensuring compatibility.
- Simulated Traffic Testing: Enables the simulation of network traffic to evaluate infrastructure before implementation.
- Traffic Pattern Replication: Facilitates the replication of traffic patterns to identify and troubleshoot network issues.
Cons:
- Basic Visuals: The graphical representation of data is somewhat basic, lacking in-depth visualization features.
The three utilities on the Flow Tool Bundle will give you a free method to plan your network capacity and analyze any shortcomings in your current set up.
6. WhatsUp Gold with Network Traffic Analysis add-on

WhatsUp Gold is a network monitor that focuses on the health of network equipment. The company that produces WhatsUp Gold, Progress (formerly Ipswitch), created a series of add-on modules that integrate into its main product. One of these, the Network Traffic Analysis Add-on will give you data about traffic flow across network links. Both of these software packages run on Windows Server.
Key Features:
- Detailed Bandwidth Usage Analysis: Offers in-depth insights into how bandwidth is utilized across the network.
- Supports Multiple Flow Protocols: Compatible with NetFlow, NetFlow Lite, IPFIX, jFlow, sFlow, and QUIC for versatile traffic data collection.
- Effective Traffic Shaping: Includes tools for traffic shaping to optimize network performance and manage bandwidth efficiently.
Why do we recommend it?
WhatsUp Gold is a network device monitor and it can be expanded by add-on modules. The Network Traffic Analysis add-on will provide traffic data extraction and give you capacity planning services. The combination of the core package and the Network Traffic analysis add-on is very similar to the SolarWinds Network Bandwidth Analyzer Pack.
When you install WhatsUp Gold it will search the network and record all of the network devices. The system builds up an inventory of your network devices, including their bandwidth capacity. The software will automatically draw up a network map from this information.
The WhatsUp Gold monitor continues to query all devices to get an update on their statuses. This includes the amount of throughput that each device is handling. The information derived from these queries gets updated in the equipment inventory and also gets reflected in the network map. An extra benefit of this process is that you don’t have to update the inventory or redraw the map if you add or remove devices. Each piece of equipment in the network map is shown as a round icon. The edge of the disk is color-coded to show the health of the device that it represents. If the device approaches its full capacity, that circle will turn red.
The links drawn on the network map are also color-coded. Those statuses are gathered by the Network Traffic Analysis add-on. This module receives traffic metrics from network devices via a number of messaging protocols. These are NetFlow, NetFlow Lite, IPFIX, jFlow, sFlow, and QUIC.
The main WhatsUp Gold package and the Network Traffic Analysis add-on will provide you with all of the information on existing traffic capacity and utilization for your capacity planning exercise. If you need to run a test of the new applications that you want to add to the network, you can use the CBQoS and NBAR capabilities of the Network Traffic Analysis module to track its traffic patterns.
For analysis and capacity planning, the traffic monitor presents data that can be sorted, filtered, and aggregated to show you the capacity of each link and network device. These traffic patterns can be derived from live data as well as historical data. This shows the peak traffic events on each network element. You can apply analysis to a group of devices, which enables you to focus just on the areas of the network that will be affected by new projects.
Who is it recommended for?
The WhatsUp Gold system is very easy to get running. The software installs on Windows Server or Windows and then it scans the network to create a device inventory and network map. So, any business that can afford the software would benefit from its use as a monitoring system and capacity planning tool.
Pros:
- Intuitive User Interface: Well-designed interface that simplifies monitoring and analysis tasks.
- Extensive Device Compatibility: Supports a broad array of flow-enabled devices, enhancing network visibility.
- Virtual and Physical Hardware Monitoring: Capable of monitoring both virtual environments and physical hardware, offering comprehensive coverage.
- User Experience and Feature Balance: Achieves a good balance between providing an excellent user experience and offering robust monitoring capabilities.
Cons:
- Windows-Only Availability: Restricted to Windows operating systems, limiting its use in mixed or non-Windows environments.
- Resource Monitoring Limitations: The free version’s monitoring capabilities are limited to up to five resources, which may be insufficient for larger networks.
The WhatsUp Gold system ships with standard reports that show traffic by a range of different attributes. These reports can show a league table of the top sources of traffic by software package, application, protocol, or IP address. Data in the dashboard is represented in lists and also in graphical content such as line graphs, charts, and dials. The data presentation features of this software will help you explain the network status to non-technical staff. You can get a 30-day free trial of WhatsUp Gold and the Network Traffic Analysis add-on to put them through their paces.
Choosing a Network Capacity Planning Tool
All the tools suggested in this list are produced by vendors with long-standing in producing tools for network monitoring, so any decision among a tool will come down to features and pricing. All tools in the list come with good documentation and ongoing support. If you are a smaller organization, you might want to test the waters with PRTG Network Monitor.
Do you use network monitoring tools that give you capacity planning support? Which is your favorite tool? Have you tried and rejected other network planning software that isn’t on our list? Do you recommend any of the systems that we have featured in this guide? Let us know about your experience by leaving a message in the Comments section below.
Network Capacity Planning FAQs
What is network capacity planning?
Network capacity planning is a process through which you estimate the requirements for the network in terms of data throughput carrying capabilities. This consideration should examine traffic patterns end-to-end between two nodes on the network selected in turn and also on each link.
How do you determine the capacity of your network?
The straightforward way to identify the capacity of your network is to note down the full capacity of each switch and router on your network and also the throughput capacity of the cable you use. The lowest of these numbers is your maximum network capacity because it represents a bottleneck.
How is network capacity measured?
Network capacity is also known as bandwidth. The capacity is measured as the maximum number of bits that pass through each switch and router per second. You can read off the data throughput rate live from the console of each network device. However, the capacity of each device is fixed by its physical structure. This number will be visible in the device’s console and it will also be printed on the spec of the device.

