
Switches and cable form the infrastructure of your network. So, it is very important to monitor the performance of your switches. If there is something wrong with one switch, a whole segment of your network will be cut off.
Monitoring software is able to spot problems early. There are a number of warning signs that indicate that an issue is building. Fixing those errors quickly heads off serious problems and prevents the network from grinding to a halt.
Here is our list of the best switch monitoring software packages:
- Paessler PRTG EDITOR’S CHOICE A collection of monitors that includes switch monitoring with SNMP, NetFlow, and other traffic sampling standards. Start a 30-day free trial.
- ManageEngine Switch Monitoring with OpManager (FREE TRIAL) A package that includes a network performance monitor, a traffic analyzer, a switch port manager, and a network configuration manager. Start a 30-day free trial.
- Site24x7 Switch Monitoring (FREE TRIAL) A complete set of monitoring strategies that include SNMP management, traffic flow analysis, and switch port monitoring. Start a 30-day free trial.
- Datadog Network Monitoring A cloud-based monitoring service that offers network performance monitoring and traffic analysis.
- SolarWinds Network Bandwidth Analyzer Pack A combination of SNMP network performance monitoring and traffic analysis with NetFlow. This service also monitors routers, servers, and applications to provide a full suite of system management tools.
There are four types of switch monitoring software:
- Switch port monitor – Records the activities of each active port on a switch
- Network traffic analyzer – Samples passing data frames and compiles traffic statistics
- Network performance monitor – Checks on the statuses of switches
- Network configuration manager – Controls the settings of switches
All of the variables that can improve or impair network transfer rates are contained in the switches of your network. So, switches govern the speed at which data can travel around your network.
Switch port monitoring
Switch port monitoring is a crucial network management technique used to enhance security, optimize performance, and troubleshoot issues within a local area network (LAN). It involves observing the activity on individual switch ports to gather data regarding network traffic, detect potential security breaches, and ensure that devices connected to those ports are functioning correctly. This method is particularly valuable in larger networks, where a significant number of devices and ports need to be monitored simultaneously.
In practice, switch port monitoring allows network administrators to track the flow of data through each port on a network switch, offering insights into bandwidth usage, packet types, and potential problems. This information helps in diagnosing network issues, such as latency, packet loss, or misconfigurations. Furthermore, it enhances security by allowing for the detection of unusual or unauthorized activity on specific ports, such as attempts to breach the network or introduce malicious traffic.
A key feature often integrated into modern switches is autosensing. Autosensing refers to a switch’s ability to automatically detect the speed and type of device connected to a port, adjusting its settings accordingly for optimal communication. For example, when a device is plugged into a switch port, autosensing enables the switch to identify whether the device is running at 10 Mbps, 100 Mbps, or 1 Gbps and configure the port to operate at the appropriate speed. This eliminates the need for manual configuration, saving time and reducing the risk of human error. Additionally, autosensing can detect whether a device supports full-duplex or half-duplex communication, adjusting the port’s settings for efficient data transmission.
Switch port monitoring, along with autosensing capabilities, significantly improves the flexibility and reliability of a network, ensuring it runs smoothly while providing the necessary visibility for administrators to maintain and secure their systems.
You can read more about switch port monitoring in the Switch Port Monitoring Guide.
Network traffic analysis
Network traffic analyzers provide another strategy for ensuring traffic flows around the network at optimum speed. As explained above, traffic capacity is really an issue with switch capacity. So, traffic flow analyzers, like switch port managers, extract throughput data from the switch.
Network traffic analyzers are also known as NetFlow monitors, named after the Cisco switch statistics gathering protocol. There are other proprietary protocols: J-Flow (Juniper Networks), IPFIX (Cisco), Netstream (Huawei), and AppFlow (Citrix). The main non-proprietary standard is sFlow. When choosing a network traffic analyzer, you should ensure that it is able to communicate with the traffic flow analysis protocols that all of your switches use.
NetFlow traffic analyzers build up a picture of activity on each switch over time. They show live traffic statistics for each stretch of cable and also display how capacity on each switch port is utilized.
Historical data shows demand variation patterns over time. It can also identify which protocols and therefore, which applications are producing the most traffic. Traffic analysis tools aid in the implementation of traffic shaping measures, such as prioritization and queuing.
You can read deeper into the topic through the article The Best NetFlow Analyzers & Collector Tools for 2021. Ultimately, network analyzers support network capacity planning. You can learn more about this process by reading the Network capacity planning tutorial.
Network performance monitor
The majority of switch monitoring software that you will encounter are network performance monitors. This category of monitoring system exploits the Simple Network Management Protocol (SNMP). All switches are shipped with an SNMP agent. The SNMP agent collects status information from the switch that hosts it and fills in a form. However, it will only release that form (called a MIB) if it receives a request from an SNMP manager. Network performance monitors operate as SNMP managers.
If a serious problem arises on a monitored switch, the SNMP agent will send out a status report without waiting for a request. This is called a Trap. Network performance monitors interpret SNMP Trap messages as alerts. An alert will be shown in the monitoring console and can also be sent out as an SMS message or email.
You can read more about SNMP and how it operates in the Definitive Guide to SNMP and What is an SNMP Trap?
Network configuration manager
The performance of switches can be altered by changing their settings. Unfortunately, some switch settings make it easier for hackers to explore the system without being detected. These configuration weaknesses are called “vulnerabilities”.
You can subscribe to a vulnerability scanning service that will highlight changes that you need to make around your system in order to tighten up security. One area that is included in these assessments is the configuration of switches.
A configuration manager stores that configuration of each switch type as an image. It will then apply the same configuration to all switches on your network of the same make and model. The configuration monitor periodically checks on each switch’s settings. If it notices a change, the configuration manager reapplies the stored image to the altered switch, restoring its authorized settings.
You can read more about network configuration managers in the Best Network Configuration Management Tools.
The best switch monitoring software
You will need a range of monitoring packages in order to fully manage a switch. Traditionally, network management software producers create separate tools to monitor network device performance traffic flows, switch configuration, and switch port activity.
Fortunately, many of the separate modules produced by the same software house are built on a common platform and those monitoring tool providers offer bundles of tools that fit together well.
Our methodology for selecting a switch monitoring system
We reviewed the market for network device monitors and analyzed the options based on the following criteria:
- The use of the Simple Network Management Protocol for communicating with switches
- A tool for querying with traffic flow protocols, such as NetFlow
- Configuration backup a change blocking
- Autodiscovery for all network devices
- Network topology mapping
- A free trial or a demo system that offers an opportunity to try the tool before paying
- Value for money, represented by a comprehensive tool offered at a reasonable price
Using this set of criteria, we looked for monitoring systems that will track the performance of switches and other network devices, offering alerts for arising problems.
1. Paessler PRTG (FREE TRIAL)

Paessler PRTG is a collection of monitoring systems. Each is called a “sensor”. The price you pay for the package depends on how many sensors you want to turn on.
Key Features:
- Versatile Monitoring: Employs SNMP, NetFlow, and sFlow for comprehensive network, server, and application monitoring.
- Sensor-Based Flexibility: Offers a customizable approach with various sensors tailored to specific monitoring needs.
- Free Entry-Level Version: Provides a no-cost option for small-scale monitoring, perfect for initial assessments or small networks.
Why do we recommend it?
Paessler PRTG is a monitoring package for networks, servers, and applications. It starts with a network discovery routine that creates a network inventory. The system also offers network topology maps. PRTG constantly polls switches and routers for status reports and it also extracts traffic data with NetFlow, IPFIX, sFlow, and J-Flow.
Among PRTG’s list of sensors are several that examine the statuses and performance of switches. These include a Ping sensor that can be directed to a specific device on the network. It can also be used to test devices on remote networks across the internet.
A CPU load sensor and a memory sensor use SNMP to check on the capacity and utilization of each switch. PRTG is also able to perform bandwidth analysis. It uses NetFlow and sFlow to measure traffic throughput at each switch and it also has a port monitoring sensor to identify which port on which switch is causing bottlenecks in traffic flow.
PRTG includes hundreds of sensors, so you don’t need to limit its use for switch monitoring. The system is also able to monitor firewalls, routers, servers, and applications. There are a number of combined services that draw on a range of sensors to provide drill-down analysis so you can quickly discover the root cause of a problem on the network.
The service includes an SNMP network performance monitor that will watch the network for you. This service issues alerts on the monitoring console and also through emails and SMS messages when problems arise.
Who is it recommended for?
This is an affordable package because you buy an allowance of sensors and then only activate those monitors that you need. So, you don’t pay a top price for a package full of monitors for technology that you don’t have. If you only activate 100 sensors, you don’t have to pay anything.
Pros:
- Comprehensive Device Monitoring: Utilizes packet sniffing, WMI, and SNMP for in-depth surveillance of switches and other network devices.
- Customizable Interface: Features a fully customizable dashboard and drag-and-drop editor, catering to both individual and team needs.
- Alert Diversity: Supports a broad spectrum of notification methods, including SMS, email, and integration with third-party platforms like Slack.
- Application-Specific Sensors: Offers specialized sensors for targeted monitoring, such as VoIP traffic analysis, enhancing specific application oversight.
- Freeware Availability: Provides a version free of charge, making it accessible for users with limited needs or for trial purposes.
Cons:
- Complexity: The breadth of features and sensors necessitates a substantial learning investment, potentially daunting for new users.
PRTG installs on Windows Server and you can put it through its paces on a 30-day free trial. The trial package is the full PRTG system with all sensors activated. This enables you to work out which sensors you really need before you have to pay for the software.
EDITOR'S CHOICE
Paessler PRTG is our top pick for a switch monitoring system because it offers a comprehensive, user-friendly, and highly customizable solution for monitoring network switches and ensuring optimal network performance. Its robust feature set, scalability, and ease of use make it an ideal choice for businesses of all sizes, from small networks to large enterprise environments. An important feature of PRTG is its ability to monitor a wide range of switch metrics, including bandwidth usage, port status, traffic flow, and error rates. This granular visibility allows network administrators to quickly identify and resolve issues, ensuring minimal downtime and maintaining network efficiency. PRTG supports SNMP, WMI, and packet sniffing, providing flexibility in how data is collected and analyzed. Another key advantage is its intuitive interface, which includes customizable dashboards and real-time alerts. These features enable IT teams to proactively manage network health and respond to potential issues before they escalate. Additionally, PRTG’s auto-discovery feature simplifies the setup process by automatically detecting and adding network devices, saving time and reducing manual configuration efforts. PRTG’s scalability is another reason it stands out.
Download: Get a 30-day FREE Trial
Official Site: https://www.paessler.com/download/prtg-download?download=1
OS: Windows Server or SaaS
2. ManageEngine Switch Monitoring with OpManager (FREE TRIAL)

ManageEngine OpManager is a full suite of system monitoring and management tools covering networks, servers, and applications.
Key Features:
- SNMP-Based Monitoring: Leverages SNMP for real-time performance monitoring of network devices.
- Diverse Protocol Support: Compatible with NetFlow, IPFIX, J-Flow, sFlow, NetStream, and AppFlow for extensive traffic analysis.
- Auto-Discovery and Mapping: Automatically identifies and maps network devices, providing a clear view of the network’s topology.
- Switch Port Mapper: Offers detailed insights into switch port usage, facilitating effective port management.
Why do we recommend it?
ManageEngine OpManager is based on the SNMP system. It discovers all network devices, including switches, and creates a network inventory. The tool will generate a network topology map on demand based on the information in the inventory. The SNMP polls continue on a cycle, gathering device statuses and updating the inventory.
The network monitor starts its service by automatically discovering all devices connected to the network. It creates an asset inventory from the information it gleans from this initial sweep and then draws up a network topology map. The map shows every switch on your networks and all of the links each has to other devices. If you make any changes to any switch, such as move, add, or remove any device, those alterations are shown in the asset inventory and network topology map automatically.
OpManager uses SNMP to keep tabs on the statuses of all switches on the network. The feedback from agents appears in a summary screen. From there it is possible to drill down and examine each switch. The service interprets SNMP traps into alerts that you can get forwarded as SMS messages or emails. The OpManager Plus package also includes traffic flow analysis features that show live bandwidth usage and also offer historical analysis. The bandwidth analysis tool can communicate with switches through the NetFlow, IPFIX, NetStream, J-Flow, sFlow, and AppFlow protocols.
Other tools in this package include a switch port manager and a network configuration manager. The package includes IP address management features as well. Reporting facilities in OpManager automatically produce compliance reports for SOX, PCI-DSS, and HIPAA.
Server and application performance monitors in OpManager connect to traffic analysis modules, so you can perform root cause analysis if an application suddenly starts to perform badly. This service enables you to drill down to identify exactly what is going wrong. The system includes recommendations for traffic shaping measures and an interface to help you implement them.
ManageEngine OpManager includes all four types of monitoring services needed to keep track of all network switches. This is a very comprehensive bundle that includes a network performance monitor, a bandwidth analyzer, a switch port manager, and a network configuration manager. Other features in the package include an IP address manager, server monitoring, and application performance tracking. This total package of system monitors is ideal for businesses that need to comply with data security standards.
Who is it recommended for?
The OpManager system is a server monitoring tool as well as a network device monitor. This provides value for money and the base package, which covers 10 devices is reasonably priced. There is a Free edition, but this will only monitor three devices. Run this software on Windows Server, Linux, AWS, or Azure.
Pros:
- Ready-to-Use: Features over 200 customizable widgets for personalized dashboard creation, offering immediate operational capability.
- Intelligent Alerting: Reduces false positives and alert fatigue with smart alerting mechanisms, improving network management efficiency.
- Comprehensive Integration: Seamlessly works within the ManageEngine product ecosystem, enhancing network management capabilities.
- Multiple Alert Channels: Supports alerts through email, SMS, and webhooks, ensuring timely notifications of network issues.
Cons:
- Learning Curve: The feature-rich environment requires a significant time investment to fully leverage its capabilities.
The OpManager software installs on Windows Server and Linux. ManageEngine offers the package on a 30-day free trial.
3. Site24x7 Switch Monitoring (FREE TRIAL)
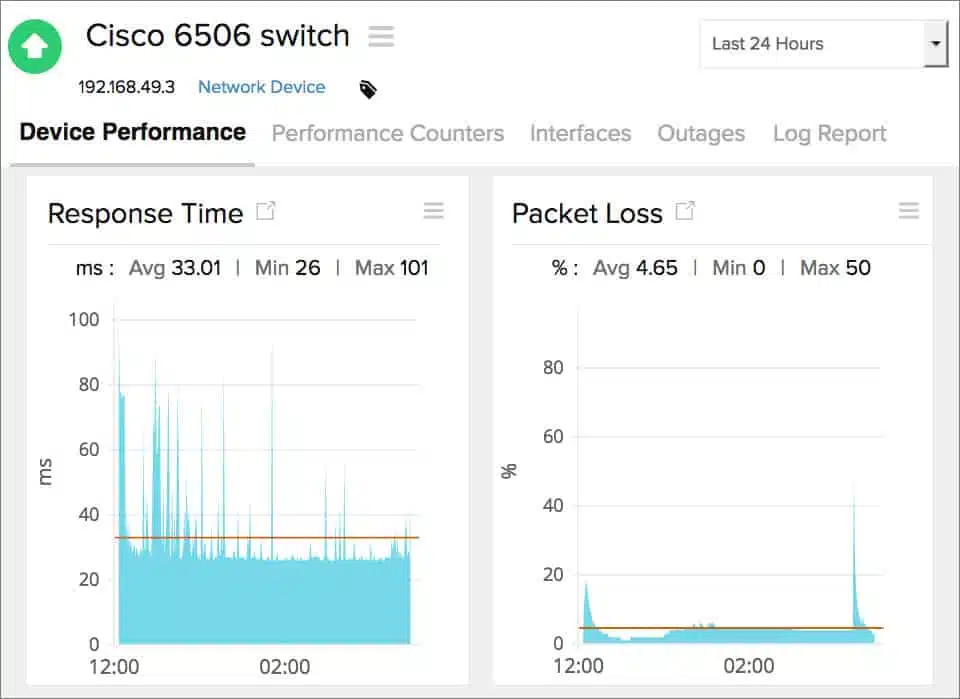
Site24x7 is a cloud-based monitoring service and it has special features for switch monitoring. This SaaS system will automatically discover and map all of your network, including its switches. Using SNMP, the monitoring system tracks CPU usage and other factors that influence switch capacity.
Key Features:
- SNMP Monitoring: Utilizes SNMP for continuous monitoring of switch performance and health.
- Versatile Flow Analysis: Supports NetFlow, IPFIX, J-Flow, sFlow, NetStream, and AppFlow for detailed bandwidth monitoring.
- Topology Mapping: Automatically generates a network topology map, offering a real-time overview of network architecture.
Why do we recommend it?
Site24x7 Switch Monitoring is delivered from the cloud with the assistance of a data collection agent that you need to install on one of your servers. The system discovers and documents all network devices. It uses SNMP to continuously check on switch statuses and also has bandwidth monitoring features.
Beyond switch status monitoring, the Site24x7 system includes bandwidth monitoring using NetFlow, IPFIX, J-Flow, CFlow, sFlow, Netstream, and AppFlow. By combining status checks and bandwidth statistics, Site24x7 is able to show live capacity information detailing throughput on every part of the network, written onto the network topology map. Throughput data can be queried per port on each switch by drilling down through the system performance summary through switch data.
The statistics summaries show which applications are the source of most traffic and watching throughput figures over time can give you an idea of what is placing the most stress on each switch and at what times of the day. The analysis also details the average packet sizes and the incidences of contention that stop switches forwarding on data in a timely manner (jabber).
Who is it recommended for?
Site24x7 doesn’t sell its Switch Monitoring service as a standalone package. Instead, you subscribe to a plan that includes network, server, and application monitoring capabilities. Switch monitoring services also have the ability to communicate with NetFlow, sFlow, CFlow, J-Flow, NetStream, AppFlow, and IPFIX for bandwidth capacity and utilization analysis.
Pros:
- Comprehensive Coverage: Offers monitoring for devices, infrastructure, and applications within a unified platform.
- Ease of Use: Recognized for its user-friendly interface, simplifying complex network monitoring tasks.
- Freeware Option: Available for smaller businesses, providing basic monitoring capabilities at no cost.
- Real-Time Discovery: Efficiently discovers and maps network devices using current data, facilitating accurate network management.
Cons:
- Extensive Features: While accessible, the platform’s wide range of features requires time to fully explore and utilize effectively.
Site24x7 is a subscription service and offers many other system monitors apart from network supervision. The switch monitoring service is part of the Site24x7 Infrastructure module, which is offered on a 30-day free trial.
4. Datadog Network Monitoring
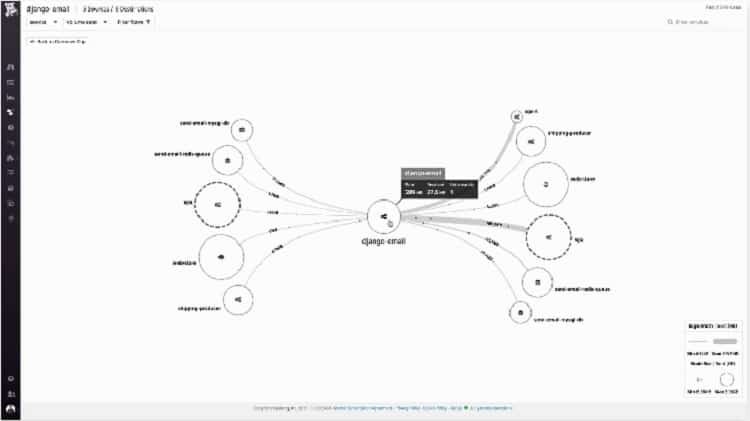
Datadog is a cloud-based IT monitoring service that includes switch monitoring tools. The service includes an autodiscovery system that identifies, logs, and maps all switches on a system, showing how they link together. The map also identifies all of the other devices that connect to your switches.
Key Features:
- Cloud-Based Solution: Offers switch monitoring from a cloud platform, ensuring accessibility and scalability.
- SNMP and Flow Monitoring: Utilizes SNMP for device monitoring and flow protocols for comprehensive traffic analysis.
- Automated Discovery and Mapping: Automatically identifies and documents network devices, creating dynamic network topology maps.
Why do we recommend it?
Datadog Network Monitoring is provided in two modules on the Datadog SaaS package. These are the Network Device Monitoring system and the Network Performance Monitoring unit. Really, you need both to get full coverage of switch and router activity. The device monitor uses SNMP and the traffic analyzer communicates with flow protocols.
Switch monitoring tools include an SNMP-based performance monitor and traffic flow querying. All of these data-gathering agents contribute to a display of live statuses shown in the system dashboard. The dashboard is resident in the cloud and can be accessed through any standard browser. The console also displays any alerts arising from SNMP trap notifications sent out by device agents. Those alerts can also be forwarded by SMS message or email.
Who is it recommended for?
Datadog is similar to Site24x7 except that with this platform, you pay for each module individually. You can subscribe to the Network Device Monitoring unit as a standalone package but if you want to use the Network Performance Monitoring module, you need to subscribe to the Infrastructure plan as well.
Pros:
- Ecosystem Integration: Supports extensive monitoring across network, applications, and infrastructure, offering a holistic view.
- Real-Time Network Insights: Features auto-discovery that generates network topology maps, updating in real-time to reflect network changes.
- Scalable Monitoring: Enables businesses to scale monitoring efforts with flexible pricing, accommodating growth without significant overhead.
Cons:
- Extended Trial Desired: A longer trial period would better facilitate comprehensive evaluation of the platform’s capabilities.
Datadog is a subscription service and there are two plans for network monitoring – one that covers performance monitoring and another that examines traffic flows. You can get both of these monitoring services on a 14-day free trial.
5. SolarWinds Network Bandwidth Analyzer Pack

SolarWinds are a leading systems monitoring software vendor and its two main network monitoring tools are available in a bundle called the Network Bandwidth Analyzer Pack.
Key Features:
- Comprehensive Protocols: Utilizes SNMP, NetFlow, IPFIX, J-Flow, sFlow, and NetStream for detailed network device and traffic analysis.
- Automatic Network Discovery: Automatically identifies and incorporates new devices into the monitoring setup, simplifying network management.
- Topology Visualization: Creates and updates a visual map of the network’s structure, aiding in easier identification of connectivity issues.
- Performance Alerts: Configurable alerts for network performance issues help in quickly addressing potential disruptions.
Why do we recommend it?
The SolarWinds Network Bandwidth Analyzer Pack provides two methods to communicate with switches, which also provides contact with routers and other network hardware. The first of these is the Simple Network Management Protocol, which checks on the statuses of switches and the second is NetFlow, which extracts traffic statistics.
The first of these two systems is the Network Performance Monitor (NPM). This is an SNMP monitoring system that polls all switches for status reports. The device agents also send out SNMP trap messages in the event of a developing status problem. The Network Performance Monitor interprets these traps into alerts, which are shown on the screen in the monitoring dashboard and can also be sent out by email or SMS.
The Network Performance Monitor shows live statuses for all switches in a summary screen and it also allows detailed views to be displayed by clicking on each device type. The registry of all switches and other devices connected to the network is compiled automatically by the tool. The system also draws up a network topology map, which gets updated automatically if there are any changes to the network.
The second element in the Network Bandwidth Analyzer Pack is the NetFlow Traffic Analyzer. This is able to extract traffic data from switches using the NetFlow protocol. It can also communicate with switches through the IPFIX, J-Flow, sFlow, and NetStream standards.
The data gleaned from querying switches shows the top traffic generators by application and can also show where traffic surges occur. By showing data from different switches located around the network, it is possible to see where the sources of excessive traffic come from and how the flow of traffic hits each switch.
The SolarWinds system includes an interface to implement and manage traffic shaping measures, to alleviate bottlenecks. The live view of the network’s utilization can let you see the results of new queuing methods and watch whether a solution at one switch creates problems of overloading another switch.
Who is it recommended for?
This is a high-end package for use by large businesses with complicated networks. The software bundle is only available for Windows Server. The “NetFlow” capability is actually a lot more comprehensive because it is able to use IPFIX, sFlow, J-Flow, and NetStream, which provides interoperability with devices from multiple providers.
Pros:
- Enterprise-Focused: Excellently suits large businesses with complex networks, providing extensive switch monitoring and traffic analysis tools.
- Integrated Solution: Combines two powerful monitoring tools for a comprehensive view of network performance and bandwidth usage.
- Intuitive Interface: Automatically highlights critical network issues, making it user-friendly despite its complexity.
- Scalable Architecture: Designed to efficiently scale with enterprise networks, offering detailed traffic analysis on a per-hop basis.
Cons:
- Not for Small Networks: Overly complex for small or home networks, making it less ideal for those environments.
- Windows Server Dependency: Requires installation on Windows Server, limiting its deployment across diverse IT infrastructures.
Both the Network Device Monitoring modules in NPM and the Network Bandwidth Analyzer install on Windows Server. SolarWinds offers the Network Bandwidth Analyzer Pack on a 30-day free trial.
Switch monitoring FAQs
How do I monitor traffic on a switch?
You can monitor the traffic on a switch by using a monitoring tool that is able to communicate with a traffic statistics protocol, such as NetFlow, J-Flow, sFlow, or NetStream.
What is port mirroring on a switch?
Port mirroring duplicates traffic on a port and you can set it up to direct that stream to a file or into a packet analysis tool.
Is port mirroring same as port forwarding?
Port mirroring and port forwarding are two different actions. Port forwarding is a pointer that automatically sends all traffic arriving on one port to another port. Port mirroring duplicates the data stream.

