
Apache Tomcat is an open-source web server and servlet container that is widely used for running Java applications. Developed by the Apache Software Foundation, Tomcat provides a platform for executing Java Servlets and JavaServer Pages (JSP), which are core components of Java web applications. While not a full-fledged web server like Apache HTTP Server, Tomcat focuses specifically on Java-based applications, offering essential services to run and manage dynamic web content.
Tomcat is known for its lightweight architecture, making it an ideal choice for small to medium-sized applications that need robust performance with minimal resource overhead. It supports key Java technologies such as Servlets and JSP, enabling developers to create dynamic, data-driven web applications. In addition to its core functionality, Tomcat also includes features like session management, load balancing, security, and logging, making it a comprehensive solution for web application deployment.
One of the major advantages of Tomcat is its ease of use and flexibility. It can be integrated with various web frameworks such as Spring and Hibernate, as well as other web servers like Apache HTTP Server, to create a more robust architecture. Tomcat is also highly configurable, with multiple options for adjusting performance, security, and connection handling to meet specific needs.
Tomcat’s active community and frequent updates ensure it stays up-to-date with the latest Java standards and best practices. With its simplicity, reliability, and scalability, Apache Tomcat is a popular choice for Java developers and organizations looking for an efficient and customizable platform for deploying web applications.
Here is our list of the best Tomcat Monitoring Tools:
- ManageEngine Applications Manager (FREE TRIAL) Watches the threads of Apache Tomcat and raises an alert if performance dips or server resources run short. Available for Windows Server, Linux, AWS, and Azure. Install the 30-day free trial.
- Site24x7 Infrastructure Monitoring (FREE TRIAL) This cloud-based package can be expanded by plugins and there is one available for Apache Tomcat monitoring. Start a 30-day free trial.
- SolarWinds Server & Application Monitor Tracks the activities of Tomcat and other applications and observers resource usage on the server that supports them. Runs on Windows Server.
- Sematext Apache Tomcat Monitoring This system watches over your Tomcat server and is part of a package that can also monitor Apache Web Server and WildFly. Available as a SaaS package or a virtual appliance.
- AppDynamics Automatic discovery plus application dependency mapping that includes live requirements forecasting implemented with AI. This is a SaaS package.
How do I Monitor Tomcat?
While network administrators on smaller networks may be able to get by on command-line scripts, ad-hoc monitoring isn’t the most efficient way to manage your resources. For more precise monitoring you will need to use an external monitoring tool. You have the choice between Java Management Extensions (JMX beans) or using a complete application monitoring solution. But before that, we’re going to look at what you should be monitoring.
What Should I be Monitoring with Tomcat?
Tomcat is a server all of its own. There are a number of metrics that you need to monitor to discover performance issues and maintain long-term performance. These are:
- Memory – One of the first things you should monitor is how much memory the server has available. A JVM with Low memory will lead to poor performance.
- Uptime – Measuring whether your server is up or down is essential for ensuring your service stays up. In the event that your monitoring tool reports that the service is down, you can start troubleshooting to find out why.
- Response time – The server should respond to user requests ASAP. If the response time is too long then you run the risk of losing users.
- Error rates – Recording the error rate shows you if there are any issues in your codebase. Monitoring error rates helps optimize your service.
- Request throughput – Monitoring request throughput tells you how many threads are active. If too many threads are active the application can perform poorly.
- Number of sessions – Measuring the number of sessions will tell you how many concurrent sessions the server can support simultaneously.
- Garbage collection – Garbage collection needs to be run at a certain frequency with the necessary amount of memory cleared once the collection is complete.
How to Query Tomcat Metrics with MBeans
If you’re using JMX beans to monitor Tomcat, you will be using JMX proxies to query metrics. However, in order to do this, you need to configure Tomcat and assign users and roles. You will need to configure the following roles: manager-jmx and manager-gui.
The first will enable the user to access the JMX proxy servlet and Tomcat’s server status; the latter allows the user to access the application manager where you can monitor for performance issues.
To assign a role to the user you need to update the conf/tomcat-users.xml configuration file and enter the following. (The command will create a new tomcat-jmx user, assign the roles listed above to the user and create a password for the account):
<role rolename=“manager-gui” /?>

<role rolename=“manager-jmx” />

<user username=“tomcat-jmx” password=“<YOUR_PASSWORD>” roles=“manager-jmx,manager-gui”/>
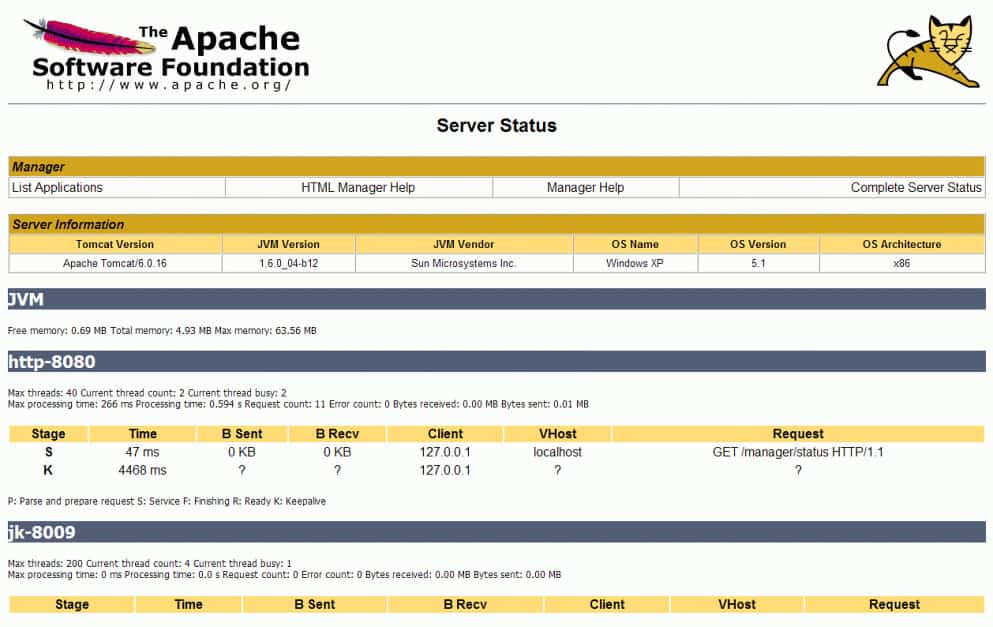
To query Tomcat metrics you will need to access a JMX proxy servlet where you can query performance metrics via the web browser. Through your web browser, you can query the data of Mbeans or managed Java objects to view information about your server. You can view a list of MBeans available to monitor by entering the following:
http://localhost:8080/manager/jmxproxy
When searching for an MBean you can add parameters to help you with your search. Parameters you can add to the command line include domain, type, name, and attribute. In the prompt these are as follows:
http://localhost:8080/manager/jmxproxy/?get=<DOMAIN>:type=<TYPE>, name=“ <NAME>”&att=<JMX_Attribute>
If you wanted to view the HTTP connector’s maximum request processing time you would enter the following:
http://localhost:8080/manager/jmxproxy/?get=Catalina:type=GlobalRequestProcessor,name="http-nio-8080"&att=maxTime
The result would be the following:
OK - Attribute get 'Catalina:type=GlobalRequestProcessor,name="http-nio-8080"' - maxTime = 189
The limitation of using Tomcat to query metrics is that you can only look up one thing at a time. It is for this reason that we recommend using a third-party server monitoring tool to track multiple metrics simultaneously.
The best tools for monitoring Apache Tomcat
If you want to monitor a range of metrics simultaneously, then you’re better off with an application monitoring solution. One of the advantages of going this route is that you have a wide range of options to choose from in terms of providers.
Our methodology for selecting an Apache Tomcat monitor
We reviewed the market for Apache Tomcat monitoring systems and analyzed tools based on the following criteria:
- A system that can track thread performance
- Memory management tracking
- Dependency mapping
- Throughput tracking
- Capacity alerts to prevent service blackouts
- A free trial or a demo that creates an assessment opportunity
- Value for money from a system that will keep Apache Tomcat serving your websites
With these selection criteria in mind, we identified the best Apache Tomcat monitoring systems.
1. ManageEngine Applications Manager (FREE TRIAL)
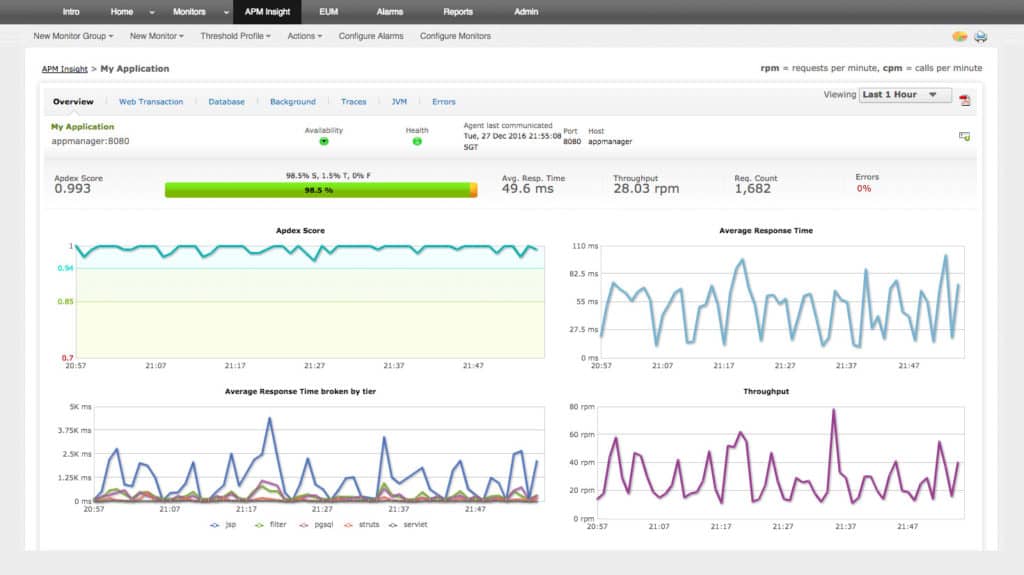
ManageEngine Applications Manager is an application monitor that can monitor Tomcat servers. The platform has the ability to monitor the CPU, memory, JVM usage, response time, and memory leaks. In addition, you can also monitor web application live sessions, JDBC connection pools, and thread pools. All of this data can be converted into graphs so that you can easily point to usage trends.
Key Features:
- CPU and JVM activity monitoring
- Memory management tracking
- Tomcat thread pool monitor
- Requirements forecasting
Why do we recommend it?
ManageEngine Applications Manager will discover and map applications and middleware down to server resources. It provides an integration for many technologies, including Apache Tomcat. This monitoring service will show you how your applications interact with each other and it produces root cause analysis when things go wrong.
The Tomcat thread pool monitor is particularly useful because it allows you to monitor pool utilization. The program displays thread utilization stats on a graph with a list of metrics shown underneath. There is the option to configure alarms to alert you if certain parameters are met. You can also schedule thread dumps to make sure that your application server doesn’t get overwhelmed.
The tool also provides performance reports. Reports not only create a historical record for your performance data but also offer performance forecasting powered by machine learning. Forecasting can tell you whether you really need the server resources that you’re paying for. Once the report is generated it can be sent onward to your team.
Who is it recommended for?
This system is a software package for Windows Server or Linux. You can also get it as a service on AWS or Azure Marketplace. The Free edition is limited to monitoring five assets. The Professional edition is priced to be accessible to small businesses and large multi-site organizations will like the Enterprise version.
Pros:
- Offers on-premise and cloud deployment options, giving companies more choices for installation
- Can highlight interdependencies between applications to map out how performance issues can impact businesses operations
- Offers log monitoring to track metrics like memory usage, disk IO, and cache status, providing a holistic view into your Tomcat environment
- Leverages machine learning to monitor Tomcat thread pools, resource utilization, and JVM usage
Cons:
- Can take time to fully explore all features and options available
ManageEngine Applications Manager is a tool designed for enterprises looking for application monitoring software that’s user-friendly. It has all the bells and whistles necessary to monitor Tomcat effectively with a competitive price point. The price ranges from $945 (£753) for 25 monitors to $7,195 (£5,740) for 250 monitors. The program is available on Windows and Linux. You can download the 30-day free trial.
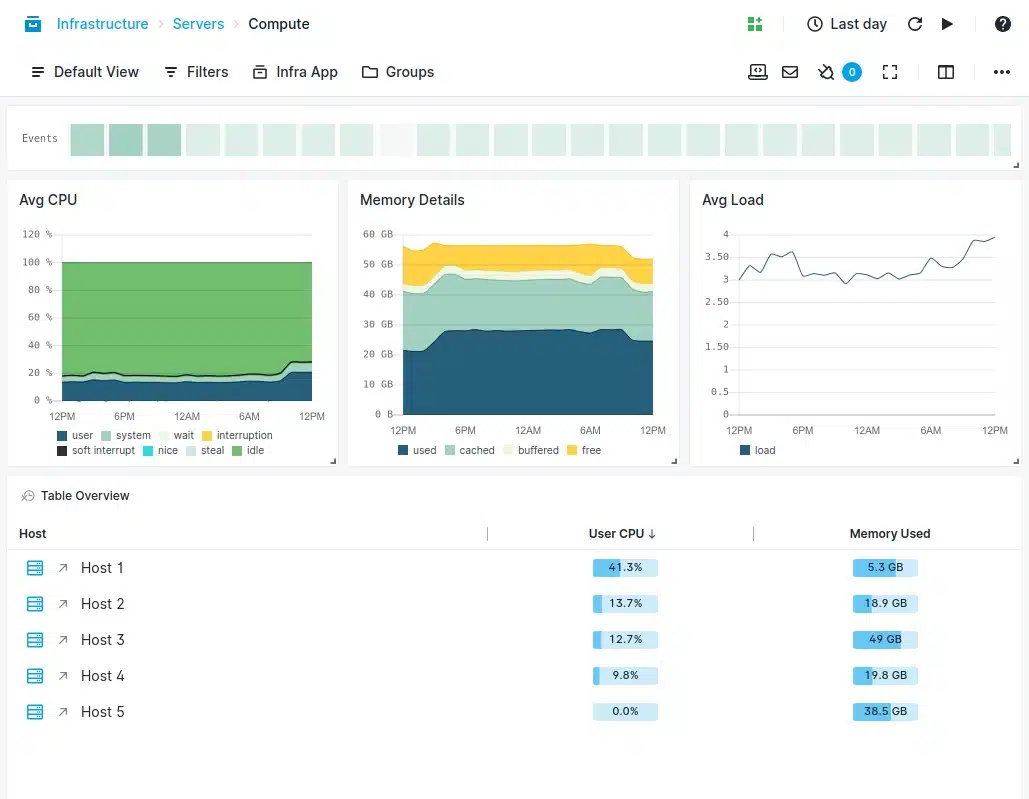
2. Site24x7 Infrastructure Monitoring (FREE TRIAL)
Site24x7 Infrastructure Monitoring is an extensible cloud-based package with a library of extensions, which add on extra features. There is a Tomcat Monitoring extension available in the plugin library.
Key Features:
- Live performance tracking
- Resource usage monitoring
- Compiler activity reports
Why do we recommend it?
The Site24x7 Infrastructure Monitoring package is delivered from the cloud and it can reach out to sites and cloud systems through the installation of agents. You get a wide range of system monitoring services with this package, not just Tomcat monitoring, so you can watch how Tomcat performs in connection with the network and other applications.
The metrics that the Tomcat monitoring system collects include CPU usage, JVM runtime memory activity, loaded and unloaded JVM classes count, heap and non-heap memory usage, JIT compiler usage, garbage collectors activity, and application server thread count. The system posts graphs on all of these factors in the Site24x7 dashboard.
There are many other metrics that you can get from the Tomcat monitoring system, such as response times and transaction counts. Each piece of data can be shown as a line graph showing recent statuses. All of this data can be a bit too much for some but fortunately, the screens in the Site24x7 dashboard can be customized. You can choose to leave off some statistics and focus on those factors that are important to you.
There are many other systems that can be added on through the plugin library of Site24x7. The package can also watch the performance of Apache Web Server and a long list of database types. Site24x7 allows one plugin for free with each subscription. More are possible, but for a fee.
Who is it recommended for?
If you run Tomcat to server your Java applications, you will need to find a performance monitor. The big benefit of the Site24x7 system is that you also get server and network monitoring in the plan. This is useful for getting a system-wide view of application delivery.
Pros:
- Memory management tracking
- Full-stack observability
- Customizable dashboard
Cons:
- No on-premises version
The Site24x7 cloud platform includes many units, including a log manager, which can be used for Tomcat performance analysis. You can examine the whole Site24x7 platform with a 30-day free trial.
3. SolarWinds Server & Application Monitor
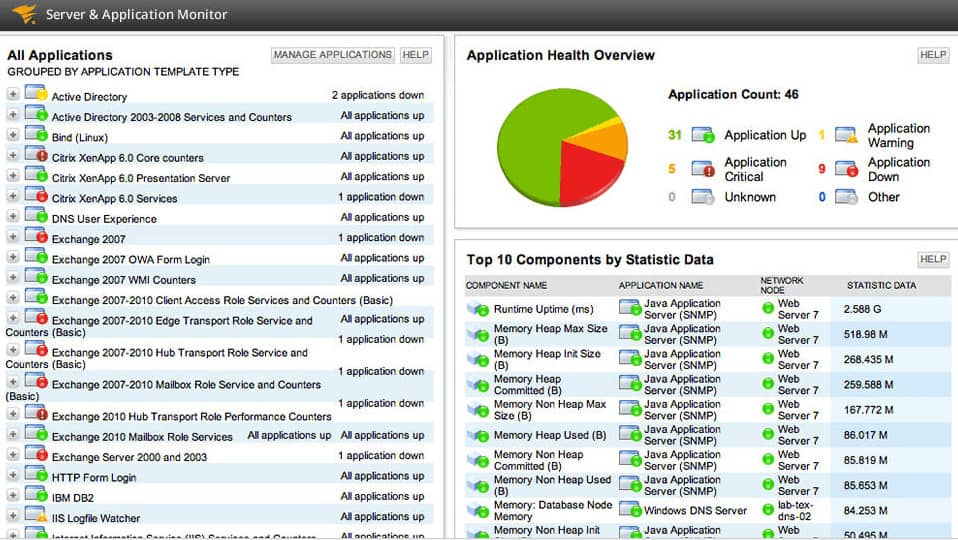
SolarWinds Server & Application Monitor is ideal for monitoring Tomcat because it comes with a set of out-of-the-box monitor templates built specifically for the server. The tool can monitor Free Memory, Total Memory, Max Memory, Total Processing Time, Request Count, Bytes Sent, Bytes Received, and Errors Count.
Key Features:
- Server resource tracking
- Memory management monitor
- JBoss monitor
- Data throughput recording
- Also monitors Geronimo
Why do we recommend it?
SolarWinds Server & Application Monitor provides performance tracking for software, middleware, and server resources. It is a customizable package that can be tailored by integrations to interface with specific products and technologies. The list of extensions available includes one for Apache Tomcat. See how the server works together with all other infrastructure.
To make for a more compelling visual experience, SolarWinds Server & Application Monitor has out-of-the-box dashboards as well. The JBoss monitoring tools feature shows performance and usage data of Apache Tomcat and Geronimo.
There are also performance reports built especially for Tomcat and Geronimo. However, these can be customized if you want to monitor different information. Once you’ve chosen how you want reports to be structured you can automate the program to send them to certain users via email.
Who is it recommended for?
This is an on-premises package that can monitor services on your site and also on the cloud. It tracks platforms and services on AWS and Azure plus SaaS packages, such as Microsoft 365. It will track Apache Web Server as well as Apache Tomcat and watch their memory and CPU usage.
Pros:
- Offers pre-built templates specifically for Tomcat monitoring
- Supports auto-discovery that builds network topology maps and inventory lists in real-time based on devices that enter the network
- Intuitive alerting and notification system
- Uses drag and drop widgets to customize the look and feel of the dashboard
- Robust reporting system with pre-configured reports for Tomcat and Geronimo
Cons:
- Designed for IT professionals, not the best option for non-technical users
SolarWinds Server & Application Monitor is recommended to those who want to monitor Apache Tomcat with a tool that is easy to use. The software is competitively priced at $2,995 (£2,389) with enough pre-configuration to get you up and running swiftly. You can download a 30-day free trial.
SolarWinds presents another purchase option with its Hybrid Systems Monitoring bundle. This provides the Server & Application Monitor along with the Virtualization Manager, the SolarWinds Log Analyzer, and the Server Configuration Monitor. This group of tools is ideal for fully tracking complicated systems, such as Java-based Web applications that cross platforms in their execution by pulling in modules and functions from many locations. The Log Analyzer helps you work out exactly which element is causing problems when your Web applications present performance issues. If the problem lies with the configuration or memory availability on your physical or virtual servers, you already have the tools to hand that will fix those issues. You can examine this bundle with a 30-day free trial.
4. Sematext Apache Tomcat Monitoring
Sematext Apache Tomcat Monitoring is part of a package of system monitoring tools delivered by Sematext under the package name Infrastructure Monitoring. The core package of this service monitors networks, servers, and applications and it can be extended by integrations, which monitor specific products. There is an integration for Apache Tomcat band also Apache Web Server and Apache WildFly, so you can track the performance of all of your Java Web applications and microservices through the Sematext package.
Key Features:
- Server performance monitoring
- Code profiling
- Distributed tracing
Why do we recommend it?
Sematext Apache Tomcat Monitoring provides two ways that you can monitor your Fortinet systems. The first of these is its Infrastructure monitoring package that provides integration to specific technologies and products. The second option is the Logs package which will collect Sysylog messages from your Fortinet appliances.
With the Sematext monitoring service, you can ensure smooth delivery of your Java applets and also track their activities when running on the Web. Your modules might have cohesion problems that slow down responses when they are used in conjunction with other systems on the Web and it is only when those functions are live that these issues can be encountered. The Sematext tool allows you to continue your testing while your Web applications are in service.
The Sematext includes a code profiler, so you can step through each line of code within your servlet containers as they operate. A distributed tracing system lets you watch the applications that your Tomcat-based code servers from start to finish. The Sematext platform includes a synthetic monitoring package and a real user monitoring service and you can add those modules on to the Infrastructure Monitoring package to get a full Web applications monitoring suite. Sematext also offers a log manager.
The Sematext Infrastructure Monitoring bundle watches over physical servers on your site and cloud platforms, including AWS, Google Cloud Platform, and Azure. This means that the service gives you full stack observability, which is ideal for root cause analysis when things go wrong. When there is a performance problem, Sematext will generate an alert and sense you a notification by email, Slack message, or Webhooks.
Who is it recommended for?
Sematext is affordable for all businesses because it is charged for by volume for the Logs package or per device for the Infrastturure Monitoring unit. There is a Basic plan for Infrastructure monitoring, which is free to use to monitor up to five hosts. Access this system on the cloud or install it on Docker.
Pros:
- Integrated full-stack monitoring
- Live activity monitoring and historical analysis
- Storage for performance metrics
Cons:
- The data retention service is the key element in the pricing structure
Sematext is a subscription service and the price you pay depends on the data retention period that you choose. If you can put up with only a 30-minute retention period, the system is permanently free to use – this is called the Basic edition. The Infrastructure Monitoring system is a SaaS package but you can choose to download the software and run it as a virtual appliance over Docker. You can get a 14-day free trial of the paid edition.
5. AppDynamics
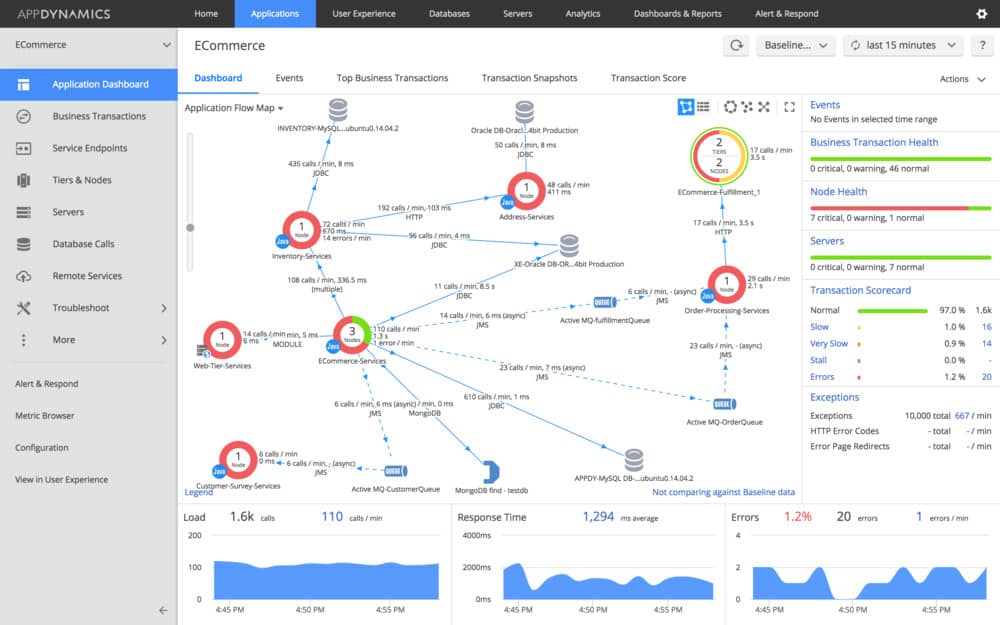
AppDynamics is an application performance monitoring solution that can monitor Apache Tomcat. AppDynamics can automatically discover application code on Tomcat and shows a top-down perspective on the performance of the entire service. With this tool, you can monitor the performance, availability, and health of your server.
Key Features:
- AI-based requirements predictions
- Application dependency mapping
- SLA baselining
Why do we recommend it?
AppDynamics is a cloud-based system that offers AI-based application performance monitoring and also tracks issues with infrastructure. The system monitors Apache Tomcat on both levels. The tool takes a slightly different view of system operations because it maps data flows to discover application components.
Who is it recommended for?
The Infrastructure Monitoring plan of AppDynamics is very affordable. However, this won’t give you full performance tracking for Apache Tomcat. The system is based in the cloud, so it can track applications as they are issued and watch their delivery. This is particularly important for Web application monitoring.
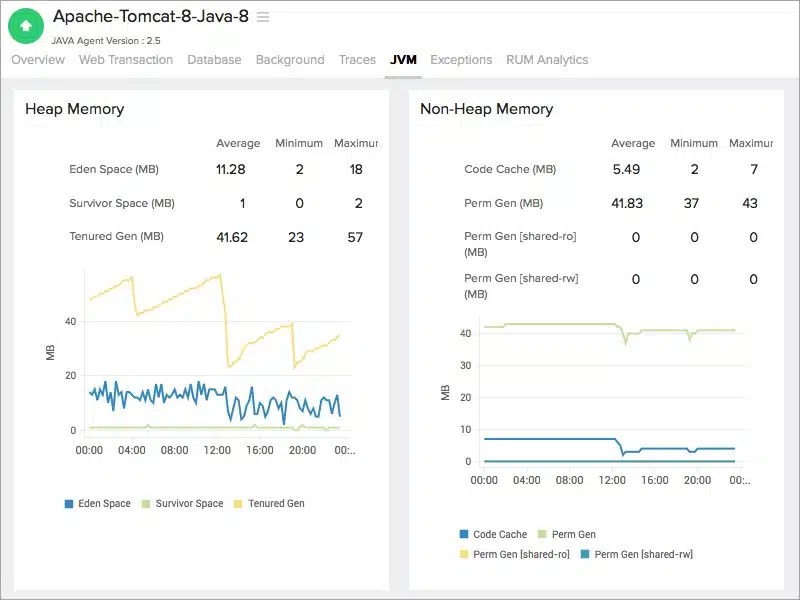
You can also monitor for more specific issues as well. Heap usage, garbage collection, and memory leaks are just some of the tricky server issues that AppDynamics can handle. Leaks are monitored automatically and the user can be sent an alert if there is a problem.
To send alerts, AppDynamics uses SLA base-lining to discover performance issues the moment they occur. The responsiveness of the alerts system helps to address application issues before they affect the end-user. There is also root-cause analysis to help get to the source of any performance problems.
AppDynamics is worth considering for organizations that want a comprehensive Tomcat monitoring tool that provides transparency right to the heart of application processes. If you’d like to know the price of AppDynamics then you can request a quote from the sales team. There is also a free trial available.
Tomcat Monitoring Tip: Choose a Method You’re Comfortable With
Monitoring Apache Tomcat relies on tracking several very specific metrics that you might lose sight of without a complete server performance monitoring platform, whether you choose to use JMX beans or application monitoring tools. Of the application monitoring tools on this list, we would recommend SolarWinds Server & Application Monitor, ManageEngine Applications Manager, or AppDynamics on account of their usability.
The key is to make sure that you’re monitoring Tomcat in a way that is comfortable for you. If you prefer the oversight of an external application monitor then use a performance monitor. If you prefer to query MBeans manually then feel free to do things this way as well!
Related post: Apache Web Server Monitoring Tools
Tomcat Monitoring FAQ
How do I monitor Tomcat thread count?
It is possible to monitor Tomcat thread statistics through JMX, however, this can be difficult to set up. It is much better to use a monitoring tool that has specialized routines for Tomcat monitoring together with server and JVM monitoring capabilities.
How many sessions can Tomcat handle?
The number of sessions that a Tomcat instance can handle is dictated by the maxThreads setting. By default, this is 200 so you would need to change this value in order to get more sessions active. Reports from testers suggest that Tomcat can manage up to 13,000 threads, which, put in other terminology is 13,000 connections or 13,000 sessions.
How do I know if Tomcat is running?
The default port for Tomcat is 8080. To check if Tomcat is running, open any browser and enter the address http://localhost:8080. If Tomcat is running, you will see the Tomcat homepage in your browser. You might have set up Tomcat to run on some other port. If that is the case, enter that port number instead of 8080. You can see that port setting in conf/server.xml.

